Publisher’s version / Version de l'éditeur:
Analytical Chemistry, 83, 2, pp. 555-562, 2010-12-23
READ THESE TERMS AND CONDITIONS CAREFULLY BEFORE USING THIS WEBSITE. https://nrc-publications.canada.ca/eng/copyright
Vous avez des questions? Nous pouvons vous aider. Pour communiquer directement avec un auteur, consultez la première page de la revue dans laquelle son article a été publié afin de trouver ses coordonnées. Si vous n’arrivez pas à les repérer, communiquez avec nous à [email protected].
Questions? Contact the NRC Publications Archive team at
[email protected]. If you wish to email the authors directly, please see the first page of the publication for their contact information.
NRC Publications Archive
Archives des publications du CNRC
This publication could be one of several versions: author’s original, accepted manuscript or the publisher’s version. / La version de cette publication peut être l’une des suivantes : la version prépublication de l’auteur, la version acceptée du manuscrit ou la version de l’éditeur.
For the publisher’s version, please access the DOI link below./ Pour consulter la version de l’éditeur, utilisez le lien DOI ci-dessous.
https://doi.org/10.1021/ac102338n
Access and use of this website and the material on it are subject to the Terms and Conditions set forth at
Metabolic fingerprinting of biofluids by infrared spectroscopy:
modeling and optimization of flow rates for laminar fluid diffusion
interface sample preconditioning
Schattka, Bernhard; Alexander, Murray; Low Ying, Sarah; Man, Angela;
Shaw, R. Anthony
https://publications-cnrc.canada.ca/fra/droits
L’accès à ce site Web et l’utilisation de son contenu sont assujettis aux conditions présentées dans le site
LISEZ CES CONDITIONS ATTENTIVEMENT AVANT D’UTILISER CE SITE WEB.
NRC Publications Record / Notice d'Archives des publications de CNRC:
https://nrc-publications.canada.ca/eng/view/object/?id=4ae7be5d-c9a4-4e1b-a729-79ce31082be9
https://publications-cnrc.canada.ca/fra/voir/objet/?id=4ae7be5d-c9a4-4e1b-a729-79ce31082be9
Metabolic Fingerprinting of Biofluids by Infrared
Spectroscopy: Modeling and Optimization of Flow
Rates for Laminar Fluid Diffusion Interface Sample
Preconditioning
Bernhard Schattka, Murray Alexander, Sarah Low Ying, Angela Man, and R. Anthony Shaw*
National Research Council of Canada, Institute for Biodiagnostics, 435 Ellice Avenue, Winnipeg, Manitoba, Canada. R3B 1Y6.
The laminar fluid diffusion interface (LFDI) is a micro-fluidic tool that manipulates the composition of liquid mixtures by exploiting differences among diffusion coef-ficients of the dissolved components. One application is the preprocessing of (bio)fluids prior to spectroscopic characterization. For example, in the case of infrared (IR) spectroscopy, the technique can improve sensitivity to low-concentration serum metabolites. The practical ben-efit is “metabolic fingerprinting” measurements that are more sensitive to low-concentration metabolites than are the counterpart measurements for the original serum sample. Optimal use of the LFDI technique has proven elusive, since the composition of the product of interest is very sensitive to the choice of flow rates for the liquid streams entering and emerging from the LFDI channel. To provide the basis for optimal use, this study had the objective of developing a simulation package that predicts the composition of the LFDI product, given the LFDI structural and operating parameters. To demonstrate the utility of the simulations, composition of the LFDI products predicted for two illustrative sets of trials were compared with experimental data. The flow rates thus derived provided a LFDI product that is relatively rich in serum metabolites, while largely depleted of protein, and very well suited for subsequent IR spectroscopic characterization.
While infrared (IR) spectroscopy has long been recognized as a powerful tool for molecular fingerprinting, the range of applications today extends far beyond what might have been envisaged a generation ago. Today’s IR spectrometers and microspectrometers are stable and sensitive enough to usefully characterize complex biological fluids and tissues, serving both as biomedical research tools and potentially as clinical devices.1-3For example, we and others
have developed IR-based analytical methods to simultaneously quantify a number of clinically relevant analytes in blood, serum, and
urine,4-11with parallel efforts on diagnostic test development,12-27
including metabolic fingerprinting28-30 applications ranging from
diabetes18-21to mad cow disease.23-27
The spectroscopic methods most commonly associated with emerging metabolomics applications are NMR spectroscopy31-40
* Corresponding author. Phone: (204) 984-4626. Fax: (204) 984-5472. E-mail: [email protected].
(1) Modern Concepts in Biomedical Vibrational Spectroscopy; Lasch, P., Kneipp, J., Eds.; Wiley-Interscience (John Wiley & Sons): Hoboken, NJ, USA, 2008; pp 79-104.
(2) Wang, L.; Mizaikoff, B. Anal. Bioanal. Chem. 2008, 391, 1641–1654.
(3) Mattha¨us, C.; Bird, B.; Miljkovic´, M.; Chernenko, T.; Romeo, M.; Diem, M. Methods Cell Biol. 2008, 89, 275–308.
(4) Shaw, R. A.; Kotowich, S.; Leroux, M.; Mantsch, H. H. Ann. Clin. Biochem.
1998, 35, 624–632.
(5) Liu, K.-Z.; Shaw, R. A.; Man, A.; Dembinski, T. C.; Mantsch, H. H. Clin.
Chem2002, 48, 499–506.
(6) Riley, C. B.; McClure, J. T.; Low-Ying, S.; Shaw, R. A. J. Vet. Intern. Med.
2007, 21, 828–834.
(7) Liu, K.-Z.; Man, A.; Dembinski, T. C.; Shaw, R. A. Anal. Bioanal. Chem.
2007, 387, 1809–1814.
(8) Shaw, R. A.; Low-Ying, S.; Leroux, M.; Mantsch, H. H. Clin. Chem. 2000,
46, 1493–1495.
(9) Bhandare, P.; Mendelsohn, Y.; Peura, R. A.; Janatsch, G.; Kruse, Jarres H.; Marbach, R.; Heise, H. M. Appl. Spectrosc. 1993, 47, 1214–1221.
(10) Shen, Y. C.; Davies, A. G.; Linfield, E. H.; Esley, T. S.; Taday, P. F.; Arnone, D. D. Phys. Med. Biol. 2003, 48, 2023–2032.
(11) Shaw, R. A.; Low Ying, S.; Man, A.; Riley, C.; Vijarnsorn, M.; Liu, K.-Z., Mansfield, C. Infrared spectroscopy of biofluids in clinical chemistry and medical diagnostics. In Modern Concepts in Biomedical Vibrational
Spec-troscopy; Lasch, P., Kneipp, J., Eds.; Wiley-Interscience (John Wiley & Sons:
Hoboken, NJ, 2008; pp 79-104.
(12) Dubois, J.; Shaw, R. A. Anal. Chem. 2004, 76, 360A–367A.
(13) Ellis, D. I.; Goodacre, R. Analyst 2006, 131, 875–885.
(14) Shaw, R. A.; Kotowich, S.; Eysel, H. H.; Jackson, M.; Thomson, G. T. D.; Mantsch, H. H. Rheumatol. Int. 1995, 15, 159–165.
(15) Eysel, H. H.; Jackson, M.; Nikulin, A.; Somorjai, R. L.; Thomson, G. T. D.; Mantsch, H. H. Biospectroscopy 1997, 3, 161–167.
(16) Vijarnsorn, M.; Riley, C. B.; Shaw, R. A.; McIlwraith, C. W.; Ryan, D. A. J.; Rose, P.; Spangler, E. Am. J. Vet. Res. 2006, 67, 1286–1292.
(17) Staib, A.; Dolenko, B.; Fink, D. J.; Fru¨h, J.; Nikulin, A. E.; Otto, M.; Pessin-Minsley, M. S.; Quarder, O.; Somorjai, R.; Thienel, U.; Werner, G.; Petrich, W. Clin. Chim. Acta 2001, 308, 79–89.
(18) Petrich, W.; Dolenko, B.; Fru¨h, J.; Ganz, M.; Greger, H.; Jacob, S.; Keller, F.; Nikulin, A. E.; Otto, M.; Quarder, O.; Somorjai, R. L.; Staib, A.; Werner, G.; Wielinger, H. Appl. Opt. 2000, 39, 3372–3379.
(19) Petrich, W.; Staib, A.; Otto, M.; Somorjai, R. Vib. Spectrosc. 2002, 28, 117– 129.
(20) Werner, G. H.; Fru¨h, J.; Keller, F.; Greger, H.; Somorjai, R.; Dolenko, B.; Otto, M.; Bo¨cker, D. Proc. SPIE 1998, 3257, 35–41.
(21) Fru¨h, J.; Jacob, S.; Dolenko, B.; Ha¨ring, H.-U.; Mischler, R.; Quarder, O.; Renn, W.; Somorjai, R.; Staib, A.; Werner, G. H.; Petrich, W. H. Proc. SPIE
2002, 4614, 63–69.
(22) Liu, K.-Z.; Tsang, K. S.; Li, C. K.; Shaw, R. A.; Mantsch, H. H. Clin. Chem.
2003, 49, 1125–1132.
(23) Schmitt, J.; Beekes, M.; Brauer, A.; Udelhoven, T.; Lasch, P.; Naumann, D. Anal. Chem. 2002, 74, 3865–3868.
(24) Lasch, P.; Schmitt, J.; Beekes, M.; Udelhoven, T.; Eiden, M.; Fabian, H.; Petrich, W.; Naumann, D. Anal. Chem. 2003, 75, 6673–6678.
Anal. Chem. 2011, 83, 555–562
and mass spectrometry (MS).41,42One very attractive feature of
NMR spectroscopy is that discrete chemical species generally give rise to discrete spectroscopic patterns that are well-resolved from one another in the spectra of serum and urine. Many of the observed features can therefore be assigned to specific metabo-lites. The clearest distinguishing features of mass spectrometry as applied to metabolic fingerprinting are the very high sensitivity and broad metabolite coverage. These attractions are counterbal-anced by inherent limitations in metabolite quantification (each metabolite requires a separate authentic standard) and by the requirement for fairly elaborate sample preparation and introduc-tion, e.g., by liquid chromatography.
From many perspectives, infrared spectroscopy is the ideal analytical/diagnostic fingerprinting technique. Response is typi-cally linear, the measurement is rapid, andsperhaps most importantlysthe cost is low enough and the technique straight-forward enough to allow for widespread adoption/implementation of new tests as they emerge. The most significant hindrance to broad adoption of IR spectroscopy in clinical analytical and diagnostic applications is the limited sensitivity. While NMR spectra can reveal features from metabolites in the low micromolar concentration range (∼2-40 µmol/L at 600 MHz43), detection
limits for IR spectroscopy-based serum and urine metabolite assays are typically ∼500 µM.11
We have adopted a microfluidic sample preconditioning tool, the “laminar fluid diffusion interface”44-48(LFDI), as a means to
recover metabolite IR spectroscopic fingerprints that are otherwise below the detection threshold and/or masked by protein absorp-tions. The defining feature of the LFDI is that it exploits differences among diffusion coefficients to separate high molecular weight from low molecular weight fluid constituents. In the case of serum, the practical benefit is that metabolites (low molecular weight, fast diffusion) may be effectively separated from the relatively abundant proteins (high molecular weight, slow diffu-sion). The metabolite-rich, protein-depleted LFDI product stream may then be characterized spectroscopically with minimal interfer-ence from the otherwise overwhelmingly strong protein absorptions. Proof-of-concept studies have hinted at the potential benefits of LFDI preconditioning in the IR spectroscopic characterization of both serum and urine samples.49-51 Although the initial
experiments were encouraging, it was not clear that the experi-mental parameters (flow rates) were optimal for this new applica-tion. The more recent experiments were guided by model predictions; however, that model was limited by the assumptions underlying its development, in particular by the assumption of plug flow (constant velocity at all points in the microchannel cross-section).51The velocity profile is more accurately described as
parabolic,44with zero velocity at the channel walls and maximum
velocity at the channel center, and this has important implications for accurate modeling.
Our present goal is to realize the full potential of the LFDI technique as a means to expand the range of IR spectroscopy-based analytical and clinical diagnostic methods. To that end, the aims of this study were (i) to develop the capability to model the fluid flow and molecular diffusion processes that underlie the LFDI separation technique, (ii) to thereby estimate the composition expected of the LFDI product for various choices of experimental parameters (flow rates), and (iii) to compare the model-predicted LFDI product composition to experimental values. The practical objective motivating this work is to ultimately provide an inte-grated LFDI-IR metabolic fingerprinting platform with the sensitiv-ity rivaling that of NMR spectroscopic measurements.
MATERIALS AND METHODS
Laminar Fluid Diffusion Interface. The laminar fluid diffu-sion interface lies between two fluid streamssone the sample and the other the receiver fluidsflowing in parallel within a micro-channel, with flow rates chosen to ensure laminar flow. While laminar flow ensures no turbulent mixing of the two streams, there is diffusion across the interface between them.
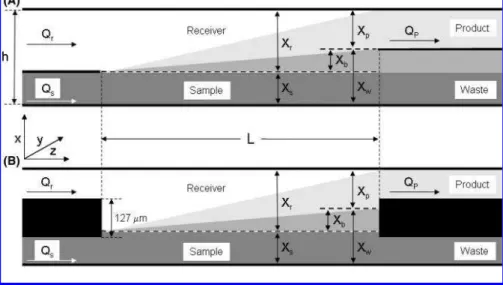
Figure 1 illustrates the essential features of the LFDI micro-channel and its use. Because the sample and receiver fluid (typically water) flow in parallel, concentration gradients develop within the receiver stream. The different diffusion rates for slow vs intermediate vs fast diffusers leads to the different concentration profiles. The essential feature of this process is that the receiver
(25) Martin, T. C.; Moecks, J.; Belooussov, A.; Cawthraw, S.; Dolenko, B.; Eiden, M.; Von Frese, J.; Kohler, W.; Schmitt, J.; Somorjai, R.; Udelhoven, T.; Verzakov, S.; Petrich, W. Analyst 2004, 129, 897–901.
(26) Menze, B. H.; Petrich, W.; Hamprecht, F. A. Anal. Bioanal. Chem. 2007,
387, 1801–1807.
(27) Lasch, P.; Beekes, M.; Schmitt, J.; Naumann, D. Anal. Bioanal. Chem. 2007,
387, 1791–1800.
(28) Lindon, J. C.; Holmes, E.; Nicholson, J. K. Anal. Chem. 2003, 75, 384A– 391A.
(29) Dunn, W. B.; Bailey, N. J. C.; Johnson, H. E. Analyst 2005, 130, 606–625. (30) Ellis, D. I.; Dunn, W. B.; Griffin, J. L.; Allwood, J. W.; Goodacre, R.
Pharmacogenomics2007, 8, 1243–1266.
(31) Bollard, M. E.; Stanley, E. G.; Lindon, J. C.; Nicholson, J. K.; Holmes, E.
NMR Biomed.2005, 18, 143–162.
(32) Ala-Korpela, M. Expert Rev. Mol. Diagn. 2007, 7, 761–773. (33) Ala-Korpela, M. Clin. Chem. Lab. Med. 2008, 46, 27–42.
(34) Serkova, N. J.; Niemann, C. U. Expert Rev. Mol. Diagn. 2006, 6, 717–731. (35) Ma¨kinen, V. P.; Soininen, P.; Forsblom, C.; Parkkonen, M.; Ingman, P.;
Kaski, K.; Groop, P. H.; Ala-Korpela, M. Mol. Syst.Biol. 2008, 4, 167. (36) Ma¨kinen, V. P.; Soininen, P.; Forsblom, C.; Parkkonen, M.; Ingman, P.;
Kaski, K.; Groop, P. H.; Ala-Korpela, M. MAGMA 2006, 19, 281–296. (37) Lauridsen, M.; Maher, A. D.; Keun, H.; Lindon, J. C.; Nicholson, J. K.;
Nyberg, N. T.; Hansen, S. H.; Cornett, C.; Jaroszewski, J. W. Anal. Chem.
2008, 80, 3365–3371.
(38) Lauridsen, M.; Hansen, S. H.; Jaroszewski, J. W.; Cornett, C. Anal. Chem.
2007, 79, 1181–1186.
(39) Cloarec, O.; Dumas, M. E.; Craig, A.; Barton, R. H.; Trygg, J.; Hudson, J.; Blancher, C.; Gauguier, D.; Lindon, J. C.; Holmes, E.; Nicholson, J. Anal.
Chem.2005, 77, 1282–1289.
(40) Maher, A. D.; Crockford, D.; Toft, H.; Malmodin, D.; Faber, J. H.; McCarthy, M. I.; Barrett, A.; Allen, M.; Walker, M.; Holmes, E.; Lindon, J. C.; Nicholson, J. K. Anal. Chem. 2008, 80, 7354–7362.
(41) Dettmer, K.; Aronov, P. A.; Hammock, B. D. Mass Spectrom. Rev. 2007,
26, 51–78.
(42) Zhou, M.; McDonald, J. F.; Ferna´ndez, F. M. J. Am. Soc. Mass Spectrom.
2010, 21, 68–75.
(43) Wevers, R. S.; Engelke, U.; Heerschap, A. Clin. Chem. 1994, 40, 1245– 1250.
(44) Kamholz, A. E.; Yager, P. Biophys. J. 2001, 80, 155–160. (45) Brody, J. P.; Yager, P. Sens. Actuators, B 1997, 58, 13–18.
(46) Jandik, P.; Weigl, B. H.; Kessler, N.; Cheng, J.; Morris, C. J.; Schulte, T.; Avdalovic, N. J. Chromatogr., A 2002, 954, 33–40.
(47) Weigl, B. H.; Bardell, R. L.; Kesler, N.; Morris, C. J. Fresenius J. Anal. Chem.
2001, 371, 97–105.
(48) Brody, J. P.; Yager, P. Sens. Actuators, A 1997, 58, 13–18.
(49) Mansfield, C. D.; Man, A.; Low-Ying, S.; Shaw, R. A. Appl. Spectrosc. 2005,
59, 10–15.
(50) Mansfield, C. D.; Man, A.; Shaw, R. A. IEE Proc.: Nanobiotechnol. 2006,
153, 74–80.
(51) Shaw, R. A.; Rigatto, C.; Reslerova, M.; Low Ying, S.; Man, A.; Schattka, B.; Battrell, C. F.; Matthewson, J.; Mansfield, C. Analyst 2009, 134, 1224– 1231.
fluid is enriched in low molecular weight species (metabolites) as the sample is depleted of them. The metabolite-rich LFDI “product” is harvested by effectively splitting the emerging stream and collecting only the fluid that emerges above the diffusion barrier Xb. In an “idealized” arrangement, the sample and
receiver might be envisaged as streams separated by an infinitely thin knife edge (at a height Xs) until they enter the
LFDI channel; similarly, the product aspiration channel would be separated from the waste channel by a knife edge coincident with the diffusion barrier (Figure 1A). In practice, the knife edges are virtual ones; Xsand Xpare governed by the flow rates only.
For practical use, the microchannel is embedded within a laminated card that includes liquid channels and air-pressure-actuated valves. The card is interfaced via a manifold to a programmable set of pumps directed by software scripts to control the three flow rates Qs, Qr, and Qpand actuate the pneumatic
valves. The LFDI card that we use for serum separations is of custom design (by Micronics, Redmond, WA), distinguished by the use of large reservoirs to accommodate the large sample volumes that are often beneficial for serum work. The card design and operation have been illustrated and described previously.51
Table 1 summarizes various structural/operating parameters that are specified for any particular LFDI device/trial. In operation, the relative heights of the sample and receiver fluids Xsand Xr
(Figure 1) are determined by their relative flow rates Qsand Qr.
The extent of diffusion is governed by the time the fluids spend in contact with one another, tres, which is dictated by the overall
flow rate Qs + Qr. Finally, the diffusion barrier height is
determined by the aspiration flow rate Qpof fluid into a channel
that draws the product from the LFDI microchannel exit; the lower is the aspiration flow rate, the larger is the diffusion barrier.
In practice, the LFDI channel is connected to the input (sample/receiver) and output (product/waste) streams via the interface depicted as Figure 1B; the sample and receiver channels are separated by a laminate layer ∼127 µm thick, as are the product and waste channels. The present modeling assumes the idealized arrangement (as depicted in Figure 1A); while prelimi-nary simulations suggest that the flow converging-diverging around the dividers may play a role in determining the product composition, the differences are generally subtle, at least in the context of IR spectroscopic measurements.
Model. Given the microchannel geometry, the objective was to develop a computational model that accurately predicts the composition of the LFDI product for any reasonable combination of the three adjustable flow rates Qs, Qr, and Qp. The model
considers two incompressible Newtonian fluids of equal viscosi-ties with a velocity profile that is symmetric along the diffusion
Figure 1. Schematic depiction of the laminar fluid diffusion channel. Upper panel A shows the “idealized” interface; the sample and receiver fluid streams, of height Xsand Xr, respectively, flow in contact while diffusion occurs across the interface. At the channel exit, the concentration
gradients differ for species with low (dark gray shading), intermediate (medium gray), and high (light gray) diffusion constants. Metabolite-rich, protein-depleted product is aspirated from the upper portion of the channel exit, with the precise location of the diffusion barrier Xbdetermined
by the aspiration flow rate. The actual LFDI card (lower panel B) has the sample/receiver and product/waste channels separated by a divider of thickness 127 µm (5 mil); in practice, the sample stream and diffusion barrier heights are governed solely by the (relative) flow rates Qs, Qr,
and Qp. See also Table 1.
Table 1. LFDI Channel Dimensions and Operating Parameters
parameter description parameter description
h ) 330 µm LFDI channel height Qp product aspiration flow rate (µL/sec)
w ) 4.45 mm LFDI channel width Xs height of sample stream (µm) h/w ) 0.074 LFDI channel aspect ratio Xr height of receiver fluid stream (µm)
L ) 22.2 mm LFDI channel length Xp height of aspired product stream (µm)
V ) 32.6 µL LFDI channel volume tres) V/(Qs+ Qr) channel residence time (sec) Qs sample flow rate (µL/s) Xb) h - Xs- Xp diffusion barrier height (µm) Qr receiver fluid flow rate (µL/s)
channel cross-sectional directions x and y (Figure 1). The following considers the two dynamic processes that occur simul-taneously, namely, laminar fluid flow (advection) and molecular diffusion.
Under a pressure gradient -(∆p/L)ez, the Navier-Stokes
equation reduces to Poisson’s equation, describing Poiseuille flow along the channel:
∂2v ∂x2+ ∂2v ∂y2 ) ∆p ηL (1)
where v is the flow velocity, η ) dynamic viscosity of the liquid, and x, y, and L are defined in Figure 1. Equation 1 (with no-slip boundary conditions) may be solved analytically52or numerically
using finite differences or finite elements, with comparable computational expense.
The no-slip condition at the channel walls generates a distribu-tion of flow velocities that is essentially parabolic, as illustrated by a scale representation in Figure 2; the flow rate is maximum at the channel center, with a distribution of flow rates diminishing to zero at the channel walls. This flow profile has important ramifications in determining Xsand Xb; if the profile is expressed
as a function of one variable, “x”, the flow rate per unit width can now be expressed as
Qtot.) w
∫
x)0 h v(x) dx (2) where v(x) )6Qtot. h3w x(h - x) (3) h is the LFDI channel height, w is the channel width, and Qtot.)Qr + Qs. To determine Xs, as a function of Qs, the following
integration is carried out
Qs) w
∫
x)0 Xs
v(x) dx (4)
and the resulting third order polynomial is solved for the physically admissible value of Xs. An analogous relation is used to
determine Xp(given the aspiration flow rate Qp) and hence Xb
()h - Xs- Xp; see Figure 3).
The general form of the advection-diffusion problem can be expressed in Cartesian coordinates as
∂Cn ∂t +
(
vx ∂Cn ∂x + vy ∂Cn ∂y + vz ∂Cn ∂z)
) Dn(
∂2Cn ∂x2 + ∂2Cn ∂y2 + ∂2Cn ∂z2)
(5)where Cnis the concentration and Dnthe diffusion coefficient
for species n, and v ) (vx, vy, vz) is the flow velocity. The
diffusion coefficient describes isotropic diffusion.
The sample and receiver fluids are driven as two parallel laminar flows along the z-direction, under a pressure gradient across the ends. The Reynolds number of the flow is low (typically ∼1 or less) so that laminar flow is maintained. Furthermore, mass transport by advection dominates diffusion along the length of the cell (in our case the z-direction), i.e., vz(∂C/∂z) .
D(∂2C/∂z2). Therefore, we may neglect diffusion along the axis
of flow (z-axis) and consider only diffusion in the x- and
y-directions perpendicular to the flow. Equation 5 thus simplifies
to44 v ∂Cn ∂z ) Dn
(
∂2Cn ∂x2 + ∂2Cn ∂y2)
(6) The first step in the computational procedure for finding the concentration Cn(x,y,z) is to solve for the velocity field v(x,y)(eq 1). Equation 6 may then be solved numerically by integrating along the z-direction from z ) 0 to z ) L (with Neumann boundary conditions; all concentration gradients are zero at the channel walls). With one such eq 6 for each species “n”, the concentration profile for each species is determined independently. In practice, the concentration profiles were determined by using the parabolic solver (two spatial + temporal dimensions) in the Matlab partial differential equation (PDE) toolbox.
As the fluid exits the channel, at z ) L, the product flux rate for species n, qn, may be determined by integrating the flux
density (velocity field multiplied by the concentration profile) over the cross-sectional area of the LFDI channel exit that lies above the diffusion barrier. The limits of integration are determined by flow rates (indirectly; the flow rates dictate the interface and diffusion barrier heights) and the diffusion cell geometry; i.e.,
qn)
∫
0w∫
h-Xp h
vz(x, y) Cn(x, y) dx dy (7)
where Xpis determined as per eq 4 and the discussion following.
The LFDI product concentration predicted for species n is then evaluated as Cn) qn/Qp.
Instrumentation and Protocols for Preliminary Experi-ments. LFDI trials were carried out by using a MicroFlow system from Micronics, with a custom card whose structure and operation have been described previously.51Two procedural details have
been adopted since that study was reported. First, we now discard as waste the first 90 µL (three LFDI channel volumes) that emerge from the LFDI channel, with the rationale that the dynamic flow/ diffusion equilibrium takes some time to establish itself within the channel. The second refinement was to discard the first 60
(52) Mortensen, N. A.; Okkels, F.; Bruus, H. Phys. Rev. E 2005, 71, 057301.
Figure 2. Simulated velocity profile for a fluid flowing through the LFDI channel.
µL of product that was aspirated into the product hold channel. The rationale for this action is that the first bolus of fluid drawn as “product” upon activation of the aspiration pump would not be representative of the genuine LFDI product; the impulse would unsettle the dynamic equilibrium within the LFDI channel.
All experimental trials discussed here made use of pooled urine samples with elevated albumin levels of typically ∼1 g/L. Urine samples are concentrated in creatinine, which permitted us to track the fate of both compounds of interest. The main reason for choosing urine samples rather than serum samples was that the viscosity match is much closer for urine/water than for serum/ water.
The efficiencies of all separation trials were gauged by comparing the LFDI product creatinine and albumin levels to those for the original sample. All creatinine and albumin analyses were carried out using standard clinical chemistry assays as implemented on Roche/Hitachi Cobas Modular analyzers in the Clinical Biochemistry Laboratory, St. Boniface General Hospital (Winnipeg, MB, Canada). Creatinine assays made use of an enzymatic method developed by Roche.53The urine microalbumin
method is an immunoturbidimetric assay.54
Simulation Outputs: Diffusion Profiles. Albumin and crea-tinine concentration profiles predicted for one pair of flow rates
Qsand Qrare illustrated in Figures 3 and 4. Figure 3 provides
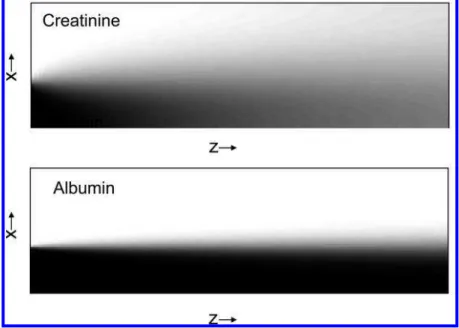
an intuitively clear impression of how effective the device can be in separating slow (albumin) from rapid (creatinine) diffusers. Quantitative concentration profiles are provided by Figure 4, which shows the creatinine and albumin distributions at each of six distances along the LFDI channel. At z ) 0, where the sample and receiver streams first make contact, the profile is a step function for both compounds. As the two streams meet and flow in contact with one another, creatinine diffuses across the interface
more rapidly than does albumin. By aspirating only the LFDI output stream within the cross-section above the diffusion barrier, it is possible in principle to obtain a product with substantial metabolite (creatinine) concentration that is virtually depleted of protein (albumin).
Simulation Outputs: Application to Biofluid Precondition-ing for IR Spectroscopy. The first application of the simulation software was to determine flow rates that yield a product that is suitable for diagnostic/analytical IR spectroscopic metabolic fingerprinting measurements. To that end, we have carried out a series of simulations (and experiments) to explore the effect of
(53) Erhardt, V.; Voght, B. W. Manuscript in preparation.
(54) Multicenter study of Tina-quant albumin in urine and β-N-acetylglucosamini-dase (β-NAG) in urine. Workshop Munich, Nov. 29-30, 1990. Wien. Klin.
Wochenschr.1991, 103 (Suppl. 189), 1-64.
Figure 3. Concentration profiles calculated for creatinine and albumin within the LFDI channel clearly suggest the possibility of harvesting a metabolite-rich, albumin-depleted sample via aspiration of product from the upper third of the channel exit. Simulation flow rates were Qs) 0.83
µL/s and Qr) 2.03 µL/s.
Figure 4. Concentration profiles calculated for creatinine and albumin as a function of distance “z” along the LFDI channel. Both profiles are step functions at the channel entrance (z ) 0) and evolve as the sample and receiver fluids flow in parallel. For each compound, the six profiles correspond to normalized values z ) 0, 0.2, 0.4, 0.6, 0.8, and 1.0. Simulation flow rates were Qs) 0.83 µL/s, Qr) 2.03
µL/s, and Qp) 0.83 µL/s; at these flow rates, Xp) Xs) 118 µm,
and Xb) 94 µm.
manipulating (i) Xb(with constant Xs) and (ii) Xs(with constant
Qp).
RESULTS
Predicted Product Stream Composition. The first set of trials encompassed four sets of flow rates. The first set of flow rates had been adopted for our earlier exploratory studies and was derived using a naı¨ve model assuming plug flow.51The other
three trials were characterized by successive increases in Xb,
accomplished by decreasing Qp while leaving Qs and Qr
unchanged. These simulations, summarized within Table 2, predicted that the product creatinine level should remain quite stable while the albumin level is reduced, i.e., a substantial improvement in the creatinine/albumin ratio with increasing diffusion barrier height.
The second set of trials comprised seven sets of flow rates, varying the height of the sample stream Xswhile keeping both
the overall flow rate (Qs+ Qr) and the product aspiration rate
(and hence Xp) constant. Successive reductions in Qs (and
concurrent increases in Qr) had the effect of decreasing Xsand
thus increasing the diffusion barrier height. These simulations, summarized within Table 3, predict that the creatinine/albumin ratio should increase substantially with decreasing Xs.
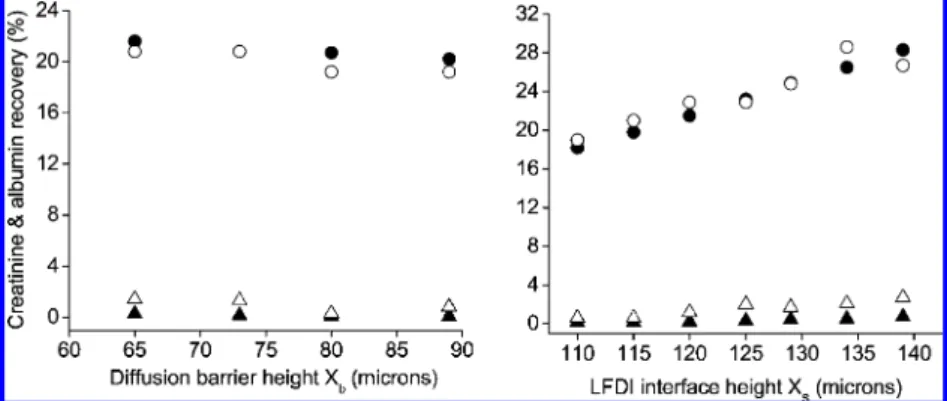
Experimental vs Predicted Composition. Experimental data for both sets of LFDI trials are included within Tables 2 and 3. The experimental product compositions (creatinine and albumin
levels) are compared to the simulation predictions in Figure 5. Immediately apparent is the very good qualitative agreement between experimental and simulated results. Simulations clearly capture the significant experimental trends: (i) a gradual decrease in creatinine levels with increasing diffusion barrier height (or, equivalently, a decrease in Xs), (ii) a more rapid decrease in
albumin concentration, and (iii) the resultant exponential increase in creatinine/albumin ratio with diffusion barrier height (Figure 6).
The observed creatinine concentrations were generally in very good quantitative agreement with predicted values. In the case of albumin, while the experimental data closely follow the trends predicted by the simulated data, closer examination reveals quantitative discrepancies (see Tables 2 and 3); the LFDI products contain somewhat more albumin than the simulations predict they should.
DISCUSSION
This work provides the basis to simulate liquid flow and diffusion in LFDI channels and hence to determine combinations of flow rates suitable for effective LFDI (bio)fluid preprocessing. Our specific aim was fulfilled, in that we have discovered flow rates that provide 40- to 60-fold enhancements in the metabolite/ protein (creatinine/albumin) ratio of the LFDI product as com-pared to the original sample. These enhancement levels are completely adequate for the useful integration of LFDI prepro-cessing with infrared spectroscopy.
The simulations suggest that enhancements in creatinine/ albumin ratio (KCr) of greater than 100-fold may be achievable,
with the ratio increasing exponentially with Xb. While we have
not achieved these targets experimentally, there is good qualitative agreement between the experimental and predicted trends in KCr(see Figure 6), and the optimal experimental results
(KCr) 40-60) are completely adequate for the IR spectroscopy
application of primary interest here (this is the case because serum metabolites collectively amount to a concentration of typically ∼2 g/L, as compared to a protein concentration of typically ∼70 g/L; a LFDI preconditioning step with 35-fold enhancement in metabolite/protein ratio is therefore adequate to bring the metabolite absorptions collectively into the same intensity range as the protein absorptions). While there is some metabolite dilution in an absolute sense, this is more than compensated for by drying the LFDI product to a film (or even
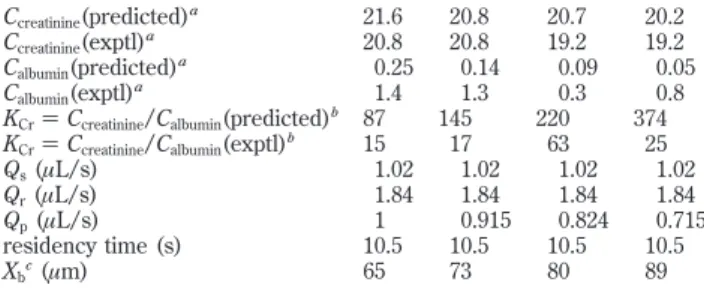
Table 2. Summary of Four LFDI Trials Varying the Aspiration Rate Qp
Ccreatinine(predicted)a 21.6 20.8 20.7 20.2
Ccreatinine(exptl)a 20.8 20.8 19.2 19.2
Calbumin(predicted)a 0.25 0.14 0.09 0.05
Calbumin(exptl)a 1.4 1.3 0.3 0.8
KCr) Ccreatinine/Calbumin(predicted)b 87 145 220 374
KCr) Ccreatinine/Calbumin(exptl)b 15 17 63 25
Qs(µL/s) 1.02 1.02 1.02 1.02
Qr(µL/s) 1.84 1.84 1.84 1.84
Qp(µL/s) 1 0.915 0.824 0.715
residency time (s) 10.5 10.5 10.5 10.5
Xbc(µm) 65 73 80 89
aAs a percentage of the concentration for the original sample.bThe
enhancement factor KCrgauges the relative enrichment in creatinine
relative to albumin in the LFDI product, as compared to the original sample.cXs
) 133 µm, Xr) 197 µm, and residency time (10.5 s) are
the same for all trials. The diffusion barrier height (Xb) varies solely
as a consequence of variations in the product aspiration rate Qs.
Table 3. Summary of Seven LFDI Trials Varying the Height of the Sample Stream Xsthrough Successive Decreases
in the Ratio of Sample to Receiver Flow Rates Qs/Qr, While Maintaining a Constant Overall Flow Rate (Qs+ Qr) Ccreatinine(predicted)a 28.3 26.5 24.9 23.2 21.5 19.8 18.2
Ccreatinine(exptl)a 26.7 28.6 24.8 22.9 22.9 21.0 19.0
Calbumin(predicted)a 0.71 0.50 0.41 0.29 0.20 0.14 0.10
Calbumin(exptl)a 2.7 2.1 1.7 2.0 1.2 0.6 0.6
KCr) Ccreatinine/Calbumin(predicted)b 40 53 61 80 108 141 182 KCr) Ccreatinine/Calbumin(exptl)b 10 14 14 11 19 37 34
Qs(µL/s) 0.80 0.76 0.72 0.67 0.63 0.59 0.55 Qr(µL/s) 1.30 1.34 1.38 1.43 1.47 1.51 1.55 Qp(µL/s) 0.70 0.70 0.70 0.70 0.70 0.70 0.70 residency time (s) 14.3 14.3 14.3 14.3 14.3 14.3 14.3 Xs(µm) 139 134 129 125 120 115 110 Xr(µm) 191 196 201 205 210 215 220 Xb(µm) 64 68 73 78 82 87 92
aAs a percentage of the concentration for the original sample.b
The enhancement factor KCrgauges the relative enrichment in creatinine
relative to albumin in the LFDI product, as compared to the original sample.
stacking successive aliquots), with the added advantage that the otherwise overwhelming water absorptions are entirely eliminated.
While the present experiments do not achieve the very large enhancements in metabolite/protein ratio that the simulations suggest to be achievable in principle, the residual discrepancies may originate with experimental challenges rather than deficien-cies of the model. In particular, we are beginning to assess the practical limitations imposed by the (in)stability of the sample/ receiver fluid interface. Extremely smooth pump dispense rates are desirable, since fluctuations of a few micrometers in the interface and/or diffusion barrier height can be very significants particularly in contributing to possible “leakage” of the waste stream (high protein) over the diffusion barrier. It is extraordinar-ily difficult experimentally to eliminate all sources of pulsatile flow components, and we suspect residual fluctuations (in very good pumps) to be the dominant factor contributing to variability in the (low) product albumin levels. Although further performance enhancements are simply not required for IR spectroscopic applications, they may prove very beneficial to other metabolomic techniques, in particular for integration with mass spectrometry characterization of the “metabolic fingerprint”. To that end, we continue to explore avenues to improve the experimental perfor-mance of the LFDI system.
In tandem with possible fine-tuning of the experimental approach, refinements of the modeling protocol are planned. One such refinement will involve developing the capacity to more accurately model the flow of sample, receiver, and product streams at the actual LFDI channel entrance and exit (as opposed to their
“idealized” counterparts; see Figure 3). In particular, we will explicitly account for the 127 µm divider around which the sample and receiver streams merge. Particular emphases will be on the question of whether the sample/receiver interface and/or diffusion barrier height is/are offset relative to their heights predicted on the basis of the idealized LFDI/exit channel interface (Figure 1), and on the possibility of turbulent flow around the blunt divider. Exploratory simulations have highlighted the need to carefully consider the question of where the sample/receiver boundary lies at the LFDI exit; if the boundary were misplaced, the simulated product protein (albumin) concentration distribution would be correspondingly displaced.
In addition, we will incorporate the influence of sample viscosity. The influence is not likely to be important for the particular simulation/experimental comparisons presented here, since the viscosity of urine is very similar to that of water. Preliminary work has shown that the velocity profile is affected and that the sample/receiver interface Xsis shifted relative to
the interface for fluids with matched viscosities at the same flow rates.
CONCLUDING REMARKS
The LFDI technique has the potential for very broad application in preconditioning liquid samples for subsequent analytical manipulations (e.g., chromatography) and/or spectroscopic char-acterization. The progress reported here forms the basis for optimal integration with IR spectroscopic characterization of serum metabolitess“metabolic fingerprinting”sand further points the way to further optimizations that would be beneficial for
integra-Figure 5. LFDI product albumin (2 ) simulation, 4) experimental) and creatinine (b ) simulation, O ) experimental) concentrations for two sets of flow rates “A” (left panel; the flow rates and derived parameters for these four trials are summarized in Table 2) and “B” (right panel; the flow rates and derived parameters for these seven trials are summarized in Table 3).
Figure 6. Comparison of simulated to experimental creatinine/albumin enhancement factors for seven LFDI trials. The flow rates and derived parameters for these trials are summarized in Table 3.
tion with mass spectrometry. The next steps in our ongoing research will be focused on resolving the residual quantitative discrepancies between simulated and experimental data and thus to open the door to optimal use of the LFDI technique in a broader range of metabolomic and proteomic sample preprocessing applications.
Finally, a very significant attraction of LFDI sample prepro-cessing is that the technique may in principle be physically integrated with the IR spectroscopic sensor within a single platform. This possibility constitutes a decisive advantage for LFDI preconditioning over ultrafiltration (which requires a centrifuge and attendant sample handling) and opens the door to adoption of the integrated platform in environments requiring rapid sample turnaround and minimal sample handling, e.g., in clinical settings ranging from specialty clinics to the emergency room.
ACKNOWLEDGMENT
This work would not have been completed were it not for the interest and key insights contributed by Paul Yager and Bruce Finlayson at the University of Washington. We also thank Kris Ryan and her staff for their unfailing enthusiasm and rapid turnaround of every critical sample that we submitted for analysis at the research bench, Clinical Biochemistry Lab, St. Boniface General Hospital. We gratefully acknowledge funding support from the National Research Council Genomics and Health Initiative, the Canadian Institutes of Health Research, and the Manitoba Health Research Council.
Received for review September 2, 2010. Accepted November 29, 2010.
AC102338N