Publisher’s version / Version de l'éditeur:
Vous avez des questions? Nous pouvons vous aider. Pour communiquer directement avec un auteur, consultez la
première page de la revue dans laquelle son article a été publié afin de trouver ses coordonnées. Si vous n’arrivez pas à les repérer, communiquez avec nous à PublicationsArchive-ArchivesPublications@nrc-cnrc.gc.ca.
Questions? Contact the NRC Publications Archive team at
PublicationsArchive-ArchivesPublications@nrc-cnrc.gc.ca. If you wish to email the authors directly, please see the first page of the publication for their contact information.
https://publications-cnrc.canada.ca/fra/droits
L’accès à ce site Web et l’utilisation de son contenu sont assujettis aux conditions présentées dans le site LISEZ CES CONDITIONS ATTENTIVEMENT AVANT D’UTILISER CE SITE WEB.
ICOE 2014 - International Conference on Ocean Energy, 2014-11
READ THESE TERMS AND CONDITIONS CAREFULLY BEFORE USING THIS WEBSITE.
https://nrc-publications.canada.ca/eng/copyright
NRC Publications Archive Record / Notice des Archives des publications du CNRC :
https://nrc-publications.canada.ca/eng/view/object/?id=291c014d-e71c-4556-bb20-77f63f9ca704
https://publications-cnrc.canada.ca/fra/voir/objet/?id=291c014d-e71c-4556-bb20-77f63f9ca704
Archives des publications du CNRC
This publication could be one of several versions: author’s original, accepted manuscript or the publisher’s version. / La version de cette publication peut être l’une des suivantes : la version prépublication de l’auteur, la version acceptée du manuscrit ou la version de l’éditeur.
For the publisher’s version, please access the DOI link below./ Pour consulter la version de l’éditeur, utilisez le lien DOI ci-dessous.
https://doi.org/10.13140/2.1.2945.2483
Access and use of this website and the material on it are subject to the Terms and Conditions set forth at
Wave and meteorological site characterization for the Wave Energy
Research Centre in Lord’s Cove Newfoundland and Labrador, Canada
Wave and meteorological site characterization for
the Wave Energy Research Centre in Lord’s Cove,
Newfoundland and Labrador, Canada
Michael Graham
College of the North Atlantic
Burin, NL
mike.graham@cna.nl.ca
Renee Boileau
National Research Council of Canada
St. John’s, NL
renee.boileau@nrc.gc.ca
Abstract
This paper describes the wave and me-teorological environment at the newly cre-ated Wave Energy Research Centre in Lord’s Cove NL (46◦52’43”N 55◦40’10”W). The
data were obtained from near-shore surface and sub-surface wave measurement devices and a shore-based meteorological station col-lected over a two year period. Water depth at the measurement site was 25 m. The high-est waves (˜10 m) were recorded in fall storms and late summer hurricanes, with late spring and early summer having the calmest wa-ter (significant waves typically between 0.5 and 1.5 m). Winter weather was consider-ably more energetic, with significant wave heights in the 3 to 6 m range. Sustained win-ter winds were frequently above 60 km/hr, with storm gusts up to 100 km/hr not un-common. As might be expected from typical storm tracks in the region and the site’s ex-posure, the highest winds and largest waves were from the southwest. Although hind-cast models predict an offshore wave power density in the region of 20 to 25 kW/m, the average power density we detected (within 1 km of shore) was 10.7 kW/m, with peak power of 278 kW/m. It is concluded that the site is sufficiently energetic to assess full scale wave energy device performance and to provide extreme challenges to structural and mooring system design.
keywords: wave-powered pump, wave energy
1
Introduction
Powerful waves beat upon the coast of Newfound-land (Canada). This unprotected coastline is a ma-jor challenge to developing aquaculture in many communities. To demonstrate the viability of shore-based aquaculture in rural Newfoundland, College of the North Atlantic (CNA) launched a research effort to develop a pilot Integrated Multi-Trophic Aquaculture (IMTA) farm[1] combined with a wave energy test centre in Lord’s Cove on the Burin Peninsula in the fall of 2011. The objec-tive is to use wave energy to pump seawater ashore for the aquaculture farm.
CNA is collaborating with National Research Council Canada (NRC) in the first project at the centre to design a wave pump.
The preliminary stage in designing a device for the Lord’s Cove site is to characterize the available wave resource and meteorological environment, which necessitated the installation of weather and wave monitoring equipment.
The CNA Wave Energy Research Centre is now operational.
1.1
The
Wave
Energy
Research
Centre
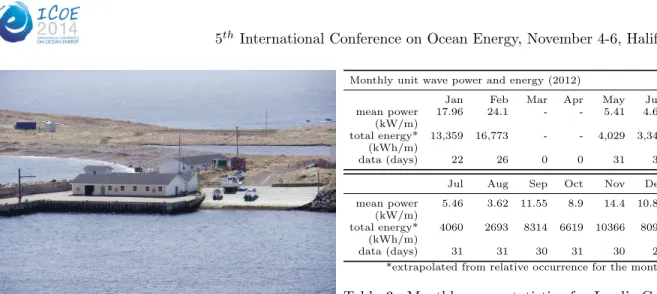
The Wave Energy Research Centre (WERC) occu-pies four buildings on the wharf in Lord’s Cove, NL (4652’43”N 5540’10”W). The site currently has six mooring sites within 1.5 km1 of the station that
are permitted under the Canadian Navigable Wa-ters Protection Act (Figure 1). In addition to a weather station, wave data collection and device
mooring sites, WERC also houses the pilot aqua-culture farm, a lab and workshop space. The site is equipped with an emergency backup power supply sufficient to run the farm, data acquisition equip-ment and high speed data connections for off-site monitoring and control of equipment.
The wharf has paved road access and is within 100 km of major offshore construction facilities (Kiewit Offshore Services in Marystown) and the fabrication facilities and labs (including chemical, biological, materials evaluation and electronics) at the Burin campus of College of the North Atlantic. Lord’s Cove harbour can accommodate vessels up to about 15 m; larger vessels can be accommo-dated in nearby ports in St. Lawrence, Grand Bank and Marystown, as well as the French territory of St. Pierre and Miquelon. There is also a commer-cial 27 MW wind farm near St. Lawrence (30 km from Lord’s Cove), indicating good potential for the study of wind-wave hybrid technologies.
This paper describes and assesses the physical environment of Lord’s Cove, Canada, including wave and meteorological characteristics based on data beginning in 2012.
Figure 1: Licensed wave energy mooring sites at Lord’s Cove, Canada
2
Method
The local environment at Lord’s Cove needed to be characterized to provide real world inputs for the design of the wave-powered pump and to make the site useful for other wave energy
develop-ers. Site characterization began with refining local bathymetry and conducting a short term (less than one year) survey of wave conditions at a proposed mooring site using a moored wave buoy.
Since then, a permanent meteorological station has been installed at Lord’s Cove and a wave and current profiler has been deployed to collect contin-uous weather and wave data. Three years of data has been analyzed to date.
2.1
Initial site characterization
An Axys Technologies Inc. Triaxys directional wave buoy was deployed by NRC in 2012 for char-acterization of the mooring site at 46.86N latitude, 55.667W longitude, a point approximately one kilo-metre outside of Lord’s Cove near mooring site #3 (see Figure 1). This location was selected for prox-imity to the on-shore aquaculture facility and for good exposure to ocean sea states with minimal in-terference from local bathymetry. The buoy was moored in 30 metres of water on a mooring with a 100-metre swing radius; soundings indicated that the sea bottom there is flat.
The buoy instruments measure heave and direc-tion and internal device temperature, and wave height and period are extracted from the spectra. The buoy collected data for a total of 10 months in 2012.
Analysis of the wave data at Lord’s Cove relies on assumptions that the waves are statistically con-stant within the swing of the mooring for each sam-ple period (i.e., the sea surface behaves as a station-ary, ergodic, Gaussian random process).
The data were analysed by season and presented as a range of numeric tables and graphs, as rec-ommended by [2]: wave scatter diagrams (Table 1) to show how common sea states are; probability densities for wave heights and periods (Figure 2a); wave direction roses (Figure 2b); power exceedance curves (Figure 5), from which wave energy con-verter input can be predicted; and wave energy dis-tribution (Table 2) to highlight sea states with the most consistent energy at Lord’s Cove.
Complete analysis is presented in [3].
2.2
Meteorological station
In March 2012, CNA installed a meteorological station to monitor local weather near the public 2
Wave scatter diagram (%) - Winter 2012 Te (s) 0 - 3 3 - 6 6 - 9 9 - 12 12 - 15 >15 sum Hmo (m) >7 6 - 7 0.1 0.1 5 - 6 0.5 0.6 4 - 5 0.7 1.3 0.5 2.6 3 - 4 0.1 4.7 6.3 0.5 11.7 2 - 3 1.9 11 10.2 0.5 23.5 1 - 2 6.4 25 10.1 0.9 42.4 0 - 1 2.2 9.7 5.1 2 19.0 sum 10.6 51.1 33.6 4.4 100.0 2226 samples (48 days)
Table 1: Sample wave scatter diagram for Lord’s Cove
(a) wave height (b) wave direction
Figure 2: Sample wave height probability density and direction rose for Lord’s Cove
wharf in the town of Lord’s Cove, NL, Canada (4652’43.20”N 5540’10.32”W). The 10-m tower was erected 2 m from the finfish production building, approximately 7 m above sea level and 40 m from the high tide line (Figure 4). Due to local terrain, it was impossible to find a site with ideal fetch for wind measurements. Although there is excellent fetch for the site in the southern half of the com-pass (at least 200 m over water), there are nearby terrain features and structures approximately 60 m to the north. For this reason wind measured from the northern quadrants may be site-specific and should be interpreted with caution. The anemome-ter placement corresponds to recommendations by Oke[4] for urban districts with scattered tall build-ings, even if the area is decidedly not urban.
The station instrumentation includes an RM Young marine anemometer (model 05106C-10) mounted at a height of 10 m, a Kipp & Zonen sil-icon pyranometer (model SP Lite2) mounted on a horizontal arm 1 m south from the tower center at a
Figure 3: Sample power exceedance for Lord’s Cove
Wave energy distribution (%) - Winter 2012
Te (s) 0 - 3 3 - 6 6 - 9 9 - 12 12 - 15 >15 sum Hmo (m) >8 7 - 8 0.4 0.4 6 - 7 1 1.0 5 - 6 0.2 4.3 0.5 5.0 4 - 5 2.4 7.4 3.7 13.5 3 - 4 0.2 9.5 20.1 2.2 32.0 2 - 3 1.1 11.3 16.6 1 30.0 1 - 2 1.4 9.3 5.9 0.7 17.3 0 - 1 0.1 0.4 0.3 0.3 1.1 sum 2.8 33.5 55.6 8.4 100.0 2227 samples (48 days)
Table 2: Sample wave energy distribution for Lord’s Cove
height of 4 m, a ”Hydroclip” RH/T sensor (Model HC2-S3-L) mounted on the tower in a 10-plate radi-ation shield (Campbell Scientific 41003-X) also at a height of 3 m, and a Texas Electronics TE525M tip-ping bucket rain gauge (0.1 mm per tip) mounted at 3.5 m on a separate support 3 m SW of the tower. (The rain gauge is only operational during the frost-free season.)
Data is collected by a Campbell Scientific CR10X logger sampling every three seconds and analysed over 10-minute and 24-hour (midnight to midnight) periods.
All meteorological data is collected and archived locally. Summaries of the wind data will be pre-sented in Section 3.2.
2.3
Wave monitoring
In May 2013, CNA deployed a Nortek Acoustic Wave Acoustic Current (AWAC) device on the seafloor approximately 1.5 km south of the wharf
Figure 4: Wave Energy Research Centre with Me-teorological tower placement in Lord’s Cove, NL (from east)
in 25 m depth. Since then, wave data is being col-lected continuously except for maintenance periods. This device alternates between two modes: cur-rent data acquisition and wave data acquisition. In current mode, it collects three-dimensional wa-ter velocity profile data every 10 minutes. Once an hour, the system switches to wave mode and performs a 17-minute wave data acquisition cy-cle to gather wave statistics including significant and mean heights, period, and height and direction spectra, in addition to collecting raw data.
The system is cabled to shore and real-time wave and current data are available online. In the event of cable malfunction, the data is also stored on board the unit and can be recovered when it is brought to shore for service.
3
Results
So far, three years of data have been collected at Lord’s Cove. Analysis of NRC data for the ini-tial characterization (2012 data) is being used to drive the wave pump prototype design. This pre-sentation of wave data for Lord’s Cove follows rec-ommended guidelines [2], and previous work on a national wave atlas [5], so that these data may be compared with other sites and used as a baseline for designing a device to use this resource.
Monthly unit wave power and energy (2012)
Jan Feb Mar Apr May Jun mean power 17.96 24.1 - - 5.41 4.65
(kW/m)
total energy* 13,359 16,773 - - 4,029 3,347 (kWh/m)
data (days) 22 26 0 0 31 30 Jul Aug Sep Oct Nov Dec mean power 5.46 3.62 11.55 8.9 14.4 10.88
(kW/m)
total energy* 4060 2693 8314 6619 10366 8097 (kWh/m)
data (days) 31 31 30 31 30 24 *extrapolated from relative occurrence for the month
Table 3: Monthly wave statistics for Lord’s Cove (per unit wave crest)
Figure 5: Monthly power per unit wave crest for Lord’s Cove
3.1
Site assessment for wave energy
The wave resource at Lord’s Cove has been roughly characterized using statistics based on only 10 months of data collected in 2012. Since waves are strongly weather-dependent and thus chaotic, these results are only representative of this data set and what may occur given the same set of weather and tides, not for forecasting future con-ditions. These results only include omnidirectional power, which is typically used as a base measure for a wave resource.
For the purposes of the wave pump, design for continuous minimum flow requires data reflecting the most common wave conditions as well as ex-treme conditions for ensuring survivability of the pump and its mooring.
The average unit wave power and total unit wave energy extrapolated from relative occurrence for each month are summarized in Table 3 with the size of the data sample; power is also displayed in Figure 5.
Site characterization continues with the CNA wave direction and current profiler deployed at a 4
Figure 6: Record of maximum winds recorded at Lord’s Cove in 10-minute periods between March 3 and Dec. 21, 2012
25 m depth 1.5 km from shore, with the exception of periods where the device is removed for service. To date, we have collected wave data from the var-ious deployed sensors for 25 of the last 32 months (78% coverage).
3.2
Local wind field assessment
The following charts are based on wind data ob-tained between March 3 and December 22, 2012. (See Figure 6.)
During this measurement period there were 41 days where gale force (above 62 km/h) winds were recorded. The maximum wind recorded was 92.9 km/hr. Of the 41 gale days, 14 were between March and June, and 22 between September and December; only 5 were recorded in the summer (June 22 – September 21).
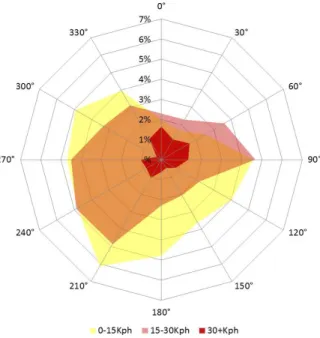
The directionality of the wind field corresponds to typical weather patterns at the site (Figure 7). Lighter winds tend to be thermal in nature (e.g., land and sea breezes), and have a high probability from any direction. Since storms most often ap-proach Lord’s Cove from the southwest and track south and east of the site, the strongest winds (as-sociated with fast-moving winter storms and hur-ricanes) tend to begin from the southeast, backing through north to southwest as the system moves by. More moderate frontal systems are both more com-mon and produce more sustained periods of south-west winds. Given the southern exposure of the site, it is not surprising that ocean waves in Lord’s Cove also most frequently come from this direction.
Figure 7: Directionality of winds as percentage of all observations (2012)
3.3
Comparison to other sites
Some recommended good practice is to consider regional limitations and environmental constraints before evaluating a site’s wave resource.[6] Of high priority to gaining initial site approvals and long-term support is community engagement: the CNA-Lord’s Cove partnership is a good model for re-purposing existing, defunct infrastructure, such as retired fish plants, in rural communities seeking to attract industry and new sources of employment. The availability of multiple mooring sites, labs, ma-chine shops and port access make this a viable site for future projects.
Concurrent with gaining site licenses, the wave resource for Lord’s Cove has been estimated for 2012 using the method described by Cornett in the Inventory of Canada’s marine renewable en-ergy resources[5]. The annual mean power ob-served is 10.7 kW/m; total energy extrapolated from 10 months of field data is estimated to be around 77 MWh/m, with large seasonal variation (fall/winter waves are three times as powerful as in summer). These conditions are typical of Canadian Atlantic near-shore estimates based on the model used by Cornett, but not as energetic as some near shore locations off the west coast of Vancouver Is-land. This modest resource may yet be of interest
to developers with devices to be installed in arrays or for devices scaled for smaller rural communities. The seasonal nature for wave generation can be an advantage to developers who need calm periods to initially test or perform maintenance on a device, while offering three-fold higher wave power through fall and winter.
4
Prognosis
The Wave Energy Research Centre continues to evolve toward becoming a platform for assessment of wave energy converters and other moored de-vices.
4.1
Ongoing measurements
CNA continues to monitor the wave and weather environment in and around Lord’s Cove. CNA publishes data from its weather station to the WERC website (werc.servehttp.com). Real-time data from the AWAC is also published to the site when available. Photos and data for high energy weather events are posted on the WERC facebook page (https://www.facebook.com/WERCCNA). NRC has scripts for analyzing data to produce these standard plots.
4.2
Wave Energy Research Centre
future intentions
While Canada does have laboratory-based wave tanks at NRC facilities in Ottawa and St. John’s and some universities, the Lord’s Cove facility is the only fully-equipped, permanent salt water site that is accessible to academic researchers and industry for wave energy device testing and pilot projects in natural wave environments.
4.3
Wave pump prototype
deploy-ment
A full-scale, wave-powered pump is under construc-tion at the CNA Burin campus. CNA plans to de-ploy its first prototype ocean wave-powered pump at Lord’s Cove in spring/summer 2015.
Acknowledgement
This research was funded by the Natural Sciences and Engineering Research Council of Canada, the Research and Development Corporation of New-foundland and Labrador, and the Department of Industry, Business and Rural Development of New-foundland and Labrador.
The authors would also like to thank the people of Lord’s Cove, Newfoundland, without whom this research would not have been possible.
References
[1] L. Fiander, M. Graham, H. Murray, and R. Boileau, “Land based multi-trophic aqua-culture research at the Wave Energy Research Centre,” in OCEANS14 MTS/IEEE. St. John’s: IEEE, 2014.
[2] J. Saulnier and M. T. Pontes, “Guidelines for wave energy resource assessment and standard wave climate,” in Institution of Civil Engi-neers Coasts, Marine Structures & Breakwa-ters, Sept. 2009.
[3] R. Boileau, “Wave resource assessment for Lord’s Cove, Newfoundland 2012 survey,” Na-tional Research Council of Canada, St. John’s, Technical Report OCRE-TR-2013-008, Jan. 2013.
[4] T. Oke, Instruments and Observing Methods Report No. 81, Initial guidance to obtain repre-sentative meteorological observations at urban sites, World Meteorological Organization Std. WMO TD-No. 1250, 2006.
[5] A. Cornett, “Inventory of Canada’s marine re-newable energy resources,” National Research Council of Canada, Tech. Rep. CHC-TR-041, April 2006.
[6] L. Zubiate, J. Villate, Y. Torre-Enciso, H. So-erensen, B. Holmes, M. Panagiotopoulos, F. Neumann, N. Rousseau, and D. Langston, “Methodology for site selection for wave energy projects,” in 8th European Wave and Tidal En-ergy Conference, Uppsala, Sweden, 2009.
6
View publication stats View publication stats