HAL Id: cea-02305417
https://hal-cea.archives-ouvertes.fr/cea-02305417
Submitted on 4 Oct 2019
HAL is a multi-disciplinary open access
archive for the deposit and dissemination of
sci-entific research documents, whether they are
pub-lished or not. The documents may come from
teaching and research institutions in France or
abroad, or from public or private research centers.
L’archive ouverte pluridisciplinaire HAL, est
destinée au dépôt et à la diffusion de documents
scientifiques de niveau recherche, publiés ou non,
émanant des établissements d’enseignement et de
recherche français ou étrangers, des laboratoires
publics ou privés.
Distributed under a Creative Commons Attribution| 4.0 International License
Comparison of CATHARE results with the experimental
results of cold leg intermediate break LOCA obtained
during ROSA-2/LSTF test 7
Piotr Mazgaj, Jean-Luc Vacher, Sofia Carnevali
To cite this version:
Piotr Mazgaj, Jean-Luc Vacher, Sofia Carnevali. Comparison of CATHARE results with the
exper-imental results of cold leg intermediate break LOCA obtained during ROSA-2/LSTF test 7. EPJ
N - Nuclear Sciences & Technologies, EDP Sciences, 2016, 2, pp.1. �10.1051/epjn/e2015-50020-7�.
�cea-02305417�
R
EGULARA
RTICLEComparison of CATHARE results with the experimental results
of cold leg intermediate break LOCA obtained during ROSA-2/
LSTF test 7
Piotr Mazgaj1,2*, Jean-Luc Vacher1, and Sofia Carnevali3 1
EDF, SEPTEN, 12-14 avenue Dutriévoz, 69628 Villeurbanne, France
2
Institute of Heat Engineering, Warsaw University of Technology, 21/25 Nowowiejska, 00-665 Warsaw, Poland
3 CEA-Saclay, DEN, DM2S/STMF, 91191 Gif-sur-Yvette, France
Received: 5 May 2015 / Received infinal form: 15 November 2015 / Accepted: 24 November 2015 Published online: 11 January 2016
Abstract. Thermal-hydraulic analysis is a key part in support of regulatory work and nuclear power plant design and operation. In thefield of Loss Of Coolant Accident, evolutions of the regulations are discussed in various countries taking into account the very unlikely character of a double-ended guillotine break and questioning the necessity to study such an event with Design Basis Conditions assumptions. As a consequence, the consideration of intermediate size piping rupture becomes more and more important. The paper presents the modeling of the Test Facility ROSA-2/LSTF in the calculation code CATHARE 2.V2.5. OECD/NEA ROSA-2 Project Test 7 was conducted with the Large Scale Test Facility on June 14, 2012. The experiment simulated the thermal-hydraulic responses during a PWR 13% cold leg Intermediate Break Loss Of Coolant Accident (IBLOCA). The break was simulated by a cold leg upwardly mounted long break nozzle. The facility and the experiment conditions are modeled in CATHARE. The vessel is modeled by using a 3D module. A thermal-hydraulic analysis is conducted and the obtained results are subsequently compared with the experimental results from ROSA-2/ LSTF Test 7. Evaluation of the differences between experimental and calculated results is discussed.
1 Introduction
The OECD/NEA ROSA-2 Project aimed to investigate key PWR thermal-hydraulics issues. It consisted in various experiments at ROSA/LSTF facility [1] operated by the Japan Atomic Energy Agency (JAEA). Among these experiments, three were devoted to the Intermediate Break Loss Of Coolant Accident (IBLOCA). The goal of the OECD/NEA ROSA-2 Project Test 7 [2] was to simulate the thermal-hydraulic responses during a PWR 13% cold leg intermediate break loss of coolant accident. The double-ended guillotine break (DEGB) of the Emergency Core Cooling Systems (ECCS) nozzle was simulated by using a 36.0 mm inner-diameter nozzle which was upwardly mounted on the cold leg.
The paper shows the comparison of the experimental results with the calculation results obtained from CATHARE 2.V2.5 [3].
2 Historical LOCA modeling approaches
In thefield of LOCA Studies, the modelization choices may differ according to the break size and the involved physical phenomena, especially with respect to the vessel down-comer nodalization.
2.1 For large break LOCA (LBLOCA)
3D effects in the vessel downcomer during the blowdown stage of the accident are well known and have been widely investigated. It is usually recommended to use a 3D
* e-mail:piotr.mazgaj@itc.pw.edu.pl
© P. Mazgaj et al., published byEDP Sciences, 2016
DOI:10.1051/epjn/e2015-50020-7 & Technologies
Available online at:
http://www.epj-n.org
This is an Open Access article distributed under the terms of the Creative Commons Attribution License (http://creativecommons.org/licenses/by/4.0), which permits unrestricted use, distribution, and reproduction in any medium, provided the original work is properly cited.
nodalization to represent the counter-currentflow between the ascending steam exiting the core and the descending ECCSflow, although a 1D nodalization is considered to be conservative.
2.2 For small break LOCA (SBLOCA)
The dynamics of the accident is slow and the Peak Cladding Temperature is usually obtained before or at the very beginning of the ECCS accumulators injection. In such situations, 3D phenomena in the vessel downcomer have a very low influence, and a 1D nodalization of the downcomer is relevant.
2.3 For intermediate break LOCA (IBLOCA)
The dynamics of the accident is intermediate. The Reactor Coolant System (RCS) minimum mass inventory and the Peak Cladding Temperature are usually obtained shortly after the beginning of the ECCS accumulators injection (as it is observed during the ROSA test 7). Nevertheless, the overall reactor behavior during the accumulator injection is worth being studied with respect to the mass inventory distribution in the different parts of the vessel. More particularly, we have focused on the vessel downcomer area where three-dimensional effects are expected due to the asymmetric injection of subcooled ECCS water.
In France, the LOCA Intermediate Break Methodology (for the IBLOCA and SBLOCA break size range), developed by EDF and AREVA in the frame of the evolution of the LOCA regulation, retains a 2D nodaliza-tion of the vessel downcomer (theta, z, with one single mesh in the radial direction), using the 3D module and capability of the CATHARE code.
The work presented in this paper contributes to the understanding of this issue and to the related CATHARE validation.
3 CATHARE Code
CATHARE 2.V2.5 [3] is a multi-purpose multi-reactor concept system code that can describe several kinds of different circuits with variousfluids either in single-phase gas or liquid or in two-fluid conditions possibly with non-condensable gases. The code is capable of simulating any kind of reactor concept and any kind of accidental transient. CATHARE 2 uses flexible structures for thermal-hydraulic modeling. The main hydraulic compo-nents or elements are pipes (1D), volumes (0D), a 3D module and boundary conditions, connected to each other by junctions. Apart from the modeling of the hydraulic components, the code modules can model pumps, turbo-machines, control valves, T-junctions, sinks, sources, breaks and many other ones. The basic set of equation is based on a six-equation two-fluid model (mass, energy and momentum equations for each phase). Additionally, the code has
possibilities to take into account optional equations for non-condensable gases and radio-chemical components.
4 ROSA-LSTF modeling
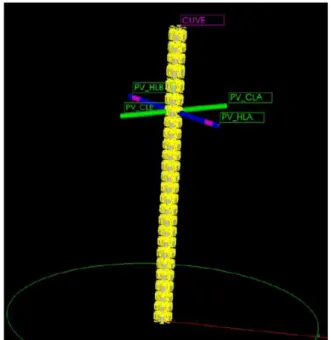
The ROSA-LSTF (Large Scale Test Facility) is located in Japan and it was constructed to simulate the full-scale height and 1/48 volumetrically-scaled down reactor of a Westinghouse four-loop PWR with thermal power of 3423 MW. It is composed by two primary loops that correspond to four primary loops of the reference West-inghouse PWR.Figures 1and2show the schematic view of the LSTF.
In order to compare the results, two nodalizations of the ROSA-LSFT vessel were developed with the CATHARE
Fig. 1. General view of LSTF [1].
Fig. 2. The view of hot and cold legs in LSTF [2]. 2 P. Mazgaj et al.: EPJ Nuclear Sci. Technol. 2, 1 (2016)
code. The 1D nodalization is depicted inFigure 3. To better model the phenomena in LSTF, the 3D nodalization of reactor pressure vessel was introduced, using the 3D module from the CATHARE code.
The 3D nodalization of the pressure vessel is shown in
Figures 4and5. As one can see, the pressure vessel has 26 meshes in vertical direction, six nodes in azimuth and radially four rings (the core region consists of 9 meshes in vertical direction, the lower plenum of 6 meshes and the upper plenum consists of 7 meshes). The most outer ring is used to model the downcomer, and the three inner rings are used to model the core (as shown inFig. 4).
Figure 6 shows the ROSA-LSTF break unit which is used to model the Double-Ended Guillotine Break (DEGB) of the ECCS pipe by using a 36.0 mm inner-diameter nozzle
shown below, which was upwardly mounted on the cold leg. The nozzleflow area corresponds to 13% of the volumetri-cally-scaled cross-sectional area of the reference PWR. The break is located in Cold Leg B.
5 Results of the calculations
CATHARE predicts the break flow rate and pressure in pressurizer rather well as it can be seen inFigures 7–9. In particular 3D model gives a pressure evolution which is very close to the experimental one. The major chronological events are listed inTable 1.
5.1 Downcomer mass inventory
The prediction (Fig. 10) of the overall pressure difference in the vessel downcomer (representative of the mass inventory)
Fig. 3. 1D nodalization of ROSA-LSTF. In the 3D nodalization, the pressure vessel (the nodalization in the red circle) was modeled using 3D modules from CATHARE code.
Fig. 4. 3D nodalization of the pressure vessel of ROSA-LSTF.
Fig. 5. The detailed view of the azimuthal and radial nodalization.
is much better using the 3D model, for which the pressure difference behavior is very close to the experimental one, whether it is before or after the beginning of the accumulator injection (around 160 s). It can be thus noticed that the 3D effects that are present in IBLOCA modeling are much better modeled by a 3D nodalization of the pressure vessel.
Such a large difference between the results coming from 1D and 3D nodalization has an origin in the behavior of the ECCS water while passing through the pressure vessel downcomer. Once the level in the downcomer has reached the cold legs, the 1D modeling cannot predict the counter-currentflow and the mixing between the cold ECCS water entering the top of the downcomer with the hotter water present in its lower part. Thus, the ECCSflow is mostly overpassing the downcomer and directlyflows to the break.
Fig. 7. Break flow rate.
Fig. 8. Integrated break flow rate.
Fig. 9. Pressure in pressurizer.
Table 1. Chronology of major events. Event Time [s]–
Experiment
Time [s]– CATHARE 3D Break valve open 0 0
Initiation of coastdown of primary coolant pumps
11.5 12 Initiation of HPI system in
loop with PZR (loop-A) only
26 27
Initiation of core power decay
30 30
Initiation of ACC system in loop-A only
154 158 Core reflooding 182 176 Upper plenumfilling 195 190 Primary coolant pumps
stopped
261 262 Termination of ACC
system in loop-A only
350 340
Fig. 10. Pressure difference in whole downcomer. 4 P. Mazgaj et al.: EPJ Nuclear Sci. Technol. 2, 1 (2016)
Moreover, as the temperature in the lower part of the downcomer remains close to the saturation temperature, the fast RCS depressurization (combined with wall heat release) induces flashing and steam production. This irrelevant behavior obtained with the 1D calculation is depicted in Figure 11, while the calculated void fraction profile inFigure 12clearly shows the steam production.
5.2 Overall vessel mass inventories in the 3D calculation
As the 3D model shows a good downcomer mass inventory prediction, we may expect also a good prediction of the mass inventories in the different other parts of the vessel and of the hot legs. The related pressure differences in different parts of the Pressure Vessel are shown in
Figures 13–16. The results compare rather well with the ones of the experiment. In particular, inFigure 14at 200 s, it can be pointed out that the beginning of the upper plenumfilling is well predicted by CATHARE.
Fig. 11. 1D modeling effects during LOCA.
Fig. 12. The void fraction in vertical direction close in downcomer at the Cold Leg A (at 350 s).
Fig. 13. Pressure difference in lower plenum of the pressure vessel.
Fig. 14. Pressure difference in the upper plenum of the pressure vessel.
InFigures 15and16, before the accumulator injection until around 180 s, one can observe that the pressure difference in the core region is underestimated by the 3D model. This could be explained by an overestimation of the water retained in the Steam Generator inlet plenum (possibly due to a more severe counter-current flow limitation in the calculation). This observation could lead to a further investigation.
Figure 17shows the fuel rod surface temperature in the fuel bundle located 5 cm under the top of the core. The curve is illustrating well the phase of the core reflooding.
5.3 Temperatures in the downcomer
The experimental temperature distribution in Figure 18
illustrates the idea that a 1D modeling of the downcomer is not accurate enough. One can realize that the schematic
flow in downcomer would be as the one shown inFigure 19. Colder water is entering the circuit through the Safety Injection, then isflowing through the downcomer and core. The temperature offluids in Cold Leg A (intact leg) is lower than the temperature of fluids leaving through the break, located in Cold Leg B (as shown inFig. 18).
The temperatures in Cold Legs are measured 1.6 m away from Pressure Vessel center. The temperature in the downcomer close to the Cold Leg A nozzle follows the Cold Leg A temperature, whereas the temperatures in Cold Leg B and in the downcomer close to the Cold Leg B nozzle follow the saturation temperature.
The 3D CATHARE model temperature predictions follow the experimental trends, though it can be observed that the code is underestimating the temperature in Cold Leg A and in the downcomer at the entrance of Cold Leg A (shown inFigs. 20and21). However, it can be noticed that the underestimation of the temperature in the downcomer
Fig. 17. Fuel rod surface temperature located in the fuel bundle 5 cm under the top of the core.
Fig. 18. Experimental results of temperature in Cold Leg A (CLA), Cold Leg B (CLB) and in the downcomer at the entrances of Cold Legs.
Fig. 16. Pressure difference in Steam Generator A (SGA) Inlet Plenum.
Fig. 19. The approximate flow of the coolant in the downcomer. 6 P. Mazgaj et al.: EPJ Nuclear Sci. Technol. 2, 1 (2016)
results from the underestimation observed in the cold leg. Further analysis of the Cold Leg A temperature could be performed, in connection with the condensation phenome-na at ECCS injection.
To better visualize the physical conditions in the downcomer, the temperature distributions at two different positions (1.8 m and 3.6 m, above the core bottom) were depicted inFigures 22and23. It can be easily noticed that the 3D model predicts better the temperatures in these lower parts of the downcomer. After the accumulator injection (around 160 s), one can observe, as in the experiment, a slight subcooling, suggesting inflow of some ECCS water Cold Leg A to downcomer, whereas the 1D model predicts saturated conditions at the same locations.
6 Conclusions
The 3D vessel modeling of the LSTF facility for the calculation of the OECD/NEA ROSA-2 Project Test No. 7 gives much better results than the 1D modeling while comparing with experimental data related to the mass inventory and the temperatures in the vessel downcomer. The ROSA-2 test No. 7 indicates that it exists strong 3D phenomena during the accumulator injection stage of an IBLOCA scenario. The calculations performed with the CATHARE code strongly suggest and justify the use of a 3D nodalization of the vessel downcomer, rather than a 1D nodalization, for such situations.
The present work containsfindings that were produced within the OECD/NEA ROSA-2 Project. The authors are grateful to the Fig. 21. Liquid temperature in the downcomer at the entrances
of the Cold Legs. Comparison between experimental and numerical results.
Fig. 22. The temperature in the downcomer at the elevation 1.8 m. Fig. 20. Liquid temperature in Cold Leg A and B, comparison
between experimental and numerical results.
Fig. 23. The temperature in the downcomer at the elevation of 3.6 m. Comparison between experimental and numerical results.
Management Board of this project for its consent to this publication.
We would like to thank Pascal Bazin from CEA, for his guidelines and help in ROSA-LSTF modeling.
Thanks are extended to Camille Charignon for his advices and suggestions that have greatly helped to improve the modeling in CATHARE.
Piotr Mazgaj would like to extend his thanks and appreciation to his supervisor, Jean-Luc Vacher for his guidance, advices and motivation during writing this paper. He would like also to thank EDF, for giving him an opportunity to do the internship in EDF SEPTEN. The internship was funded by project co-financed by the European Union as part of the Human Capital Operational Program (INSPE -Innovative Nuclear and Sustainable Power Engineering).
Nomenclature
CL Cold Leg
DEGB Double-Ended Guillotine Break
ECCS Emergency Core Cooling System
HL Hot Leg
IBLOCA Intermediate Break Loss of Coolant Accident
PWR Pressurized Water Reactor
RCS Reactor Coolant System
SI Safety Injection
References
1. ROSA-V, Large Scale Test Facility (LSTF) - System Description for the Third and Fourth Simulated Fuel Assemblies, Japan Atomic Energy Research Institute, JAERI-Tech 2003-037, 2003
2. OECD/NEA ROSA-2, Project Experimental Data/Informa-tion Transfer Final Data Report of ROSA-2/LSTF Test 7, Thermohydraulic Safety Research Group, Nuclear Safety Research Center, Japan Atomic Energy Agency, 2013 3. G. Geffraye, O. Antoni, M. Farvacque, D. Kadri, G. Lavialle,
B. Rameau, A. Ruby, CATHARE 2 V2.5_2: a single version for various applications, Nucl. Eng. Design 241, 4456 (2011)
Cite this article as: Piotr Mazgaj, Jean-Luc Vacher, Sofia Carnevali, Comparison of CATHARE results with the experimental results of cold leg intermediate break LOCA obtained during ROSA-2/LSTF test 7, EPJ Nuclear Sci. Technol. 2, 1 (2016) 8 P. Mazgaj et al.: EPJ Nuclear Sci. Technol. 2, 1 (2016)
![Fig. 2. The view of hot and cold legs in LSTF [2].](https://thumb-eu.123doks.com/thumbv2/123doknet/12939512.374895/3.892.471.813.396.1042/fig-view-hot-cold-legs-lstf.webp)