Publisher’s version / Version de l'éditeur:
Vous avez des questions? Nous pouvons vous aider. Pour communiquer directement avec un auteur, consultez la première page de la revue dans laquelle son article a été publié afin de trouver ses coordonnées. Si vous n’arrivez pas à les repérer, communiquez avec nous à PublicationsArchive-ArchivesPublications@nrc-cnrc.gc.ca.
Questions? Contact the NRC Publications Archive team at
PublicationsArchive-ArchivesPublications@nrc-cnrc.gc.ca. If you wish to email the authors directly, please see the first page of the publication for their contact information.
https://publications-cnrc.canada.ca/fra/droits
L’accès à ce site Web et l’utilisation de son contenu sont assujettis aux conditions présentées dans le site LISEZ CES CONDITIONS ATTENTIVEMENT AVANT D’UTILISER CE SITE WEB.
Thermochimica Acta, 182, pp. 303-317, 1991
READ THESE TERMS AND CONDITIONS CAREFULLY BEFORE USING THIS WEBSITE.
https://nrc-publications.canada.ca/eng/copyright
NRC Publications Archive Record / Notice des Archives des publications du CNRC :
https://nrc-publications.canada.ca/eng/view/object/?id=aa4197cd-7490-407e-9481-464b9d21b25f
https://publications-cnrc.canada.ca/fra/voir/objet/?id=aa4197cd-7490-407e-9481-464b9d21b25f
NRC Publications Archive
Archives des publications du CNRC
This publication could be one of several versions: author’s original, accepted manuscript or the publisher’s version. / La version de cette publication peut être l’une des suivantes : la version prépublication de l’auteur, la version acceptée du manuscrit ou la version de l’éditeur.
Access and use of this website and the material on it are subject to the Terms and Conditions set forth at
Characterization of ethylene-propylene diene monomer ( EPDM) roofing
membranes using thermogravimetry and dynamic mechanical analysis
Characterization
of ethylene-propylene-diene
monomer
(EPDM) roofing membranes using thermogravimetry
and
dynamic mechanical analysis zyxwvutsrqponmlkjihgfedcbaZYXWVUTSRQPONMLKJIHGFEDCBA
R.M. Paroli ‘, 0. Dutt a, A.H. Delgado a and M.N. Mechb
a Institute for Research in Construction, National Research Council of Canada, Ottawa, Ont. KIA OR6 (Canada)
b Construction Materials Board, Department of National Defence of Canada, Ottawa, Ont. KIA OK2 (Canada)
(Received 23 October 1990)
zyxwvutsrqponmlkjihgfedcbaZYXWVUTSRQPONMLKJIHGFEDCBA
Abstract
The effect of heat-aging at 100” C and 130°C on three EPDM roofing materials was studied by thermogravimetry (TGA), dynamic mechanical thermal analysis (DMA) and tensile testing. It was found that both TGA and DMA can be used in a routine manner to explain the changes in mechanical properties of EPDM roofing membranes. In general, the results showed that the degradation of the material increased with heating temperature and exposure duration. It was also shown that aging at elevated temperatures can reduce the time required to evaluate the effect of heat on mechanical properties of polymer-based roofing materials.
INTRODUCTION
Roofing membranes have been used for many years. In the past, the testing of various roofing materials was simple because of the accumulated experience and the lack of variety encountered. This, however, has changed radically with the availability of many different types of polymeric or polymer-based roofing membranes. Since these different types vary from modified-bitumen to PVC and EPDM-based roofing membranes in terms of chemical, physical, and mechanical characteristics, it is quite difficult to compare them solely on the basis of mechanical properties as has generally been done in the past. This is especially true since the mechanical properties of these materials are not only related to macroscopic behaviour but also at the molecular level which is controlled by chemical composition and molecu- lar arrangement. Mechanical tests only describe how a material behaves with respect to a certain test and do not explain why the material failed unless the failure is related solely to structural properties. Thus, the mechanical tests cannot really assist in solving the problem and/ or in the development of methods to assess the long-term behaviour of materials.
Thermal analysis is a technique that can provide some insight as to why
some roofing materials fail more prematurely than others. Thermogravime-
try (TGA) can be used to monitor changes in chemical composition
of a
material during weathering and/or exposure to elevated temperatures. Dy-
namic mechanical analysis (DMA or DMTA) can be used routinely to
determine various properties of a roofing membrane, e.g. the glass transition
temperature.
Together, DMA and TGA can provide a measure of the
degradative factors which can lead to the correlation between accelerated
weathering and actual field performance.
In general, the roofing industry has used mainly mechanical tests for
characterization
and diagnostic work. The objective of this study is to
demonstrate the utility of TGA and DMA in establishing the durability of
roofing membranes because although these techniques have been applied to
polymers [l] and other const~~tion
materials, application of these tech-
niques is relatively new in the roofing field. An effort is made to correlate
the mechanical properties of the roofing materials with thermal analyses and
field service.
EXPERIMENTAL
The thermogravimetric
and dynamic mechanical analyses as well as the
mechanical tests were performed on control and heat-aged EPDM roofing
samples. A typical composition of an EPDM roofing membrane is given in
Table 1. zyxwvutsrqponmlkjihgfedcbaZYXWVUTSRQPONMLKJIHGFEDCBA
Heat- aging
Three commercially available, non-reinforced
EPDM roofing membrane
samples (Sl, S2 and S3) were obtained. Each sample was cut into seven
pieces of about 150
X 250mm of which one piece was used as a control and
three were placed in air-circulating ovens preheated to 100° C and 130°C
TABLE 1
Typical composition of a generic EPDM roofing membrane Ingredients wt.% (approx.) Function
Synthetic rubber or blend 26 Imparts elastomeric properties Carbon black 37 Reinforces elastomeric properties
and absorbs UV, acts as filler Extender oils 28 Aid processing and reduce cost
Curing agents 4 Promotes proper cure
Antioxidants and antiozonants 3 Assist in resisting environmental factors Processing aids 2 Promotes anti-sticking, and provides
for heat-aging. One piece of each sample was removed from the oven after 1, 7, and 28 days. This provided a total of 105 specimens for tensile testing and thermal analyses.
Tensile testing
The heat-aged material was conditioned at room temperature (22 + 2” C) for a minimum of 24 h prior to testing. The specimens were cut from the control and aged samples, using a dumbbell-shaped die in a hydraulic press. The tests were carried out at room temperature using an Instron tensile tester (model 1122) with a gauge length of 60 mm and cross-head speed of 60 mm mm’. The load and elongation curves were recorded on the machine chart recorder as well as being stored in the computer. Five specimens were tested for each condition and the mean values
elongation-at-break were recorded. These are listed in Table 2.
Thermogravimetric analysis
of load and
The weight-loss of each EPDM roofing sample was monitored by thermo- gravimetric analysis using a Du Pont Instruments model 951 interfaced to a 9900 and 1090 computer. A piece of approximately 25-40 mg of sample was cut using a hole puncher to ensure a uniform shape and better contact with the sample pan. The analyses were carried out at temperatures between 20 o C and 800 o C using a nitrogen gas flow of 100 ml min-’ and a scanning rate of 20°C min- ‘. Throughout this study the derivative TGA (DTG) curve was used as it provided the desired quantitative data. The data obtained from the DTG curves are not shown on the curves themselves but, for greater clarity, are tabulated in Table 3 as a function of heat-aging temperature and exposure-time.
TABLE 2
Tensile strength and elongation values of EPDM membranes
Heat-aging schedule Strength (kN m-l) Elongation ( W)
Temp. ( o C) Days Sl s2 s3 Sl s2 s3 22 a 0 10.6 8.7 11.4 522 285 307 100 1 10.9 8.8 10.8 433 266 314 100 7 11.6 9.5 11.3 396 211 297 100 28 10.7 10.5 10.6 324 132 270 130 1 9.9 9.2 9.3 348 180 273 130 7 9.7 10.9 9.8 307 88 227 130 28 8.0 11.6 9.7 218 38 159
TABLE 3
TGA data for oil and polymer component content in the EPDM samples prior to and after heat-aging at 1OO’C and 130°C
Heat-aging schedule Oil loss b (I% ) Temp. ( o C) Days Sl s2 s3 Polymer loss ’ (W ) Sl s2 s3 22 a 0 20.0 52.5 22.5 52.5 100 1 13.2 54.0 25.5 51.8 100 7 7.2 53.4 27.7 51.9 100 28 4.9 54.5 29.1 51.6 130 1 5.1 54.0 28.5 52.8 130 7 2.2 53.6 30.0 52.4 130 28 1.6 51.6 31.2 51.8
a Unheated control sample.
b Based on the integrated area of peak between 200 and 400 o C (not available for Sl or S3). ’ Based on the integrated area of peak between 400 and 550 o C. In the case of Sl and S3, the
area most probably includes both oil and polymer loss.
zyxwvutsrqponmlkjihgfedcbaZYXWVUTSRQPONMLKJIHGFEDCBA
Dy namic mechanical analy sis
zyxwvutsrqponmlkjihgfedcbaZYXWVUTSRQPONMLKJIHGFEDCBA
A Polymer Laboratory dynamic mechanical thermal analyser (PL-DMTA Mark I) was used with software version 4.0. The EPDM control and aged sheets were cut in the machine direction (1 mm thick, 5 mm long, 12 mm deep) and were run in the DMA in single cantilever mode using test frame L and clamp type C. A fixed frequency of 10 Hz and a heating rate of 2” C min-’ was used to study the samples between - 120 and + 80 o C. In this system, a sinusoidal stress is applied to a vibrator unit using a sinusoidal current. The stress imposed upon the specimen is therefore directly related to the amount of current delivered to the vibrator. The sample is also subjected to strain via the induced displacement.
The glass transition temperature (a-transition) values were obtained from the maximum in the loss modulus (E” ) vs. temperature curve. The glass transition temperature data for all three samples are summarized in Table 4. RESULTS AND DISCUSSION
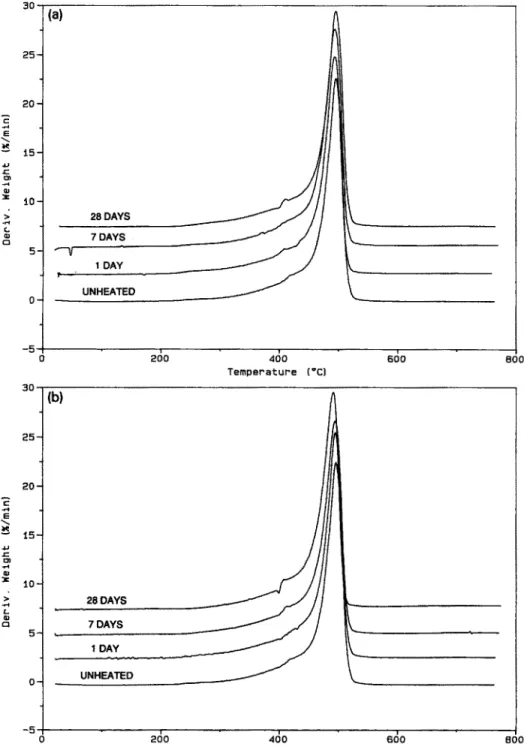
The DTG curves for the EPDM sample Sl before and after heat-aging for 1, 7 and 28 days at 100 o C and 130 o C, are displayed in Fig. 1. It can be seen that in each case the elastomer degrades in the temperature range of about 300%550°C. The very weak shoulder observed in the 400-450°C range might be due to the volatilization of oils and/ or plasticizers, which are typical ingredients in EPDM membranes (see Table 1). Since the volatiliza- tion of the oils and/ or plasticizers overlap with the decomposition region of the polymer, percent oil weight-loss in the sample could not be determined. This type of thermal curve is frequently observed when the oils and/ or
TABLE 4
Glass transition temperatures of EPDM membranes
Heat-aging schedule Tg ( o C) for samples
Temp. ( o C) Days Sl s2 s3 22 a 0 -49 -61 -46 100 1 -48 -58 -45 100 7 -49 -50 -42 100 28 -50 -46 -44 130 1 -48 -50 -46 130 7 -49 -46 -45 130 28 -48 -43 -44
a Unheated control material.
zyxwvutsrqponmlkjihgfedcbaZYXWVUTSRQPONMLKJIHGFEDCBA
plasticizers are of low volatility [l]. From the curves, it can be seen that there is no significant degradation of the EPDM until approximately 350 o C, which is well above the heat-aging temperature. This may explain why, as will be shown later, no significant difference is observed in the strength and glass-transition temperatures between the unheated and the heat-aged speci- mens exposed for 1, 7 and 28 days at 100°C and 130” C (see Tables 2 and 4).
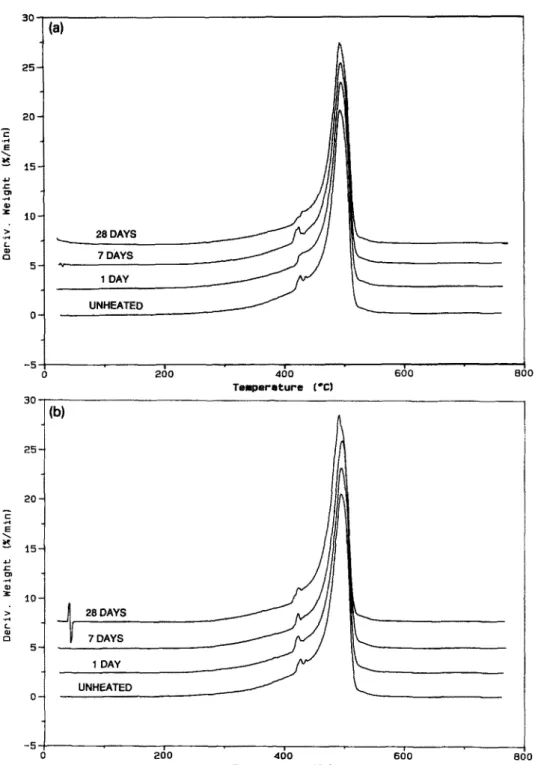
The derivative-TGA thermograms for the S2 specimens before and after heat-aging are given in Fig. 2. It can be clearly seen that the material degrades via a two-step process yielding weight-losses between 150 and 430 o C, and between 440 and 550 O C. The first weight-loss is most likely to arise from the volatilization of oils and/ or plasticizers while the second weight-loss corresponds to the degradation of the polymer. Contrary to the Sl DTG curves (Fig. l), the volatilization of oil does not overlap with the weight-loss region of the polymer, which may indicate that the oil in sample S2 is more volatile than that in Sl. It is therefore possible to estimate the weight-loss for both the oil and polymer components of S2. As can be seen in Table 3, 20% of the unheated (control) material is volatilized in the 150-430 O C range while 22.5% of the polymer component decomposes in the 440-550 O C range. In the case of the samples heated at 100 O C and 130 O C, it was observed by TGA that the oil weight-loss decreased with time of exposure. For example, after 28 days of heat-aging at 130” C, 1.6% oil was detected (i.e. 92% of the oil content has been lost during heat-aging) by TGA vs. 5.1% (i.e. 75% of the oil was lost during the heat treatment) after 1 day of heat-aging:Furthermore, as the heat-aging temperature increases, the amount of oil lost decreases, i.e. after 1 day heat-aging at 130” C, the EPDM lost 5.1% of the oil (or 75% of the oil was volatilized during the heat-aging) compared to 13.2% (or 33% of the oil was lost in the heat-aging process) after 1 day heat-aging at 100” C. It was also noticed that the polymer loss increased as the oil loss decreased (Fig. 3) and physically, the sample became
UNHEATED 0 zyxwvutsrqponmlkjihgfedcbaZYXWVUTSRQPONMLKJIHGFEDCBA 0 200 400 600 (
b)
Temperature (‘Cl 28 DAYS 7 DAYS f DAY 1 200 400 Temperature (‘C) I 600 8 0Fig. 1. Derivative TGA (DTG) curve for the Sl EPDM sample heat-aged at (a) lOO*C and (b) 130°C, for 0 (unheated), 1, 7 and 28 days.
200 400 Temperature (‘Cb 600 f
zyxwvutsrqponmlkjihgfedcbaZYXWVUTSRQPONMLKJIHGFEDCBA
1 DAY UNHEARD 0I
-5 I 0 200 I 400 Temperature f’C) 600 IFig. 2. Derivative TGA (DTG) curve for the S2 EPDM sample heat-aged at (a) lOO*C and (b) 130° C, for 0 (unheated), 1, 7 and 28 days.
brittle, This may indicate that the oils are used as plasticizers (e.g. hydro-
carbon oils [2]) and/or
stabilizers as well as processing agents, or that the
heist-boss
includes oifs, stabilizers and plasticizers. Aff of the TGA data
imply that during the heat treatment of S2, oii is vofatihzed and as a result
the polymer component degrades more rapi@y.
The DTG curves for the EPDM samples 53, (control and heat-aged)
plotted in Fig. 4 show that, as in the case of S1, the degradation of the
material occurs in one step. A shoulder appears in the 400-450 p C range,
but it is more pronounce
and better defined than for SL As was pxeviuusIy
mentioned,
this shoulder may be attributed
to volatilization
of the oils
and/or plasticizers.
Although all the samples have been heat-aged below the temperature
where de~adat~o~ begins {i.e. below ZOO*
C), they still show some visual
signs of de~adat~on due to the length of exposure time. This is esp~~~~y
true for 52. The DTG curves for Sl (Fig, I), 52 (Fig. 2) and S3 (Fig. 4) seem
to indicate that the oils and/or plasticizers used in the Sl and S3 EPDM
materials are of similar volatilities thaugh the oil in Sl would appear to be
more stable than that found in S3. Moreover, the oil for both Sl and 53 is
considerably different from that used in sample S2, which is more voiatile,
In addition, sume degree of stab~~~o~
against thermal degradation
is
possible through the use of additives [3,43. ‘Therefore, the different oil
and/or the use of additives may explain the higher thermal stability of the
Sl and S3 samples compared to that of S2.
‘*
(a)
25- UNHEATED o- -5 ; 0 3o (b) I 200 400zyxwvutsrqponmlkjihgfedcbaZYXWVUTSRQPONMLKJIHGFEDCBA
Teaperature [‘Cl 25- UNHEARD o--55
0 200 400 600 8 Temperature (‘c)Fig. 4. Derivative TGA (DTG) curve for the 53 EPDM sample heat-aged at (a) 100 *C and (b) 13O“C, for 0 (unheated), 1, 7 and 28 days.
The use of oils and/or plasticizers in polymers is to improve the processa- bility of the compounds, reduce cost, improve low temperature performance, etc. [l]. Hydrocarbon oils are often used because they can act as plasticizers and fillers [2]. As mentioned earlier, S2 loses the oils and/or plasticizers at much lower temperatures than do either Sl or S3. In addition, the percent weight-loss decreases with increasing temperature and time duration, which indicates that part of the volatile component may have been lost during the aging process. As a result, the sample loses some of its initial flexibility, inducing glass-like behaviour [3]. This will affect the tensile strength of the material and hence, the material will fail more easily than Sl and S3 EPDM. As can be seen from the tensile and elongation data (Table 2), the strength of Sl and S3 membranes remains fairly constant or decreases slightly. For S2, however, the strength at break increases with heat-aging, indicating that the sample is becoming more brittle. The elongation-at-break data for non heat-aged material is greater for both Sl and S3 than for S2. Perhaps this shows that the non-volatile oils are better plasticizers than the volatile ones and/or that there is a greater polymer component of Sl and S3 than S2. The elongation-at-break data, however, indicates that all three membrane sam- ples have lost some of their elongation capabilities after heat-aging. This would signify that even when little or no oil is lost during the heat-aging process, the property of the membrane is changed. It is possible that, even if the processing oils are not completely lost during the heat treatment, their quality degrades and consequently they do not lubricate (i.e. plasticize) efficiently. If this were the case, then the elongation of the samples would decrease without seeing any significant change in glass transition tempera- ture (T,) of the roofing membrane. In order to verify this, the three roofing membranes were studied by DMA.
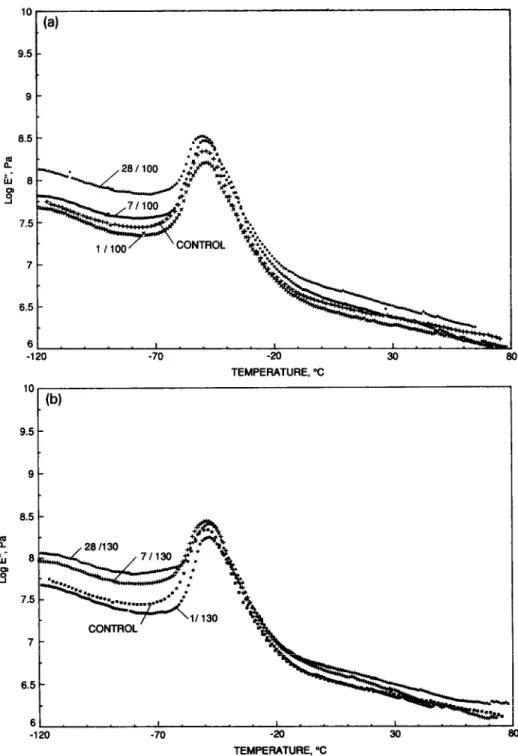
The dynamic mechanical analysis curves for sample Sl, showing the loss modulus
zyxwvutsrqponmlkjihgfedcbaZYXWVUTSRQPONMLKJIHGFEDCBA
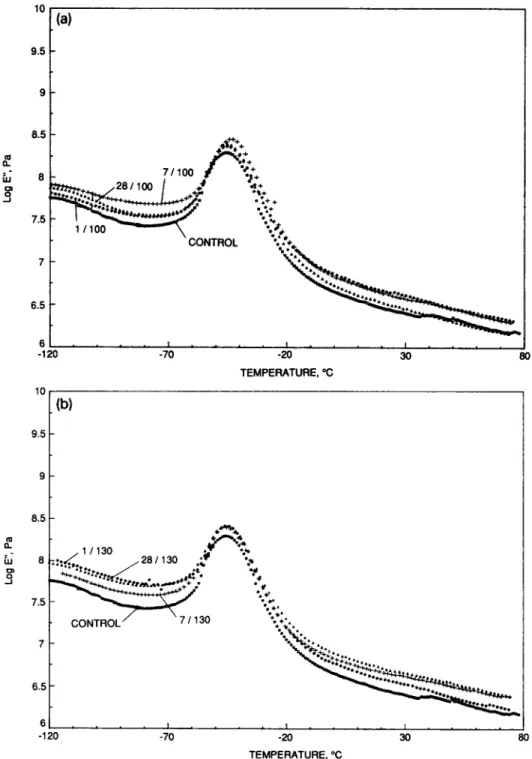
(E”) as a function of temperature can be found in Fig. 5 for heat-aging at 100” C and 130 o C, respectively. Sample Sl undergoes very little change in glass transition temperature even after 28 days of heating at 100 o C and 130 o C. Sample S2, however, exhibits a significant change in Ts. Figures 6a (S2 heat-aged at 100°C) and 6b (S2 heat-aged at 130” C) show the DMA curves for sample S2 heat-aged for 0, 1, 7 and 28 days. It is apparent that Tg increased with the number of days of heating. For example, in the case of S2 at 100 O C, the Tg values changed by approximately 20 O C, i.e. from - 61” C for no treatment to -46” C after 28 days of heat-aging, while at 130 O C the glass transition temperature surged from - 61° C to- 50” C after only one day of accelerated aging. Following this sudden jump, the Tg gradually increased to -43°C after 28 days of heat-aging at
130 O C. Sample S3 (Fig. 7) appears to behave in a similar fashion to Sl, i.e. little change in glass transition temperature is observed after accelerated aging.
9.5 9 i 2 h 0
s”
7.5 7 6.5 6 -120 -20 TEMPERATURE, “Clo
(b)
9.5 t 7 6.5 6 -120 -70 -20 30 TEMPERATURE, “cFig. 5. DMA curves for specimen Sl aged at (a) 100 o C for 0 days (control), 1 day (l/100), 7 days (7/100) and 28 days (28/100) and (b) 130°C for 0 days (control), 1 day (l/130), 7 days (7/130) and 28 days (28/130).
lo
(4
9.5-
9- a.5 r 2 & 04”
7.5 7 -120 -70 -20 30 TEMPERATURE, “c 9.5 9 t 6.5 -66
-120 -70 -20 30 TEMPERATURE, “C 1Fig. 6. DMA curves for specimen S2 aged at (a) 100 o C for 0 days (control), 1 day (l/100), 7 days (7/100) and 28 days (28/100) and (b) 130 o C for 0 days (control), 1 day (l/130), 7 days (7/130) and 28 days (28/130).
10 9.5 6 -1 I . . . I ., , -70 -20 30 TEMPERATURE, “C 6.5 - 6 . . .I ., ., , ., -120 -70 -20 30 TEMPERATURE, “C
Fig. 7. DM A curves for specimen S3 aged at (a) 100 o C for 0 days (control), 1 day (l/100), 7 days (7/100) and 28 days (28/100) and (b) 130°C for 0 days (control), 1 day (l/130), 7 days (7/130) and 28 days (28/130).
by the TGA data) is affected to any great extent by the heat-aging process.
Although the
zyxwvutsrqponmlkjihgfedcbaZYXWVUTSRQPONMLKJIHGFEDCBA
Tg of S2 after 28 days of heat-aging is similar to Sl and S3, the fact that it is shifting to higher temperatures indicates that it is becomingmore crosslinked and its physical/ mechanical properties are changing accordingly (Table 2). As has been mentioned previously, all three roofing membranes sustained a change in their elongation-at-break capacity with this change being more dramatic for sample S2. Since the Tg did not vary to any great extent for samples Sl and S3, our earlier hypothesis that the quality of the oil is deteriorating could very well be true. The fact that the Tg values for S2 are changing quite extensively could be explained by an increase in crosslinking and/ or the loss of plasticizers which might be contained in the oil (or the oil itself might be acting as a plasticizer).
It should be noted that S2 would have been considered the most ap- propriate membrane to use on roofs in -extremely cold climates if no heat-aging had taken place. The importance of heat-aging is therefore quite obvious and must be carried out to properly evaluate a series of membranes.
It may be of interest to note the apparent equivalencies in the behaviour of materials aged at different temperatures. From the TGA and DMA data (Tables 3 and 4), it would appear that between 1 and 7 days of heat-aging at 130 O C is equivalent to 28 days of heat-aging at 100 o C. The equivalency is most obvious for the S2 sample where the percent weight-loss of oil is 4.9% while that for the polymer component is 29.1% after 28 days at 100” C, compared with 5.1% and 28.5% for the oil and polymer components, respectively, after only one day at 130 o C. The glass transition temperature for S2 is -46°C after 28 days at 100°C and ‘7 days at 130° C indicating apparent equivalency. This indicates that accelerated aging, induced by exposing membranes to elevated temperature, may reduce the time required at the maximum service temperature to evaluate the effect of heat on mechanical properties of polymer-based materials. It is much more difficult to make any statement with regard to equivalency for Sl and S3 since the observed changes in weight-loss and Tg are minimal and could easily be due to experimental error.
CONCLUSIONS
EPDM roofing materials were characterized using thermogravimetry, dynamic mechanical analysis and tensile testing. It was shown that both TGA and DMA can be used to evaluate the properties of various roofing membranes. The use of a dynamic analyser facilitates the determination of the glass transition temperature which can be used to explain the change in mechanical properties of roofing membranes. The volatilities and polymer components of a roofing membrane can be determined by TGA. These methods can be used to assess the validity of the accelerated aging processes that expose membranes to elevated temperatures, and thus reduce the time
required to evaluate the effect of heat on the mechanical properties of
polymer-based
materials. Finally, the equivalency of material response at
different temperatures could help in establishing standard requirements.
ACKNOW LEDGEM ENTS
This joint research project is funded by Canada Post Corporation,
De-
partment of National Defence, the Department
of Public Works Canada,
and the National Research Council of Canada.
REFERENCES
1 E. Turie, Thermal Characterization of Polymeric M aterials, A cademic Press, New York, 1981.
2 S.L. Rosen, Fundamental Principles of Polymeric M aterials for Practising Engineers, Barnes t Noble Inc., New York, 1971.
3 D. Feldman, Polymeric Building M aterials, Elsevier Applied Science, London, 1989. 4 C. Hall, Polymeric M aterials, 2nd Edn., A Halsted Press Book, W iley, New York, 1989.