HAL Id: hal-00318216
https://hal.archives-ouvertes.fr/hal-00318216
Submitted on 22 Nov 2006
HAL is a multi-disciplinary open access
archive for the deposit and dissemination of
sci-entific research documents, whether they are
pub-lished or not. The documents may come from
teaching and research institutions in France or
abroad, or from public or private research centers.
L’archive ouverte pluridisciplinaire HAL, est
destinée au dépôt et à la diffusion de documents
scientifiques de niveau recherche, publiés ou non,
émanant des établissements d’enseignement et de
recherche français ou étrangers, des laboratoires
publics ou privés.
observed by ISEE-1 and 2
C. A. Zuluaga, E. S. Beiser, Jie Chen, T. A. Fritz
To cite this version:
C. A. Zuluaga, E. S. Beiser, Jie Chen, T. A. Fritz. Implications of unusual pitch-angle distributions
observed by ISEE-1 and 2. Annales Geophysicae, European Geosciences Union, 2006, 24 (11),
pp.3099-3113. �hal-00318216�
www.ann-geophys.net/24/3099/2006/ © European Geosciences Union 2006
Annales
Geophysicae
Implications of unusual pitch-angle distributions observed by
ISEE-1 and 2
C. A. Zuluaga, E. S. Beiser, J. Chen, and T. A. Fritz
Center for Space Physics, Boston University, Boston MA, USA
Received: 14 May 2004 – Revised: 6 October 2006 – Accepted: 13 October 2006 – Published: 22 November 2006
Abstract. Unusual energetic particle pitch angle
distribu-tions (PADs) were observed by the ISEE-1 and 2 satellites
at 3 h MLT and a radial distance of about 10–15 RE during
the time period of 07:00-14:00 UT on 3 March 1979. The ISEE-1 satellite obtained complete 3-D distributions of en-ergetic proton and electron fluxes as a function of energy, while ISEE-2 was configured to provide higher time reso-lution but less angular resoreso-lution than ISEE-1. The ISEE-1
observed a butterfly PAD (a minimum in the 90◦ PA
parti-cle flux) for a period of about 2 h (10:00–12:00 UT) for the electrons, and 3 h (09:00–12:00 UT) for the protons over an energy range of 22.5–189 keV (E1–E4) for the electrons and 24–142 keV (P1–P4) for the protons. The small pitch
an-gle (15◦, 30◦) charged particles (electrons and protons) are
seen to behave collectively in all four energy ranges. The
relative differences in electron fluxes between 15◦ PA and
90◦PA are more significant for higher energy channels
dur-ing the butterfly PAD period. Three different types of
elec-tron PADs (butterfly, isotropic, and peaked-at-90◦) were
ob-served at the same location and time as a function of energy for a short period of time before 10:00 UT. Electron butter-fly distributions were also observed by the ISEE-2 for about 1.5 h over 28–62 keV (E2–E4), although less well resolved than ISEE-1. Unlike the ISEE-1, no butterfly distributions were resolved in the ISEE-2 proton PADs due to less angular resolution. The measured drift effects by ISEE-1 suggest that the detected protons were much closer to the particle source than the electrons along their trajectories, and thus ruled out a nightside source within 18:00 MLT to 03:00 MLT. Compared to 07:30 UT, the charged particle fluxes measured by ISEE-1 were enhanced by up to three orders of magnitude during the period 08:30–12:00 UT. From 09:10:00 UT to 11:50 UT, the geomagnetic conditions were quiet (AE<100 nT), the LANL geosynchronous satellites observed no substorms, and the
lo-Correspondence to: T. A. Fritz
(fritz@bu.edu)
cal magnetic field measured by ISEE-1 was almost constant, while the small PA charged particle (both electron and pro-ton) fluxes measured by ISEE-1 increased gradually, which implies a particle source other than the substorm source. Based on detailed particle trajectory tracings in a realistic geomagnetic field model, the 50–200 keV protons with small PA at 10:00 UT ISEE-1 location on 3 March 1979 were passing through the northern high-altitude and high-latitude morningside region where the cusp should be located under a dawnward IMF component condition, while those protons with large PA may connect to the high-latitude morningside magnetopause. It is possible that the cusp source is responsi-ble for the all particles observed during the event.
Keywords. Magnetospheric physics (Magnetotail;
Ener-getic particles, trapped). Space plasma physics (Charge par-ticle motion and acceleration)
1 Introduction
The particle pitch angle distributions (PADs) in different re-gions of the Earth’s magnetosphere have been extensively studied and reported. West (1965) made the earliest obser-vations of butterfly PADs. These butterfly distributions were caused by the Russian high-altitude nuclear detonation on 28 October 1962. Various reasons for the natural occurrence of butterfly distributions have been given in literature; such as drift shell splitting (Roederer, 1967, 1970) and either mag-netopause shadowing (West et al., 1972, 1973) or a negative radial flux gradient (Pfitzer et al., 1969; Sibeck et al., 1987). Drift shell splitting arises from the local time asymmetry of the geomagnetic field. Due to the compression by the so-lar wind the geomagnetic field is not an exact dipole. A
mag-netic field line for example crossing the equator at 7 RE on
the dayside will have a larger value of BEq than a magnetic
Fig. 1. (a) The measurement of particle fluxes over the unit sphere is produced during one 36.5 s spin/scan cycle of the WAPS instrument
onboard ISEE-1. (b) The unit sphere can be made into a mercator projection, on which pitch angle contours and flux intensities are overlaid. The resulting plot displays the Pitch Angle Distribution (PAD) used in subsequent figures (from Eccles and Fritz, 2002).
Since particles mirroring at the equator and conserving their first adiabatic invariant will follow contours of constant B, a
particle that crosses the noon meridian at X=R0will cross the
midnight meridian at a distance smaller than R0. Reeves et
al. (1991) used the Tsyganenko magnetic field model
(Tsy-ganenko et al., 1982) to show that the drift shells of ions
starting at 6.7 RE on the noon meridian split to a radial
dis-tance range of 6.2 RE to 7.4 RE on the nightside.
Magne-topause shadowing is the process whereby 90◦pitch angle
(PA) particles of all energies drift to a larger radial distance than smaller PA particles on the dayside and are lost from the distribution due to scattering at the magnetopause. The
loss of these 90◦ PA particles is what we currently refer to
as a butterfly PAD. Because the particles arrive at different radial distances on the nightside depending on their equato-rial PA, the variation of the particle intensity as a function of radial distance on the dayside will be reflected in the redistri-bution of these particles on the nightside. Since the intensity of the particle fluxes usually decreases with radial distance at
R>5 RE, a minimum in the local nightside PAD at equatorial
pitch angles near 90◦can be produced without the actual loss
of any particles.
West et al. (1973) showed that electrons with energies of about 79 keV, and at times up to 158 keV, could have an isotropic distribution, while higher energy electrons showed a butterfly distribution. Smets et al. (1999) showed that there are three distinct domains due to the magnetic field evolu-tion in the near-Earth tail; each region being most efficient at producing only a single type of distribution. Data from ISEE-1 (International Sun Earth Explorer-1) have shown that butterfly distributions are very common particularly in en-ergetic electrons and are observed for periods of hours in the Earth’s magnetotail (Fritz and Chen, 1999; Fritz et al., 2003a). ISEE-1 also observed different types of charged par-ticle PADs at the same time and location as a function of energy (Fritz et al., 2003a).
2 Instrumentation
The data set used is mainly from the ISEE-1 spacecraft that was launched together with ISEE-2 on 22 October 1977 into
an elliptic orbit with apogee of 23 RE and perigee 280 km,
a period of about 57 h and an inclination of about 28◦.
A variable distance separated the two spacecraft, so data from complementary instruments can be used to separate space/time ambiguities. The Medium Energy Particles Ex-periment (MEPE) sensors on each satellite were designed to detect electrons and ions ranging from 22.5 keV to 1.2 MeV for electrons and 24 keV to 2 MeV for protons. For the WIM instrument aboard ISEE-1 these energy ranges were divided into eight energy channels each for electrons and ions in the standard Low Bit Rate [LBR] mode. The WAPS (Wide Angle Particle Spectrometer) on ISEE-1 was mounted on
a scan platform which rotated 160◦ from nearly parallel to
nearly anti-parallel to the spin axis in 12 satellite spin pe-riods which required about 36.5 s. The sensor had a look
direction opening conical half-angle of 5.3◦. Williams et al.
(1978) have given a detailed description of this instrument. The data returned from the ISEE-1 MEPE were converted to flux for each of the energy passbands and plotted as a func-tion of both time and L-value (McIlwain, 1961) for the two years of operational life of the ISEE-1 experiment. Using si-multaneous measurements of the geomagnetic field provided by the onboard magnetometer (Russell, 1978), the instanta-neous pitch angle of a given particle measurement was de-termined. As illustrated in Fig. 1 (after Eccles and Fritz, 2002) for each 36.5 s spin/scan cycle of the WAPS, a repre-sentative flux corresponding to each energy channel for eight sectors [LBR mode] of each spin was determined. This re-sulted in 96 samples being made on the 4π steradian unit sphere. The spin axes of the ISEE satellites were essentially perpendicular to the ecliptic plane. These fluxes could be displayed in a color coded manner on a mercator projection of the unit sphere where the vertical axis is the polar angle
and the horizontal axis is the azimuthal angle in spacecraft coordinates which were essentially Geocentric Solar Eclip-tic [GSE] coordinates. The scale on the horizontal axis [ϕ]
has the sunward direction at 0◦and the antisunward direction
at 180◦. For clarity it is emphasized that the look direction
is the direction from which the energetic particles are com-ing. The vertical axis direction [θ ] is the scan direction where
θ =0◦is antiparallel to the spacecraft spin axis viewing the
south ecliptic pole and θ =180◦ is parallel to the spin axis
viewing the north ecliptic pole. At θ =90◦, the 0◦ and 90◦
azimuthal directions represent essentially the GSE X- and Y-axes, respectively. The pitch angle associated with each flux measurement was determined instantaneously from the magnetometer data and used to place contours of constant pitch angle on these unit sphere angle/angle [θ, ϕ] displays (from Fritz et al., 2003a).
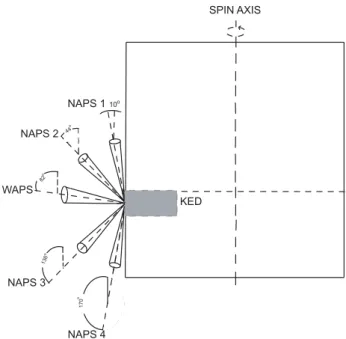
Aboard the ISEE-2 spacecraft was the KED instrument. The KED instrument consisted of a WAPS sensor plus four additional Narrow Angle Particle Spectrometers (NAPS) mounted in fixed positions with respect to the spin axis on the ISEE-2 satellite. A drawing of the KED instrument is pre-sented in Fig. 2. The WAPS on ISEE-2 functioned in a sim-ilar manner to the one mounted on ISEE-1. The NAPS used a homogenous magnetic field to separate the electrons from the ions. The ions traversed the field unaffected and were de-tected similar to the manner in which they were dede-tected by the WAPS. The KED instrument provided a higher time res-olution, but less detailed angular resolution with the multiple sensors. ISEE-2 had two operational modes, mode A and mode B, which maintained the same data format (Williams et al., 1978). In mode A, all 5 sensors contributed equal frac-tions of the data stream. Opfrac-tions were possible to give the ions or electrons full rate, or both ions and electrons in a given direction. In mode B, most of the data stream was de-voted to the WAPS (no significant contribution was received from the NAPS). For each spin the detailed energy channel data was either from a single ion or electron detector.
3 Observations
From 07:00 UT to 14:00 UT on 3 March 1979 the satellites ISEE-1 and 2 were moving inbound in the nightside magne-totail of the magnetosphere at a location of about 03:00 MLT
with a radial distance of about 14 RE. Figure 3 shows the
projection of the ISEE satellites trajectories onto the GSM XY plane (left panel) and GSM XZ plane (right panel) for this time period when the satellites were close to the
equato-rial plane (–1.6>GSM Z>–2.7 RE) (right panel of Fig. 3).
The top panel of Fig. 4 plots the time profiles of the electron fluxes measured by ISEE-1 during this time
pe-riod. Four different pitch angles (15◦±5◦, 30◦±5◦, 60◦±5◦,
90◦±5◦) are plotted for each of the four energy
lev-els: E1 (22.5–39 keV), E2 (39–75 keV), E3 (75–120 keV), E4 (120–189 keV). All of the different energies follow the
NAPS 1 NAPS 2 10o NAPS 4 NAPS 3 KED WAPS 13 6 o 82 o 44 o SPIN AXIS 1 7 0 o
Fig. 2. The scanning ranges of the KED instrument onboard the
ISEE-2 satellite. The contribution of each detector depends on the operational mode of the satellite.
same flux scale on the y-axis, but the fluxes of each energy channel are offset by a power of ten in order to fit all en-ergy channels into one plot. In this figure, we observe an isotropic distribution in all energy ranges up to about a time
of 09:10 UT. After this time, only the small PA (15◦and 30◦)
electrons appear to behave in an similar manner in all en-ergy ranges aside from a small flux difference most notably observed in channels E2 and E3 during the time of 10:00– 11:00 UT. From about 09:10-9:15 UT, the E3 and E4 large
PA (60◦and 90◦) electron fluxes start to vary differently with
respect to the small PA electron flux. The large PA elec-tron fluxes in E2, E3, and E4 are seen to have sharp increases around 09:25 UT and 09:50 UT. A slight variation in the large PA electrons from the small PA electrons is seen in energy energy channel E1, but not to the extent observe in the other three energy channels. At around 10:00 UT, the large PA electron fluxes dropped over an order of magnitude in the E3 and E4 channels, and a little less than an order of magnitude in the E2 channel. From 10:00 UT to 12:00 UT, while the
60◦and 90◦PA electrons seem to act as one group in energy
channel E1 and E2, where close to a constant flux is main-tained, the large PA electrons are seen to behave differently in channels E3 and E4. At about 10:10 UT in E3 and E4, the
60◦PA electron fluxes start to gradually increase until about
12:05 UT when they match in intensity to the small PA
elec-trons; however, the 90◦ PA electron fluxes remain low and
recover very quickly at about 12:00 UT. The sharp increase
in 90◦PA electron fluxes is also observed in channels E1 and
E2 at about 12:10 UT and 12:05 UT, respectively, although not as pronounced as in E3 and E4. During the two hour
0 -3 -6 -9 -12 -15 X GSM (Re) 0 -3 -6 -9 -12 -15 Y GSM (Re) 0 -3 -6 -9 -12 -15 X GSM (Re) -5 -4 -3 -2 -1 0 Z GSM (Re)
ISEE 1 & 2 on 3 March 1979 (062), 7-14 UT
7 7 10 10 14 14 7 7 10 10 14 14 ISEE-1 ISEE-2 ISEE-1 ISEE-2
Fig. 3. Orbits of ISEE-1 and 2 projected onto the GSM XY plane (left panel) and XZ plane (right panel) during the time period of 07:00 to
14:00 UT on 3 March 1979 (day 062). IS E E 1: 3 March 1979, E lectrons 100 101 102 103 104 105 106 107 108 F lu x (p a rt icl es cm -2se c -1st e r -1ke V -1) P .A.= 15o P .A.= 30o P .A.= 60o P .A.= 90o E 4x100 E 3x101 E 2x10² E 1x10³ 07:00 08:00 09:00 10:00 11:00 12:00 13:00 14:00 Univers al T ime 0 100 200 300 400 500 AE In d e x
Fig. 4. Top panel displays the pitch angle flux distributions for electron channels E1 (22.5–39 keV), E2 (39–75 keV), E3 (75–120 keV),
E4 (120–189 keV) observed by ISEE-1 for the time period of 07:00–14:00 UT. Pitch angles of 15◦±5◦, 30◦±5◦, 60◦±5◦, 90◦±5◦were
sampled. Bottom panel is the AE index vs. time.
period of 10:00–12:00 UT, the butterfly distributions appear most apparent in channels E2, E3, and E4, where the flux of the small PA electrons is seen to be almost an order of
magnitude greater than that of the 90◦PA electrons. The
dif-ference between the large and small PA electron fluxes is not as great in channel E1, but it is still responsible for the
butter-flies observed in E1. After 12:15 UT, the electron fluxes then proceeded to isotropically decrease by more than two orders of magnitude for all energy channels.
E1 9:51:08j E2 9:51:08j E3 9:51:08j
E1 9:38:21k E2 9:38:21k E3 9:38:21k
E1 9:04:17k E2 9:04:17k E3 9:04:17k
E1 9:59:39j E2 9:59:39j E3 9:59:39j
ISEE 1 Electrons 3 March 1979
180 150 120 90 60 30 0 180 150 120 90 60 30 0 180 150 120 90 60 30 0 180 150 120 90 60 30 0 270 0 90 180 270 0 90 180 270 0 90 180 270 0 90 180 270 0 90 180 270 0 90 180 270 0 90 180 270 0 90 180 270 0 90 180 270 0 90 180 270 0 90 180 270 0 90 180 ISEE 1 Spacecraft Log Flux (Particles/(cm 2 *sec *ster)) 4.07 3.77 3.46 3.15 2.84 2.53 2.22 1.92 1.61 1.30 0.00
Fig. 5. The 3-D electron PADs for channels E1, E2, and E3 (three columns) at four different times (four rows for 09:04:17, 09:38:21,
09:51:08, and 09:59:39 UT, respectively).
The unusual PADs are more evident in Fig. 5 that shows the electron PADs for channels E1, E2, and E3 at four dif-ferent times within the period of 09:04-10 UT. These 3-D data are plotted in the mercator projection of the unit sphere scanned in 36.5 s by ISEE-1 and illustrated in Fig. 1. The three columns represent three different energy channels (E1,
E2, and E3), while the four rows represent four different indicated times. An isotropic distribution in all three en-ergy channels was observed at 09:04:17 UT (the first row of Fig. 5). Later at 09:38:21 UT, each channel had a differ-ent PAD; that is, while the E2 channel remained isotropic,
ISEE 1: 3 March 1979, Protons 07:00 08:00 09:00 10:00 11:00 12:00 Universal Time 100 101 102 103 104 105 106 107 108 Flux (particles cm -2sec -1ster -1keV -1) P.A.= 15o P.A.= 30o P.A.= 60o P.A.= 90o P4x100 P3x101 P2x102 P1x103 13:00 14:00
Fig. 6. Pitch angle flux distributions for protons in the energy channels P1 (24.0–44.5 keV), P2 (44.5–65.3 keV), P3 (65.3–95.5 keV), P4
(95.5-142.0 keV) recorded by ISEE-1. Pitch angles of 15◦±5◦, 30◦±5◦, 60◦±5◦, and 90◦±5◦are displayed.
in channel E1 and a butterfly distribution in channel E3 were observed. At 09:51:08 UT (the third row), only two different
distributions: a peaked-at-90◦ in channels E1 and E3, and
still an isotropic distribution in channel E2 were measured. About eight minutes later at 09:59:39 UT, the three different distributions seen in row two were seen in row four but with
much wider butterfly and peaked-at-90◦distributions.
Similar to Fig. 4, Fig. 6 shows the ISEE-1 proton fluxes vs time for four different PAs at 07:00–14:00 UT. Here the butterfly distributions were again observed for an extended period but they were not caused by a sharp decrease of near perpendicular PA fluxes as in the case for the fluxes of the electrons at around 10:00 UT. Small and large PA protons seem to behave isotropically up to about 08:30 UT. At around 08:40 UT, an hour earlier than it was observed in the electron flux distributions, a slightly higher intensity was seen for the
15◦and 30◦PA protons than the 60◦and 90◦PA ones. The
protons seem to behave as three different groups during the
time of interest. The 15◦and 30◦PA protons behave as one
group in all four energy channels with the largest intensities,
while the 90◦PA protons have the lowest intensitiies and the
60◦ PA protons were in between. These variations in the
behavior of the small and large PA protons produce a butter-fly distribution in all four energy channels that persists for a period of about 3 h (09:00–12:00 UT). Unlike the sharp
in-crease in the 90◦ PA electron fluxes at around 12:05 UT, a
steady increase in the flux for these large PA protons brings the distribution back to isotropic at around 12:15 UT.
Similar to Fig. 5, Fig. 7 shows an angle/angle plot for four different times (10:01:28, 10:41:01, 11:20:33, and
11:52:11 UT) for P1, P2, P3, and P4. A clear butterfly PAD
with a minimum proton intensity at 90◦PA can be seen in all
four proton energy channels.
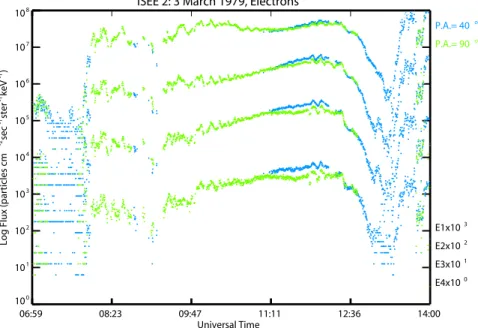
ISEE-2 data demonstrating the butterfly PADs is presented in Fig. 8 which shows the electron flux distributions
through-out the time period for 2 different pitch angles: 90◦±5◦and
40◦±5◦. Due to the operational mode of the instrument
dur-ing the time period studied, data for small PA particles were not available. The butterfly distributions were seen to appear around 11:00 UT, one hour later from when they were ob-served by the ISEE-1 satellite. The butterfly distributions in this case were produced similar to those observed in the pro-tons seen by ISEE-1. Rather than a sharp decrease in near
perpendicular PA particles, the flux in the 40◦PA electrons
was seen to continue to increase after a leveling off in the 90◦
PA electron flux. Similar to the ISEE-1 electron PADs, the distribution returned to isotropic around 12:00 UT, and con-tinued to isotropically decrease for over two orders of mag-nitude. The proton PADs showed no butterflies in the data collected by ISEE-2 (Fig. 9) but this could be due to a lim-itation of the ISEE-2 WAPS sensor to observe small pitch angles.
Figure 10 shows the magnetic field values recorded by each satellite (solid lines) and modeled by the T04 (Tsy-ganenko and Fairfield, 2004) magnetic field model (dashed lines) during the time interval of interest. It is observed that no significant variations happened in the total magnetic field
P1 11:20:33k P2 11:20:33k P3 11:20:33k
P1 10:41:01j P2 10:41:01j P3 10:41:01j
P1 10:01:28k P2 10:01:28k P3 10:01:28k
P1 11:52:11k P2 11:52:11k P3 11:52:11k
ISEE 1 Ions 3 March 1979
180 150 120 90 60 30 0 180 150 120 90 60 30 0 180 150 120 90 60 30 0 180 150 120 90 60 30 0 270 0 90 180 270 0 90 180 270 0 90 180 270 0 90 180 270 0 90 180 270 0 90 180 270 0 90 180 270 0 90 180 270 0 90 180 270 0 90 180 270 0 90 180 270 0 90 180 ISEE 1 Spacecraft Log Flux (Particles/(cm 2 *sec *ster)) 3.50 3.25 3.00 2.75 2.50 2.25 2.00 1.75 1.50 1.25 0.00 P4 10:01:28k 270 0 90 180 P4 10:41:01j 270 0 90 180 P4 11:20:33k 270 0 90 180 P4 11:52:11k 270 0 90 180
Fig. 7. The 3-D proton PADs for channels P1, P2, P3, and P4 (four columns) at four different times (four rows for 10:01:28, 10:41:01,
11:20:33, and 11:52:11 UT, respectively).
4 Trajectory generator
By integrating Newton’s second law with the Lorentz force using a code developed at Boston University by Sullivan (2002) known as TRAJGEN, one can obtain the trajectory of a charged particle in the presence of an electromagnetic field. When integrating the equations of motion, the magnetic and electric field values for the specific points are required. In the TRAJGEN program, currently the electric field can be modeled either as a uniform (possibly null) field or as the planar E3 model proposed by McIlwain (1974). The
mag-netic field models available are the planar M2 model also pro-posed by McIlwain (1974), a tilted-enhanced-image dipole, and the T96 model of Tsyganenko (1996). The TRAJGEN has been used before for 200 keV proton tracing (Fritz et al., 2000), showing a connection between the nightside plasma sheet and the dayside high-altitude cusp by the proton drift path.
From about 09:10:00 UT to 11:50 UT (between two ver-tical lines in Fig. 4) on 3 March 1979, the AE index was less than 100 nT (bottom panel of Fig. 4), indicating a ge-omagnetically quiet period. Previously, Kosik (1979) had
ISEE 2: 3 March 1979, Electrons 06:59 08:23 09:47 11:11 12:36 14:00 Universal Time 100 101 102 103 104 105 106 107 108 Log Flux (particles cm -2sec -1ster -1keV -1) P.A.= 40o P.A.= 90o E4x100 E3x101 E2x102 E1x103
Fig. 8. ISEE-2 electron intensity as a function of time in the channels E1 (17.5–28 keV), E2 (28–38 keV), E3 (38–48 keV), and E4 (48–
62 keV) observed at 07:00–14:00 UT on 3 March 1979. The pitch angles displayed are 40◦±5◦and 90◦±5◦.
ISEE 2: 3 March 1979, Protons
06:59 08:23 09:47 11:11 12:36 14:00 Universal Time 100 101 102 103 104 105 106 107 108 Log Flux (particles cm -2sec -1ster -1keV -1) P.A.= 40o P.A.= 90o P4x100 P3x101 P2x102 P1x103
Fig. 9. ISEE-2 proton intensity as a function of time in the channels P1 (17.5–28 keV), P2 (28–38 keV), P3 (38–48 keV), and P4 (48–62 keV)
observed at 07:00–14:00 UT on 3 March 1979. The pitch angles displayed are 40◦±5◦and 90◦±5◦.
reported that during a magnetically quiet period the convec-tion electric field is very weak and the magnetic field asym-metry produces the dominant effect. Sibeck et al. (1987) fur-ther showed that compared to gradient and curvature drifts the electric drifts are negligible for the >25 keV particles. Therefore, for the present particle trajectory traces, an E=0 electric field was assumed along with the T96 model. The
main use of the TRAJGEN is for tracing particle trajectories forward or backward in time. The momentum of the particle is strictly conserved. For tracing backward one must sim-ply give an electron an initial positive charge, and this will cause the electron to drift west rather than east. Similarly with the proton, a negative charge will cause it to drift east rather than west. Figure 11 shows a sample run, in which
−50 −40 −30 −20 −10 Bx (nT)
ISEE−1 and ISEE−2 Magnetic Data from 7:00 to 13:00 (UT) 3 March 1979
−60 −50 −40 −30 −20 −10 0 By (nT) −10 0 10 20 30 Bz (nT) 7:00 8:00 9:00 10:00 11:00 12:00 13:00 20 40 60 80 B total (nT) Time (UT) ISEE−1 (T04) ISEE−1 (Observed) ISEE−2 (T04) ISEE−2 (Observed)
Fig. 10. Local magnetic field (BX, BY, BZ, and BT) data recorded by the magnetometer onboard ISEE-1 (red solid line) and ISEE-2 (blue solid line) and modeled by the T04 geomagnetic field model at ISEE-1 (red dashed line) and ISEE-2 (blue dashed line) locations during 07:00–13:00 UT on 3 March 1979.
a proton was started at the dayside equator 5 RE from the
Earth and was given a negative charge to trace the particle to its source. The date of 3 March 1979 was picked and the required parameters were obtained for the T96 model. The right bottom provides the information entered for the run. In the first plot of the XZ coordinates, the bounce motion of the particle can be observed. This bounce motion characteris-tic of a parcharacteris-ticle’s trajectory is better observed in the second (YZ) plot, where a bounce motion as well as a drift motion around the Earth can be clearly seen. The drift however is better seen on the third plot in the XY plane with the Sun in the positive X direction (GSM coordinates). The particle is clearly seen to have drifted westward in order to arrive at its observed destination. The fourth panel shows the particle’s location off of the equatorial plane as a function of time. This provides us with a look at the bounce motion as a function of
time. Figure 12 provides more insight from the selected run. Panel 1 (top left) shows the pitch angle of the particle as a function of time. As the particle bounces between the mir-ror points, the particle’s pitch angle varies from its max and min values alternately as it crosses the equator. The right panel shows a close up of this plot. The middle panel shows the particle’s first adiabatic invariant as a function of time, a quantity that should remain constant, and finally the bottom panel shows the absolute value of the magnetic field along the trajectory where the maximum magnetic field associated with the mirror point should remain constant as it appears to do in the panel. This example of a 100 keV proton drifting
completely around the Earth returning to its origin at 5 REin
60 min illustrates the capability of the TRAJGEN code and the lack of a build-up of errors.
Fig. 11. Example of TRAJGEN code proton trace-back. The trajectory of the particle is plotted in the GSM (a) X-Z (b) Y-Z (c) X-Y planes
as well as (d) Z vs. time. The text box provides information about the run.
Fig. 12. Continued example of TRAJGEN run for the proton particle of Fig. 11. The pitch angle of the particle and its first adiabatic invariant
are both plotted as a function of time. The magnitude of the magnetic field (as calculated using the T96 model) is also plotted versus time. A close up of the pitch angle of the particle versus time for the first 12 min is also plotted.
-15 -10 -5 0 5 10 X (GSM), Re -20 -10 0 10 Y (GSM), Re -15 -10 -5 0 5 10 X (GSM), Re -20 -10 0 10 Y (GSM), Re -15 -10 -5 0 5 10 X (GSM), Re -20 -10 0 10 Y (GSM), Re -15 -10 -5 0 5 10 X (GSM), Re -20 -10 0 10 Y (GSM), Re -15 -10 -5 0 5 10 X (GSM), Re -20 -10 0 10 Y (GSM), Re -15 -10 -5 0 5 10 X (GSM), Re -20 -10 0 10 Y (GSM), Re -15 -10 -5 0 5 10 X (GSM), Re -20 -10 0 10 Y (GSM), Re -15 -10 -5 0 5 10 X (GSM), Re -20 -10 0 10 Y (GSM), Re -15 -10 -5 0 5 10 X (GSM), Re -20 -10 0 10 Y (GSM), Re -15 -10 -5 0 5 10 X (GSM), Re -20 -10 0 10 Y (GSM), Re -15 -10 -5 0 5 10 X (GSM), Re -20 -10 0 10 Y (GSM), Re -15 -10 -5 0 5 10 X (GSM), Re -20 -10 0 10 Y (GSM), Re
Ion Particle Tracebacks
90o 60o 30o 15o 200 keV 100 keV 50 keV
Fig. 13. TRAJGEN trace back of protons from the location of the ISEE-1 satellite at 10:00 UT on 3 March 1979. The trace backs are plotted
in the GSM X-Y plane. The protons were plotted for four different pitch angles: 15◦, 30◦, 60◦, and 90◦and with three different energies:
50 keV, 100 keV, and 200 keV.
Figure 13 shows the XY (in GSM) panel obtained from a number of TRAJGEN runs for protons starting at the loca-tion of the ISEE-1 satellite at 10:00 UT on 3 March 1979. The protons were given a negative charge in an attempt to try to determine where the high-energy particles are coming from. The code was run for protons with four different pitch
angles: 15◦, 30◦, 60◦, 90◦displayed left-to-right in columns
from large to small pitch-angle, and with three different ener-gies: 50, 100, and 200 keV, displayed in rows in descending energy order. TRAJGEN shows the collective behavior of the particles. For all of the different energies, the large PA
(60◦and 90◦) particles seem to encounter the morningside
magnetopause, suggesting open drift paths. The small PA particles are seen to drift all the way around to the earth’s dayside, indicating closed drift paths. Of particular interest is Fig. 14 that plots the same particle trajectories as in Fig. 13 but for the GSM XZ plane. In addition to the open vs. closed drift paths shown in Fig. 13, there is a feature that the pro-tons with small PA pass through the northern high-altitude and high-latitude dayside region (cusp), while those protons with large PA are connected to the high-latitude morningside magnetopause. These runs trace-back a particle to determine its origins. The trace-backs of the different energy protons argue that their source and entry into the plasma sheet is at the dayside northern high-altitude and high-latitude region.
5 Implications
5.1 Drift effects
A detailed inspection of the top panel in Fig. 4 reveals two effects after 09:14 UT on 3 March 1979. The first effect was the energy dispersion signature that higher energy elec-tron flux was detected earlier. The second effect was the
electron fluxes with a PAD peaking at 90◦ were observed
first at 09:14 UT, then followed by a butterfly PAD after 10:00 UT. The energy dispersion suggests a transport ef-fect from the particle source, since higher energy particles travel faster. The second effect suggests a drift process. Be-cause the large PA charged particles in the closed geomag-netic field lines drift faster than the small PA particles, they will be detected first along the drift path following a parti-cle injection, while the small PA partiparti-cles will be observed later (e.g., Konradi et al., 1973). The energy dispersion was also observed at 12:00–12:10 UT (see both the valley and
peak of the 90◦electron fluxes for different energies in the top
panel of Fig. 4). The separation from an isotropic electron PAD started at about 09:14 UT and ended at about 12:10 UT. The above observation thus suggests that from 09:14 UT to 12:10 UT the energetic electrons (E1–E4) measured by ISEE-1 were in a drift process.
-15 -10 -5 0 5 10 X (GSM), Re -6 -4 -2 0 2 4 6 8 Z (GSM), Re -15 -10 -5 0 5 10 X (GSM), Re -6 -4 -2 0 2 4 6 8 Z (GSM), Re -15 -10 -5 0 5 10 X (GSM), Re -6 -4 -2 0 2 4 6 8 Z (GSM), Re -15 -10 -5 0 5 10 X (GSM), Re -6 -4 -2 0 2 4 6 8 Z (GSM), Re -15 -10 -5 0 5 10 X (GSM), Re -6 -4 -2 0 2 4 6 8 Z (GSM), Re -15 -10 -5 0 5 10 X (GSM), Re -6 -4 -2 0 2 4 6 8 Z (GSM), Re -15 -10 -5 0 5 10 X (GSM), Re -6 -4 -2 0 2 4 6 8 Z (GSM), Re -15 -10 -5 0 5 10 X (GSM), Re -6 -4 -2 0 2 4 6 8 Z (GSM), Re -15 -10 -5 0 5 10 X (GSM), Re -6 -4 -2 0 2 4 6 8 Z (GSM), Re -15 -10 -5 0 5 10 X (GSM), Re -6 -4 -2 0 2 4 6 8 Z (GSM), Re -15 -10 -5 0 5 10 X (GSM), Re -6 -4 -2 0 2 4 6 8 Z (GSM), Re -15 -10 -5 0 5 10 X (GSM), Re -6 -4 -2 0 2 4 6 8 Z (GSM), Re
Ion Particle Tracebacks 90o 60o 30o 15o 200 keV 100 keV 50 keV
Fig. 14. Similar as in Fig. 13, but plotted in the X-Z plane.
Table 1. The IMF (in GSE) and solar wind pressure on 3 March
1979. UT Bt(nT) Bx(nT) By(nT) Bz(nT) Pressure(nPa) 04:00 6.5 5.7 –2.0 2.4 1.36 05:00 6.4 4.5 –2.5 1.0 1.47 06:00 6.4 2.6 –5.3 –1.6 1.73 07:00 6.3 4.2 –4.1 1.4 1.62 08:00 6.2 4.1 –3.7 1.1 1.68 09:00 6.6 5.2 –2.2 3.1 1.55 10:00 6.7 5.4 –1.3 3.4 1.59 11:00 6.8 4.3 –0.5 4.7 1.69 12:00 6.5 1.8 –5.0 –2.3 1.77
The case is different for energetic protons measured by ISEE-1. In Fig. 6, the separation from an isotropic pro-ton PAD started at about 08:30 UT for P1–P3, and at about 09:00 UT for P4, earlier than for the electrons. There were two additional different features at 08:30–09:00 UT: (1) no
obvious energy dispersion and (2) no peak at 90◦PAD were
observed except for P3–P4 at about 8:35 UT when the peak
flux of the 90◦ PA protons was detected earlier than that
of the P1–P2 large PA protons. The energy dispersion sig-nature was observed only at 12:00–12:10 UT for small PA proton fluxes. Compared with the electron drift signatures (Fig. 4) the proton observations with no obvious energy
dis-persion (Fig. 6) imply that the drift paths that connected to the charged particle source were much shorter than those of electrons measured by ISEE-1. In other words, the protons at ISEE-1 location were much closer to the particle source than electrons along their trajectoties.
On the other hand, both Figs. 4 and 6 show that around 08:30 to 09:00 UT on 3 March 1979, ISEE-1 detected a pro-ton population that has been affected by encountering the magnetopause as it was drifting toward the spacecraft. Due to drift directions the magnetopause was closer for the proton population than it was for electrons. Shortly after that (about 09:30–10:00 UT) electrons showed activity that had a signa-ture of injection followed by both energy and pitch angle dis-persion. Both the injection and the depth of the butterflys are energy dependent. The varying depth of the butterflys may be in part due to an energy dependent radial gradient in the electron population acting as a source for the ISEE observa-tions. Of interest is the fact that both the electron (top panel of Fig. 4) and proton (Fig. 6) populations return to their pre-vious isotropic distributions at basically the same time, about 12:15 UT, suggesting the crossing of a particle boundary of some kind. Table 1 lists the hourly interplanetary magnetic field (IMF) data in geocentric solar ecliptic (GSE) coordi-nates and the solar wind pressure from the OMNI data set. It shows that there were two southward turnings in the IMF at 06:00 UT and 12:00 UT on 3 March, 1979, each may usher in substorm activity. The AE index (bottom panel of Fig. 4)
showed an abrupt increase at about 11:50 UT. It increased from about 60 nT to 120 nT in 5–7 min, (not substorm activ-ity, but geomagnetic activity), about 10 min before the but-terfly PADs disappear completely. Since both the ISEE-1 trajectory and the local magnetic field did not change drasti-cally at 11:50 UT, the increase in the AE may probably in-dicate a change in the magnetospheric configuration and dis-connected ISEE-1 from the particle source, thus ending the butterfly PADs.
5.2 A new particle source
Magnetopause shadowing with magnetic field drift shell splitting have been used to explain the butterfly PADs before (e.g., West et al., 1972, 1973). At the location of ISEE-1
during the period of interest, the 90◦PA charged particles
near the geomagnetic equator were more likely on open drift paths than small PA particles to intercept the magnetopause and were lost to the magnetosheath. Since this mechanism is independent of particle energy, the butterfly shape (the differ-ence in flux between small PA and large PA particles) should be similar if there is no new particle source. However, the top panel of Fig. 4 shows that the difference in flux between small PA and large PA electrons at 09:00–12:00 UT for E1 was much less than that for E3 and E4, suggesting there was a new particle source to supply continually the E1 (also E2)
90◦electrons at the time. Furthermore, since the local
mag-netic field measured by ISEE-1 was almost constant during
07:00–12:00 UT, the 90◦PA charged particle (both proton
and electron) intensities over the same energy range should be very close between 07:30 UT and 09:00–12:00 UT if there was no new source of particles. The measured higher fluxes for P1–P4 (Fig. 6) and for E1–E2 (Fig. 4) at 09:00–12:00 UT also suggest a new particle source.
This new particle source is not the substorm. In addition to the AE index being below 100 nT for the period 09:10– 11:50 UT (40 nT at 10:00 UT) (see bottom panel of Fig. 4), the LANL geosynchronous satellites observed no substorms (no particle injections). It is really surprising that ISEE-1 measured up to three orders of magnitude enhancements of the energetic charged particles, while no substorms were
observed at geostationary altitudes. The charged particle
drift effects discussed in last subsection also argue against a nightside particle source within the local time interval from 18:00 MLT to 03:00 MLT. The particle trajectory tracings shown in Sect. 4 suggest that this new particle source is lo-cated in the northern high-altitude and high-latitude (Fig. 14) morningside (Fig. 13) region, which is consistent with the drift effect observations aforementioned.
5.3 Cusp source
In 1996, MeV charged particles were detected in the day-side high-altitude cusp region (Chen et al., 1997, 1998; Chen and Fritz, 1998; Sheldon et al., 1998). These cusp energetic
particles (CEP) with energies from 20 keV up to 10 MeV were found to be associated with large diamagnetic cavi-ties and strong magnetic field turbulence. These cusp dia-magnetic cavities are always there day after day and are as
large as 6 RE under normal solar wind conditions (Fritz et
al., 2003b). The intensities of the CEPs have been observed to increase by as much as four orders of the magnitude when compared with regions adjacent to the cusp, indicating that the high-altitude dayside cusps (both northern and southern) are extremely dynamic regions in geospace (Chen and Fritz, 2005; Chen et al., 2005). The cusp magnetic field lines are connected with the entire magnetopause boundary lay-ers, so that the CEPs, as a new particle source, may transport particles into the magnetopause, form an energetic particle layer there, and contribute to the nightside particle popula-tions through charged particle drifting (Fritz and Chen 1999; Chen and Fritz, 2002).
The connection between the cusp and the nightside geo-magnetic tail has been suggested long ago based upon two off-equatorial field minima in the high-altitude dayside cusps caused by solar wind pressure (Mead, 1964; Shabansky and Antonova, 1968; Shabansky, 1971). The connection between cusp particles and nightside particles through their drift paths has been showed by numerical simulations using different tracing codes (Delcourt and Sauvaud, 1999; Blake, 1999; Fritz et al., 2000; Antonova et al., 2000).
Table 1 indicates that from 07:00 UT to 12:00 UT on
3 March 1979, the IMF had a negative By(dawnward)
com-ponent. According to the prediction of the current MHD
models a negative IMF Bywould move the dayside northern
cusp dawnward into morningside (e.g., Cowley et al., 1991; Crooker et al., 1998). Recent in situ satellite observations indicate that almost all POLAR cusp crossiongs were identi-fied as CEP events (Fritz et al., 2003b; Chen and Fritz, 2005). Since ions drift westward and electrons drift eastward, the protons measured by ISEE-1 at 03:00 MLT would be much closer to the morningside particle source than that of elec-trons. Therefore, a cusp particle source in the northern high-altitude and high-latitude morningside agrees with both the drift effect observations and the particle trajectory tracings.
6 Conclusions
From 07:00 UT to 14:00 UT on 3 March 1979, both ISEE
satellites were inbound from beyond 15 RE to about 10 RE
at 03:00 MLT, and observed unusual energetic particle PADs. Our principal conclusions are the following:
(1) ISEE-1 observed a butterfly PAD for a period of about 2 h (10:00–12:00 UT) for the electrons, and 3 h (09:00– 12:00 UT) for the protons.
(2) The small PA (15◦, 30◦) charged particles (electrons and
protons) were seen to behave collectively in all four en-ergy ranges. The relative differences in electron fluxes
between 15◦PA and 90◦PA were more significant for
higher energy channels during the butterfly PAD period (about 10:00–12:00 UT).
(3) Three different types of electron PADs (butterfly,
isotropic, and peaked-at-90◦) were observed at the same
location and time as a function of energy.
(4) Electron butterfly PADs were also observed by the ISEE-2 for about 1.5 h, although less well resolved than ISEE-1. Unlike the ISEE-1, no butterfly distributions were resolved in the ISEE-2 proton PADs due to less angular resolution of the ISEE-2 energetic particle in-strument.
(5) More obvious drift effects were measured by ISEE-1 at 03:00 MLT for electrons than for the protons, sug-gesting that the measured electrons were much further away than the protons from the particle source along their drift paths. This ruled out a nightside source within 18:00 MLT to 03:00 MLT.
(6) No obvious substorms were detected during the period 09:10–11:50 UT.
(7) The results (5) and (6) reveal that the measured charged particle fluxes were due to a new particle source other than the substorm source.
(8) Particle trajectory tracings show that the 50–200 keV protons with small PA at the ISEE-1 location at 10:00 UT on 3 March 1979 were passing through the northern high-altitude and high-latitude morningside re-gion, while those protons with large PA were connected to the high-latitude morningside magnetopause. (9) It is possible that the cusp particle source is responsible
for the all particles observed during the event.
Acknowledgements. We thank both referees for their very helpful,
detailed, and important comments and suggestions. We would like to knowledge the efforts and discussions with J. D. Sullivan of Boston University regarding the particle tracing code, TRAJGEN. We also thank M. M. Klida and N. M. Lender for assistance in plot-ing Figs. 4 and 10. The work of D. L. Matthews in the recovery of the ISEE-1 and 2 energetic particle data and the Principal Investi-gators, D. J. Williams of the Medium Energy Particle Experiment (MEPE) and C. T. Russell of the magnetic field experiment (MFE) are also gratefully acknowledged along with the Institute of Geo-physics and Planetary Physics at UCLA for providing the magnetic field data collected by ISEE-1 and ISEE-2. The Satellite Situation Center Website (SSCWeb) for the satellite’s trajectory during the time of the event is acknowledged also.
Topical Editor T. Pulkkinen thanks two referees for their help in evaluating this paper.
References
Antonova, A. E., Gubar, Yu. I., and Kropotlin, A. P.: Energetic particle population in the high-latitude geomagnetosphere, Phys. Chem. Earth (C), 25(1-2), 47–50, 2000.
Blake, J. B.: Comment on “Cusp: A new acceleration region of the magnetosphere” by J. Chen et al., Czech. J. Phys., 49(4a), 675–677, 1999.
Chen, J. and Fritz, T. A.: Correlation of cusp MeV helium with turbulent ULF power spectra and its implications. Geophys. Res. Lett., 25, 4113–4116, 1998.
Chen, J. and Fritz, T. A.: The global significance of the CEP events, in Solar-Terrestrial Magnetic Activity and Space Environment, edited by: Wang, H. N. and Xu, R. L., COSPAR Colloquia Se-ries, 14, 239–249, 2002.
Chen, J. and Fritz, T. A.: High-altitude cusp: The extremely dy-namic region in geospace, in The Magnetospheric Cusps: Struc-ture and Dynamics, edited by: Fritz, T. A. and Fung, S. F., Sur-veys in Geophysics, 26:1-3, 71–93, 2005.
Chen, J., Fritz, T. A., and Sheldon, R. B.: Comparison of ener-getic ions in cusp and outer radiation belt, J. Geophys. Res., 110, A12219, doi:10.1029/2004JA010718, 2005.
Chen, J., Fritz, T. A., Sheldon, R. B., et al.: A new, temporarily con-fined population in the polar cap during the August 27, 1996 ge-omagnetic field distortion period. Geophys. Res. Lett., 24, 1447– 1450, 1997.
Chen, J., Fritz, T. A., Sheldon, R. B., et al.: Cusp energetic par-ticle events: Implications for a major acceleration region of the magnetosphere, J. Geophys. Res., 103, 69–78, 1998.
Cowley, S. W. H., Morelli, J. P., and Lockwood, M.: Dependence of convective flows and particle precipitation in the high-latitude dayside ionosphere and the X and Y components of the interplan-etary magnetic field, J. Geophys. Res., 96, 5557–5564, 1991. Crooker, N. U., Lyon, J. G., and Fedder, J. A.: MHD model merging
with IMF By: Lobe cells, sunward polar cap convection, and overdraped lobes, J. Geophys. Res., 103, 9143–9152, 1998. Delcourt, D. C. and Sauvaud, J.-A.: Populating of the cusp and
boundary layers by energetic (hundreds of keV) equatorial parti-cles, J. Geophys. Res., 104, 22 635–22 648, 1999.
Eccles, A. A. and Fritz, T. A.: Energetic particle observations at the subsolar magnetopause, Ann. Geophys., 20, 445–460, 2002, http://www.ann-geophys.net/20/445/2002/.
Fritz, T. A. and Chen, J.: The cusp as a source of magnetospheric particles, Radiation Measurements, 30(5), 599–608, 1999. Fritz, T. A., Chen, J., Sullivan, J. D., and Karra, M.: Is the
cusp a source or a sink for magnetospheric energetic particles?, Proc. Int. Symposium: From solar corona through interplane-tary space, into Earth’s magnetosphere and ionosphere: Interball, ISTP satellites, and ground-based observations, (Kyiv, Ukraine), 205–209, 2000.
Fritz, T. A., Alothman, M., Bhattacharjya, J., Matthews, D. L., and Chen, J.: Butterfly Pitch-angle Distributions Observed by ISEE-1, Planetary and Space Sciences, 51, 205–219, 2003a. Fritz, T. A., Chen, J., and Siscoe, G. L.: Energetic ions, large
dia-magnetic cavities, and Chapman-Ferraro cusp, J. Geophys. Res., 108(A1), 1028–1036, 2003b.
Konradi, A., Williams, D. J., and Fritz, T. A.: Energy spectra and pitch angle distributions of storm-time and substorm injected protons, J. Geophys. Res., 80, 543–552, 1975.
mo-tion and electron fluxes at synchronous altitudes, in Quantitative Modeling of Magnetospheric Processes, edited by: Olson, W. P., Geophys. Monogr. Series, 21, 569–581, 1979.
Mead, G. D.: Deformation of geomagnetic field by the solar wind, J. Geophys. Res., 69, 1181–1195, 1964.
McIlwain, C. E.: Coordinates for mapping the distribution of mag-netically trapped particles, J. Geophys. Res., 66, 3681–3691, 1961.
McIlwain, C. E.: Substorm injection boundaries in Magnetospheric Physics, edited by: McCormac, B. M., D. Reidel, Dordrecht, Holland, 1974.
Pfitzer, K., Lezniak, T. W., and Winckler, J. R.: Experimental veri-fication of drift shell splitting in the distorted magnetosphere, J. Geophys. Res., 74, 4687–4693, 1969.
Reeves, G. D., R. D. Belian, R. D., and Fritz, T. A.: Numerical tracing of energetic particle drifts in a model magnetosphere, J. Geophys. Res., 96, 13 997–14 008, 1991.
Roederer, J. G.: On the adiabatic motion of energetic particles in a model magnetosphere, J. Geophys. Res., 72, 981–992, 1967. Roederer, J. G.: Dynamics of Geomagnetically Trapped Radiation,
Springer-Verlag, New York, 23–28, 1970.
Russell, C. T.: The ISEE1 and 2 fluxgate magnetometers, IEEE Trans. Geosci. Electr., GE-16, 239–242, 1978.
Shabansky, V. P.: Some processes in the magnetosphere, Space Sci. Rev., 12, 299–418, 1971.
Shabansky, V. P. and Antonova, A. E.: Topology of particle drift shells in the Earth’s magnetosphere, Geomangn. Aeron., 8, 993– 997, 1968.
Sheldon, R. B., Spence, H. E., Sullivan, J. D., Fritz, T. A.,and Chen, J.: The discovery of trapped energetic electrons in the outer cusp, Geophys. Res. Lett., 25, 1825–1828, 1998.
Sibeck, D. G., McEntire, R. W., Lui, A. T. Y., Lopez, R. E., and Krimigis, S. M.: Magnetic field drift shell splitting: Cause of unusual dayside particle pitch angle distributions during storms and substorms, J. Geophys. Res., 92, 13 485–13 497, 1987.
Smets, R., Delcourt, D., Sauvard, J. A., and Koperski, P.: Electron pitch angle distributions following the dipolarization phase of a substorm: Interball-Tail observations and modeling. J. Geophys. Res. 104, 14 571–14 581, 1999.
Sullivan, J. D.: Hunstsville 2000 conference proceedings CDROM Software Section Models: TRAJGEN at http://science.msfc. nasa.gov/ssl/pad/sppb/workshop7/html/cd.htm, 2002.
Tsyganenko, N. A. and Usmanov, A. V.: Determination of the mag-netospheric current system parameters and development of ex-perimental geomagnetic field models based on data from IMP and HEOS satellites, Planet. Space Sci., 30, 985–998, 1982. Tsyganenko, N. A.: Modeling the Earth’s magnetospheric magnetic
field confined within a realistic magnetopause. J. Geophys. Res., 100, 5599–5612, 1996.
Tsyganenko, N. A. and Fairfield, D. H.: Global shape of the mag-netotail current sheet as derived from Geotail and Polar data, J. Geophys. Res., 109, A03218, doi:10.1029/2003JA010062, 2004. West Jr., H. I.: Some Observations of the trapped electrons pro-duced by the Russian high altitude nuclear detonation of Octo-ber 28, 1962, Radiation Trapped in the Earth’s Magnetic Field, edited by: McCormac, B. M., D. Reidel Publishing Company, Dordrecht, Holland, 634, 1965.
West Jr., H. I., Buck, R. M., and Walton, J. R.: Shadowing of elec-tron azimuthal drift motions near the noon magnetopause, Nature Phys. Sci., 240, 6–7, 1972.
West Jr., H. I., Buck, R. M., and Walton, J. R.: Electron pitch an-gle distributions of energetic electrons throughout the magneto-sphere as observed by OGO-5. J. Geophys. Res. 78, 1064–1081, 1973.
Williams, D. J., Keppler, E., Fritz, T. A., Wilken, B., and Wib-berenz, G. W.: The ISEE-1 and 2 medium energy particles ex-periment, IEEE Trans. Geosci. Electr., GE-16, 270–278, 1978.