Design and Construction of a Helmholtz Coil Apparatus for Nanoparticle Heating
by
Jessica A. Eisenstein
Submitted to the Department of Mechanical Engineering
May 12, 2006, in partial fulfillment of the requirements for the Degree of Bachelors of Science
at the
Massachusetts Institute of Technology May 2006
C 2006 Jessica A. Eisenstein. All rights reserved
The author hereby grants to MIT permission to reproduce and to distribute publicly paper and electronic copies of this thesis document in whole or in part in any medium now
known or hereafter created.
I
Signature of Author...
Department of Mechanical Engineering May 12, 2006
C er tified by ... ...
Kimberly Hamad-Schifferli Assistant Professor of Mechanical Engineering
vimot
_Thesis
y
Supervisor
Accepted by ... ...
John H. Lienhard V Chairman, Undergraduate Thesis Committee
S SFMT LOGY RIES MASSACHUSETT OF TECHN AUG 0 2 LIBRAF
Design and Construction of a Helmholtz Coil Apparatus for
Nanoparticle Heating
by
JESSICA A. EISENSTEIN
Submitted to the Department of Mechanical Engineering
May 12, 2006, in partial fulfillment of the requirements for the Degree of Bachelors of Science in Mechanical Engineering
ABTRACT
Manipulating biomolecules can lead to better understanding how specific biological components function and can result in new therapeutic techniques. Biomolecules are manipulated by magnetically heating conductive nanoparticles attached to biomolecules within a radio frequency magnetic field generated by a coil. Currently, researchers monitor the effectiveness of this heating with UV/Visible spectroscopy. However, fluorescence spectroscopy would provide a more sensitive and versatile way to monitor the effects of magnetic heating. By using a Helmholtz coil pair, I have successfully created a coil set-up that can manipulate a sample of biomolecules within a fluorometer.
Thesis Supervisor: Kimberly Hamad-Schifferli Title: Assistant Professor of Mechanical Engineering
Table of Contents
Abstract ... ... 3 Table of Contents ... ... 5 List of Figures ... ... 7 List of Tables ... ... 9...Acknowledgements
...
10
1 Introduction
...
...
11
1.1 Hyperthermia ... 11 1.2 Current Technique ... 1...2... 1.3 Thesis Outline ... 1...4... 2 Theory ... 1...5... 2.1 Nanoparticles ... 15 2.2 Induction Heating ... 1...6... 2.3 Uniform Field ... ... 17...2.4 Heating and Cooling ... ... 18
2.5 Fluorescence Spectroscopy ... 19 3 Design Requirements ... 21 3.1 Introduction ... 2...1... 3. 2 Electromagnetic Considerations ... 21 3.3 Heating Considerations ... 22 3.4 Monitoring Considerations ... 23
3.5 Housing and Interface Considerations ... 23
3.6 Interrelated Considerations ... . ... 24
4 Methods ... ... 2...5...
4.1 Introduction ... 2...5...
4.2 Considering Constraints ... ... ... 25
4.3.1 Electromagnetic Design Components ... 26
4.3.2 Heating Design Components ... 27
4.3.3 Monitoring Design Components ... ... 28
4.3.4 Housing and Interface Design Components ... ... 29
4.4 Construction ... 31
4.5 Determining the Field and Characterizing the Coil ... 32
4.6 The Shield ... ... 34
4.7 Positioning ... 35
4.8 Testing ... 36
4.8.1 Current versus Frequency Test ... ... 36
4.8.2 Network Analysis ... ... 38
4.8.3 Air Cooling ... ... ... 39
5 Results ... ... 41
5.1 Current as a Function of Frequency ... 41
5.2 Network Analysis ... 42 5.3 Air Cooling ... ... 44 5.4 Global Heating ... ... ... 45 6 Conclusions ... 47 6.1 Success Level ... 47 6.1.1 Electromagnetic Requirements ... ... 47 6.1.2 Heating Requirements ... ...47 6.1.3 Monitoring Requirements ... ...48
6.1.4 Housing and Interface Requirements ... 48
6.2 Applications ... ... 49
6.3 Future Work ... ... ... 49
References
...
50
Appendix
A ...
...
52
List of FiLgures
1-1 Cross sectional view of a sample during fluorescence spectroscopy ... 13
1-2 a) Solenoid blocking emission and collection path within a fluorometer. b) A Helmholtz coil allows for light to penetrate the sample ... 14
2-1 EMG 705 ... ... ... 15
2-2 Au8-PAMAM cluster ... 16
2-3 Helmholtz coil pair ... 18
2-4 The fluorescence process ... 19
2-5 FRET ... 20
3-1 Helmholtz coil with light paths ... 22
4-1 a) Exploded view of the solid model of coil set-up made using Solid Works. b) Condensed view of set-up ... 26
4-2 a) Exploded view of the cooling chamber. b) Condensed view ... 27
4-3 Condensed view of chamber ... 28
4-4 a) Glass windows enclose the chamber, providing an optically clear path to and from the sample. Plastic casings hold the windows in place. b) The windows and the Helmholtz coil pair provide an optically clear path to excite the sample and collect emitted light ... 28
4-5 Two components comprise the shield: each is to be made from a bent piece of sheet metal ... 9
4-6 a) Exploded schematic of the three components of the system: Coil set-up fits inside of the shield, which fits inside of the fluorometer. b) Condensed
schematic
...
30
4-7 Positioning system ... 30... 30
4-8 Wrapping wire around the post to create a coil ... 31
4-9 Photos of the coil set-up after assembly ... ... ...32 4-10 a) Finite element analysis produced by modeling the Helmholtz coil pair as
resulting magnetic field at the center of the coil pair (Hcenter in amps/m) as
determined by finite element analyses conducted over a range of currents ... 33
4-11 Constructed shield ... 35
4-12 Coil set-up positioned within shield ... ... 36
4-13 Mismatched
impedance
...
..
...
...37
4-14 Schematic of coil versus frequency set-up ... ... 37
4-15 Circuit diagram for coil set-up ... 38
5-1 Current vs. frequency over a range of gains ... 41
5-2 Current flowing through the coil and through the current probe ... 42
5-3 Smith chart values. a) Values taken between 10 KHz and 250 MHz. b) Values taken between 800 MHz and 4 GHz ... 43
5-4 Temperature as a function of time during air cooling ... ... 44
5-5 Results of globally heating EMG 705 ... 45
5-6 Magnetic heating at 233 MHz ... 46
5-7 Fluorescence scan during Au heating ... 46
A-1 One coil of the Helmholtz pair ... 52
A-2 Top view of set-up inside shield ... ... ... 52
A-3 Top view of assembled set-up ... ... ... ... 53
A-4 Set-up during a fluorescence scan ... ... ... 53
B-1 Chamber ... 54
B-2 Coil stands ... 55
B-3 Window
...
...
55
B-4 Bottom of shield ... ... 56
List of Tables
Acknowledgements
I would like to thank all of the members of the Hamad-Schifferli Group for their guidance and instruction over the last year. Specifically, Josh Alper, Vic Lelyweld,
Shahriar Kushrushahi, and Kate Brown have helped me a great deal during my research. Without their help, none of my research would have been possible. I would also like to thank Kim Hamad-Schifferli, my advisor and my friend, for making me feel like I always have a home in her lab.
Chapter 1
Introduction
It has been proposed that radio frequency magnetic fields can be used to
magnetically heat nanoparticles to manipulate biomolecules. Manipulating biomolecules allows individuals to harness the efficiency and precision known to exist within
biomolecular systems and apply these features for engineering purposes. For example, manipulated DNA has the potential to act as an actuator and as a means for performing computations. Manipulated DNA in the form of antisense strands can control gene expression through mRNA binding. If manipulation is applied to protein complexes, enzymatic activity, biomolecular assembly, gene regulation, and protein function could all be controlled [10]. If researchers could accurately and reliably manipulate
biomolecules, they would have the potential to better understand many diseases and create new types of therapies to treat them. While researchers have been able to achieve bio-manipulation, there is still a need for more reliable and more versatile methods of manipulation.
1.1 Hyperthermia
Hyperthermia, a process similar to magnetically heating nanoparticles for bio-manipulation, is currently used as a potential method for treating tumor cells.
Hyperthermia is a form of cancer therapy in which tumors in specific organs or tissues are heated to temperatures between 41 °C and 46°C and burned [7]. In this technique, magnetic nanoparticles are injected near the site of a tumor or targeted to the tumor using antibodies. Similar to magnetically heating nanoparticles, an external magnetic field is applied to generate a temperature rise within the particles. This heat is then transferred to the tumor, damaging it [1]. Hyperthermia has the ability to affect many biomolecules, especially regulatory proteins involved in cell growth, differentiation and the expression of certain receptor molecules due to the DNA damage that occurs during the process [7]. Currently, hyperthermia relies on one type of particle: Iron Oxide. If different types of
particles, which differed in size, material, and heating properties, could be used, there would be greater flexibility in magnetic field heating applications [1]. The concept of hyperthermia provides a basis for many of the concepts employed during
bio-manipulation.
1.2 Current Technique
While researchers understand the benefits of bio-manipulation, they do not yet understand all of the different ways the process can be carried out. They have not fully explored all of the different methods and materials that can be employed for bio-manipulation.
Magnetic heating is one potential method for biomanipulation. The Hamad-Schifferli group has been able to demonstrate that magnetically heating a metal
nanocrystal covalently-bonded to double-stranded DNA can reversibly dehybridize DNA [9]. The group has done work to explore the possibilities of using a range of
nanoparticles for carrying out manipulation [1].
Magnetic heating is carried out using coils to create alternating magnetic fields. Once a magnetic field is generated within a coil, a magnetizable sample can be placed inside of the field, creating a temperature rise within the sample particle. The
temperature rise results from losses created by reorientation during magnetization [13]. The heat in the nanoparticle is then directly transferred to an attached biomolecule, raising its temperature while leaving surrounding molecules unaffected.
The research of K. Hamad-Schifferli is ongoing and I have joined her group to try to improve the effectiveness of the coils used. Currently, solenoids made from tightly wrapped copper wire on the order of 25mm long with a 20mm diameter are being used. They operate at a frequency of about 1 GHz and generate a field of approximately 750 A/m. The coils incorporate some sort of cooling device to prevent non-local heating, an issue that will be discussed in section 3.3.
While the coils have been shown to be successful, there are improvements that still need to be made. Currently, the main method of monitoring whether or not the biomolecule is successfully manipulated is to monitor the activity of the coil within a
UV/Vis spectrophotometer. However, fluorescence spectroscopy is actually a much more versatile and sensitive method of monitoring samples. Fluorophores can be used to label samples, allowing for detection at much lower concentrations--down to pM
concentrations-than are required for UV/Vis spectroscopy.
In order to use fluorescence spectroscopy, the coil and sample set-up must be compatible with a machine called the fluorometer, which conducts fluorescence
spectroscopy. If the coil set-up could fit within a fluorometer, the biomolecular behavior of the sample could be monitored real-time, and on a much more sensitive level than with UV/Vis spectroscopy. However, a normal solenoid cannot be used inside a fluorometer. A fluorometerrequires an optically clear path to the sample for exciting the molecules within the sample. A clear path ninety degrees away from the point where the sample absorbs light is also needed for light collection. Figure 1 shows a cross section of a sample absorbing incident light and emitting light.
Light In
Light Out
Figure 1-1: Cross sectional view of a sample during fluorescence spectroscopy. "Light In" excites the sample and "Light Out" is the emitted light that is collected.
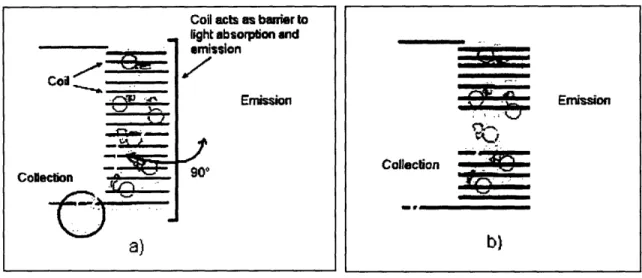
Figure 1-2 shows how a normal solenoid blocks the two paths of light and how a different type of coil, called a Helmholtz coil, would allow for a light path.
Cod--- , .. '
'-Collecfion
In-;') .
-Coil acts as bairier to
liaht absormiarn and
emission Emission 901) a) Emission Collecson _ b)
Figure 1-2: a) Solenoid blocking emission and collection path within a fluorometer. Yellow wavy lines represent the paths of light, the blue tube filled with gold particles represents a biomolecular
sample. b) A Helmholtz coil allows for light to reach the sample and also leave the sample.
My thesis is the construction and analysis of a Helmholtz coil set-up that can operate in a fluorometer to optimize bio-manipulation and allow for fluorescence measurements.
1.3 Thesis Outline
This thesis is organized in the following way: Chapter 2 will describe the theory behind magnetic field heating of nanoparticles. It will introduce the concept of
Helmholtz coils as a means of creating a uniform field for magnetic heating of
nanoparticles. The difference between global and localized heating will be presented in reference to how particles heat. Information supporting fluorescence spectroscopy will also be presented. Chapter 3 will introduce the design requirements that govern the construction of the coil set-up. Electromagnetic, heating, monitoring, housing, interface, and interrelated considerations will all be discussed. Chapter 4 describes the methods used to design, construct, characterize, and test the coil set-up. Chapter 5 presents the results of the characterizations and tests outlined in Chapter 4. Chapter 6 summarizes the conclusions that can be drawn from this research and presents ideas for future work that needs to be done in this area.
X - -~~~~~~~~~~~~~~~~~~~~~~~~~~~~~~~~~~~~~~~~
-Chapter 2
Theory
2.1 Nanoparticles
Magnetizable nanoparticles are the target of the magnetic heating process. Nanoparticles are solids having at least one dimension less than 100nm. They are
produced in solution and, in general, can be made from a variety of materials, though we will just focus on magnetizable materials here. EMG 705, made by Ferrotec, USA, is an example of Iron Oxide nanoparticles (Fe3O4). In solution, these particles have a fairly
uniform size distribution and are well-dispersed throughout the medium, as figure 2-1 b) shows.
Figure 2-1: EMG 705. a) These water soluble particles are magnetizable. b) TEM image of EMG705 (courtesy of Andy Wijaya). In solution the particles are fairly monodisperse.
Au8-PAMAM is another type of magnetizable nanoparticle comprised of a cluster of eight Au atoms contained in a dendrimer of polyamidoamine (PAMAM). Figure 2-2 shows a sketch of Au8-PAMAM.
gm
I .
ame 49
Figure 2-2: Au8-PAMAM cluster. The PAMAM dendrimer encapsulates the Au cluster in the center.
Nanoparticles can be linked to biomolecules, just as the dendrimer is in figure 2-2. As the particles experience losses due to magnetic alignment within a magnetic field, they heat up and subsequently transfer this heat to the coupled biomolecule.
2.2 Magnetic Heating
Magnetic heating of a magnetic nanoparticles occurs by power losses within the system. These power losses are described by equation (1)[ 1]:
(mHoer ff)2
2refkTV(1l+
2Tef)where m is the magnetic moment per particle, o is the field frequency, V is the
nanoparticle volume, and eff is the effective relaxation time. reff depends on two types of relaxation losses that contribute to the system: Brownian (rB) and Ndel (TN) losses:
ref B (2)
-TN + TB
Brownian losses occur when the entire particle rotates in response to magnetic moment alignment with the external field [14]. N6el losses occur when the magnetic moment realigns within the particle, without the particle, itself, changing orientation. B is defined in the following way:
8 vR3
8f - (3)
kBT
where rl is the sample viscosity and RH is the particle hydrodynamic radius. rNis defined as:
KV
TN = Toexp (4)
kBT
where r0o is the gyromagnetic ratio, K is the anisotropy constant, and V is the nanoparticles volume. By relating these equations to the power loss equation, it becomes apparent that the power loss, and therefore the magnetic heating, is a function of the particle's material and size and of the magnetic field's characteristics.
If a nanoparticle were then attached to a biomolecule within the solenoid, the nanoparticle's heat would be transferred locally to the area of the molecule contacting the particle. K. Hamad-Schifferli has shown that a field with a frequency of 1 GHz is
required to magnetically heat a gold nanoparticle with a diameter between 1-10 nm [9]. Ongoing research is being conducted in the Hamad-Schifferli group to find the precise amount of heat required for manipulating biomolecular activity. So far, K. Hamad-Schifferli has shown success using field strengths on the order of 750 A/m [1].
2.3 Helmholtz Coils
A Helmholtz coil pair is made up of two, identical, circular coils aligned on the same axis and separated by a particular distance. This separation distance, which is equal to the radius of the coil, is the feature that makes Helmholtz coils compatible with
fluorescence spectroscopy. Helmholtz coils have been used in applications in which highly uniform magnetic fields are required.
The field produced by the Helmholtz coil differs from the field produced by a normal solenoid. The field lines generated by the two coils add constructively, creating a uniform resultant field. Figure 2-1 shows the uniform field that results by superimposing the two individual fields.
Figure 2-3: Helmholtz coil pair 13]. Gold rings represent each coil in the pair. Field lines are shown in black and are uniform along the central axis.
The field at the center of a Helmholtz Coil is described by equation (5) [3]:
B
= (4) Hi1 (5)where n is the number of turns per coil, I is the current running through the coils, R is the radius of a coil, and po is the permeability constant.
2.4 Heating and Cooling
To eliminate any unwanted heat generated within a coil, water or air is often pumped around a coil to provide a form of cooling. K. Hamad-Schifferli has placed her
coil set-up in a large water bath at room temperature [8]. A rough calculation using Eq. 6
H = pCpAT (6)
where H is the heat generated, p is the density of the cooling medium, Cp is the specific heat capacity of the cooling medium, and AT is the change in temperature of the medium, shows that there is likely to be an increase of only a few degrees Celsius when water cooling is used. For most proteins and nucleic acids, a few degrees temperature rise will have no affect on their activity. A biomolecule requires a significant temperature rise before its activity will become altered.
2.5 Fluorescence Spectroscopy
After the biomolecule has been heated inside the coil, it is necessary to monitor the effects of the heat-induced manipulation using fluorescence spectroscopy. During this process, photons of a specific wavelength excite the electrons in the sample,
elevating their energy level. Excited electrons are unstable and lose their excess energy in two stages: small amounts first, then a large amount. As electrons drop back down to a low energy state, they emit a photon of light, which is lower in energy than the photon that initially excited the electron [4]. Figure 2-2 shows the excitation and emission process. Exited sate
~q)~t~-_ :0%fro
i e iht , L¢ ,ne; ,(1rjy , 4Blue light Ground sate
(High energy)
Figure 2-4: The fluorescence process. Blue light excites the electron, elevating it to an excited state. The red lines represent the lowered energy states attained when the electron loses small amounts of energy. The green light is the photon emitted when the electron loses a large amount of energy as it returns to its ground state [5].
The frequency of the emitted photon provides information about the structure of the sample. For example, a technique called FRET (Fluorescence Resonance Energy Transfer) can be used to monitor the double-stranded versus single-stranded nature of DNA and RNA.
During FRET, one strand of DNA is labeled with a fluorophore, while the
complement is labeled with a quencher. If the two strands are separated, the fluorophore-labeled strand fluoresces upon excitation, while the quenching strand does not. If the two
k k::
1=t_1
strands are coupled, the quenching strand absorbs the fluorophore's energy, and fluorescence does not occur [2]. Figure 2-5 depicts the FRET process.
_ fE~~~~~~~~~~~~~~~~~~~~__
J'
~-Dark Dark
Figure 2-5: FRET. When the strands are coupled, the complex is dark. If the strands become decoupled, the quenching strand remains dark, while the fluorescently-labeled strand fluoresces.
This method provides information on whether a strand of RNA or DNA is hybridized or dehybridizedand is sensitive to distances in the nm range.
If a protein is the target being monitored, there are several ways of analyzing it. If the goal is to affect protein folding through bio-manipulation, the difference in
fluorescence between a folded and non-folded protein can be used. If the goal is to examine if a protein was produced, certain fluorophores can be used, which only
fluoresce if the protein is successfully made. In this way, the fluorescence of the sample indicates if the biomolecule has been successfully manipulated.
Chapter 3
Design Requirements
3.1 Introduction
In order to design a coil set-up that can function successfully, certain constraints and design considerations must be taken into account. These constraints and
considerations have been broken down into several categories: electromagnetic
considerations, heating considerations, monitoring considerations, housing and interface considerations, and interrelated considerations.
3. 2 Electromagnetic Considerations
To ensure that the coil properly heats biomolecules, it has to be capable of generating approximately 750 Amp/m of field and operating in a frequency range between KHz to GHz. It must also have a uniform field throughout the center where the 100-200 p1-sample fits. The coil requires a uniform field for accurate characterization. While a normal solenoid easily achieves a uniform field, a solenoid cannot be used here,
as the coil is to be used within a fluorometer. Therefore, a different type of coil must be used: a coil that provides a uniform central field, but does not block the light paths to and
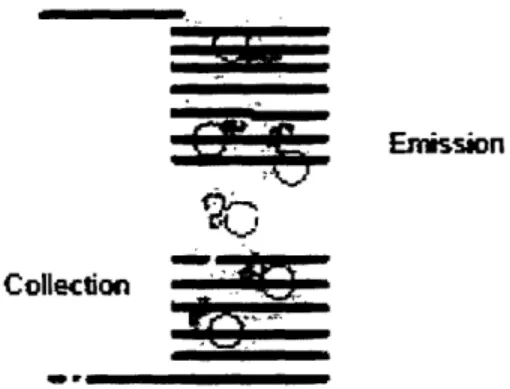
from the sample inside the fluorometer. A Helmholtz coil pair, which was introduced in section 1.2, is used to achieve these effects. A Helmholtz coil is essentially two identical solenoids, aligned on the same axis, spaced some distance apart [3]. Figure 2 recalls the image from section 1.2 of the Helmholtz coil allowing for unobstructed paths to and from the sample.
Collectim ..
Figure 3-1: Helmholtz coil with light paths. Note how the paths into and out of the sample are not obstructed.
A Helmholtz coil has a separation distance equal to the radius of a coil. When using this set-up within the fluorometer, the sample requires an approximately 5 mm-long space to receive the excitation light. Therefore, the Helmholtz coil pair must account for an opening at least 5 mm long, and therefore must have a radius of at least 5 mm.
3.3 Heating Considerations
In addition to electromagnetic constraints, certain heating constraints exist. The nanoparticle should heat up solely as a result of losses induced in the particle due to the alternating magnetic field of the coil. If heat is generated this way, it can be locally transferred to the specific portion of the biomolecule that is in contact with the
nanoparticle. Local heating allows for precise control over the biomolecule. However, during the heating process, the coil itself generates heat through resistive heating. Resistive heating occurs as a result of the coil's resistance to current flowing through it. There is the risk that some of the heat generated will be transferred to the entire
biomolecule, overshadowing any heating occurring on the local level.
To prevent the coil from transferring resistive heat to the sample, this heat must be removed from the coil. A cooling mechanism must be incorporated into the coil's design to ensure local control of the biomolecule. A cooling mechanism will take the form of a chamber for air surrounding the coil. As fluid is pumped into and back out of
the chamber, heat will be transferred out of the coil, through the fluid, and out of the entire set-up.
3.4 Monitoring Considerations
Monitoring the results of biomolecular manipulation is extremely important, as it allows individuals to understand how, why, and if activity is altered. Fluorescence spectroscopy is the method that will be used to monitor samples heated within the coil. While the Helmholtz coil design addresses the issue of light paths into and out of the sample, there are still other constraints that need to be considered. The cooling
mechanism may potentially block these light paths, and therefore the mechanism must be designed with this constraint in mind. To address this issue, an optically clear material will be used in the chambers where the light paths meet the sample. The set-up will also be properly aligned with the light paths within the fluorometer to ensure an unobstructed light path. The coil set-up must also be enclosed in a drawer within the fluorometer that prevents all light penetration in from the environment, as outside light can interfere with the spectroscopy process.
3.5 Housing and Interface Considerations
The inevitable need for electrical connectors, pipe fittings, and any other adaptors leads to a final set of constraints on the coil. As mentioned in section 3.4, the coil must fit within a drawer to shield it from outside light. The coil must also have a shield around it which protects the user from the electromagnetic field it creates. To account for the drawer and shielding requirements, a fluorometer drawer will be made of shielding material, acting as both a shield and a drawer. This combination cuts down production
3.6 Interrelated Considerations
The electromagnetic, heating, monitoring, and housing constraints all affect the design of the coil set-up in an interrelated way. The cooling constraint requires a chamber of air to be totally enclosed either around or inside of the coil. An entirely enclosed chamber makes it difficult to load a sample into and out of the coil. The chamber would also make it difficult to capitalize on the spacing left by the Helmholtz coil that allows the set-up to be used in a fluorometer. The chamber must still be
enclosed while allowing an optically clear path to the sample. The need to pump air into and out of the chamber for cooling complicates the housing. The housing is meant to be both an electromagnetic shield and a drawer that prevents outside light from penetrating into the fluorometer. Tubes need to connect from outside to inside the housing, however. Electrical connections to the coil must also be made through the housing. An effective design requires careful consideration of every constraint and issue mentioned here.
Chapter 4
Methods
4.1 Introduction
After examining all of the various design considerations and constraints, a magnetic field finite elements analysis was conducted to determine the proper coil dimensions. Then, a design that fulfills all of the above requirements was made using Solid Works. After the design was created, materials were determined and purchased. The set-up was then constructed using equipment at MIT's Edgerton Center Student Shop. After constructing the set-up, the coil's behavior was characterized by running an FEA, incorporating its actual dimensions. Its effectiveness was then tested: first without a sample of nanoparticles and then with a sample of nanoparticles.
4.2 Considering Constraints
To determine the radius, thickness, and number of turns for each coil of the helmholtz pair, a magnetic field finite element analysis was conducted. This analysis indicated the specifications for a coil that can create a 750 A/m field. Once the coil dimensions were determined, the rest of the coil up was designed. The rest of the set-up determines how the sample fits inside the coil, the type of cooling method used and how it is carried out, and how the set-up fits into the fluorometer. Therefore, to create a set-up design, some thought had to be given to how to deal with these constraints. If the cooling method chosen employs a fluid, there has to be some sort of chamber that either fits inside or around the coil to provide cooling. The fluorometer space had to be measured to ensure the set-up is able to fit inside of it. The light paths within the fluorometer also had to be examined, as there needs to be a clear path between the
fluorometer's radiation and collection points and the sample. Therefore, the set-up either needs to leave a path to the sample completely open or covered with optically clear
material. Furthermore, electrical connections and tubing in and out of the set-up have to be accounted for.
4.3 The Design
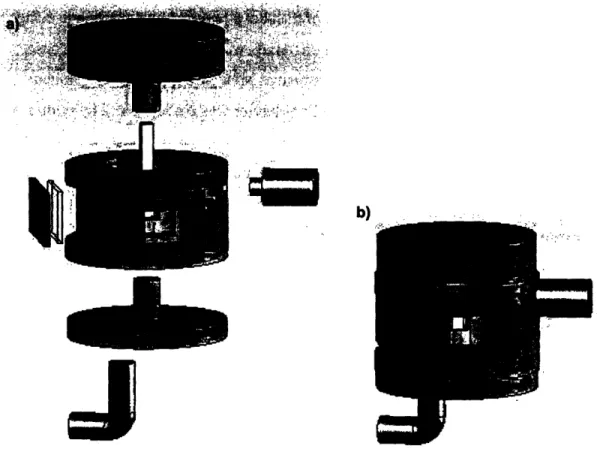
Once all the constraints were considered, a design for the set-up was made using Solid Works, and is shown in figure 4-1.
"n
hi
-A
a
Figure 4-1: a) Exploded view of the solid model of the coil set-up made using Solid Works. b)
Condensed view of set-up.
4.3.1 Electromagnetic Design Components
This design accounts for all of the different requirements outlined in Chapter 3. The electromagnetic considerations are satisfied by the design of the posts, which act as a
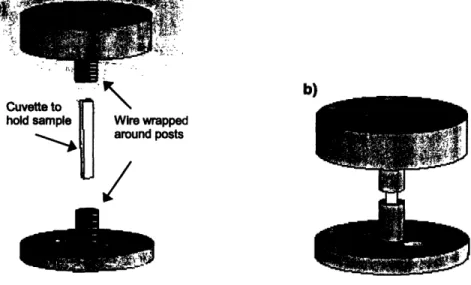
support for the coil. The posts, shown in figure 4-2, are made of plastic and provide a cylindrical shape around which wire can be wrapped to form the coil.
-- A WSSIInk
Cuvette to .
hold sample Wire wrapped around posts
n_/
/.IFigure 4-2: a) Exploded view of the cooling chamber. The top and bottom of the chamber have two posts built in, one for each coil of the Helmholtz coil pair. Red represents the wire wrapped around each post to make the two coils. b) Condensed view. When the top and bottom are put together, the coil pair surrounds the sample, leaving a small opening for monitoring.
To determine the dimensions of the coil, and therefore the dimensions of the posts, a magnetic field finite element analysis was conducted. By varying the diameter of the wire, the diameter of the coil, the spacing of the wire, and the spacing of the coils, an optimal coil was designed that is theoretically able to achieve magnetic fields of 750 A/m. The model coil has 20 turns per coil, a coil diameter of 14 mm, and a distance of 7 mm between the two coils. The wire used is 28-gauge, which has an insulated OD of 0.5mm, and a non-insulated OD of 0.32 mm.
4.3.2 Heating Design Components
To account for the heating and cooling requirements, a chamber was incorporated into the design, as shown in Figure 4-3.
Figure 4-3: Condensed view of chamber.
The chamber has holes where pipe fittings can pump air in and out, removing resistive heat from the sample by convection.
4.3.3 Monitoring Design Components
To account for the monitoring requirements, the chamber was enclosed with glass to allow light into and out of the sample. Figure 4-4 shows the "windows" and the plastic pieces that hold them in place.
Plastic
window
Figure 4-4: a) Glass windows enclose the chamber, providing an optically clear path to and from the sample. Plastic casings hold the windows in place. b) The windows and the Helmholtz coil pair
Glass may not be the material used long-term for the windows as it prevents light penetration into the sample at the UV range. However, quartz could be used as an alternative.
4.3.4 Housing and Interface Design Components
To account for the housing requirements, a fluorometer drawer-combination-electromagnetic shield was designed and is shown in figure 4-5.
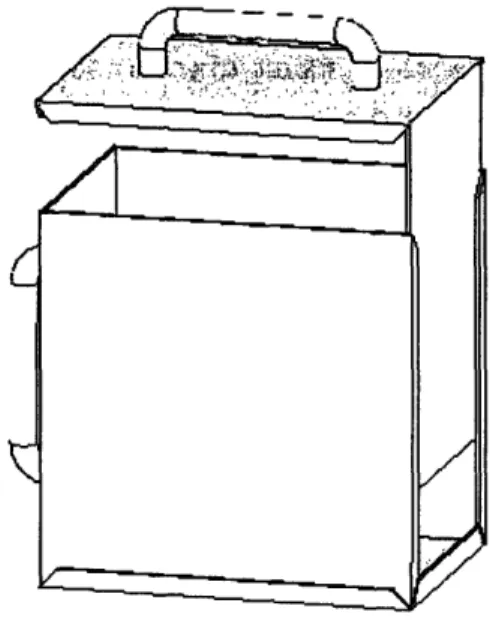
Figure 4-5: Two components comprise the shield: each is to be made from a bent piece of sheet metal.
The top component slides into the bottom one. The coil set-up fits inside.
The drawer serves the dual purpose of shielding the fluorometer from outside light and shielding the user from unwanted electromagnetic radiation. The shield sits inside of the fluorometer and the coil set-up sits inside of the shield, as shown in figure 4-6.
Coil
_
/I
Set-up
1 I I
-I ' 1 J
Figure 4-6: a) Exploded schematic of the three components of the system: Coil set-up fits inside of the shield, which fits inside of the fluorometer. b) Condensed schematic.
A positioning mechanism was also designed to ensure that the sample within the coil would always be properly aligned with the fluorometer's light path. The positioning system took the form of two posts, which would place the coil at the proper height. The posts would also fit into holes cut out of the base of the shield, aligned with the location of the light path. The posts took the form of two rods, with dowel pins sticking out of both sides of each rod. These dowel pins would fit into grooves cut out of the base of the shield and the bottom of the coil chamber. Figure 4-7 shows a schematic of the
positioning system.
Coil
Posts
Figure 4-7: Positioning system. Coil chamber has grooves cut out that fit onto the dowel pins of the post. The bottom dowel pins in the post fit into the grooves cut out of the shield base.
_r_ _ __ UL
4.4 Construction
Nylon was used to make the bulk of the set-up as it was readily available and does not interfere with magnetic fields because it is non-metallic. A cylindrical piece of nylon was machined on the lathe and mill to create the chamber and coil posts. Nylon was also machined on the mill to make the window casings. Glass microscope slides were cut to size for the windows. The coil pair was made by simultaneously wrapping two strands of 28-gauge copper wire around each post. Two strands were used so that one could then be removed, leaving a coil made up of one strand of wire with equally-spaced gaps between each turn. Leaving gaps between turns is necessary, as two turns in contact may act as a capacitor, creating an unwanted path for the charge. Figure 4-8 shows how the wrapping process works.
a
Begin with two wires
b)
rove second wire strand
I =C_I H
_MMMMM
Figure 4-8: Wrapping wire around the post to create a coil. In a) two wires are wrapped next to each
other. In b) one wire has been removed, resulting in a coil with turns equally-spaced.
Epoxy was used to coat the outside of the coil to ensure the coil remains in place. After machining all of the parts and arranging the coil, the components were assembled and pipe-fittings were added for pumping air. Two rubber stoppers were also used as a means of channeling the wire out of the chamber, as holes were poked in the stoppers and the wires were passed through these holes. Stoppers were used to cut down on the potential for fluid-leakage since the stoppers mold against the wire, filling in gaps. The rubber stoppers also insulate the wire. Figure 4-9 shows the set-up after assembling the different components.
Figure 4-9: Photos of the coil set-up after assembly.
4.5 Determining the Field and Characterizing the Coil
To find the relationship between current and field, a magnetic field finite element analysis was conducted. The actual coil deviates slightly from the modeled coil; the analysis represents the actual coil as accurately as possible. There are 19 turns per coil, and the coil diameter is 14 mm. The distance between the two coils is 7mm. The spacing between each turn was measured and was found to be 0.514 mm on average. 28-gauge wire was used with an un-insulated diameter of 0.32 mm and an insulated diameter of 0.5 mm.
Several magnetic field analyses were conducted, all with different current inputs. Based on these results, a general relationship between the current and the produced field for this particular coil was produced. Figure 4-10 shows the result of one finite element iteration. It also shows the relationship between current and field that was produced after running the FEA with several different current inputs.
a) H[A/m] 2.2963e+003 ncennQ I -I . UDU ¢ IT - J 1.8371e+003 L , 1.6075e+003 1.3780e+003 1.1484e+003 9.1877e+002 6.8918e+002 " cn- nn-l" 2.3000e+002 4.0879e-001 Cross section of coil turns - Uniform Field b) 3000 _ 2500 ,. 2000 Z 1500 I 1000 = 500 0 H_cent er vs. I 0 2 I (Ampl 4 6
Figure 4-10: a) Finite element analysis produced by modeling the Helmholtz coil pair as accurately as
possible. Input current was set to 1.5 Amps. b) Relationship between input current (I in amps) and resulting magnetic field at the center of the coil pair (H_center in amps/m) as determined by finite element analyses conducted over a range of currents.
The current and resulting magnetic field at the center of the coil pair are directly proportional:
Hcenter =505.45 x I (7)
Where Hcenter is the value of the magnetic field at the center of the coil in A/m and I is the input current in Amps, and the units for the coefficient of Iare 1/m.
4.6 The Shield
To prevent leaking of the field, which could interfere with the fluorometer electronics or cause damage to other equipment and even people, a shield was
constructed. It was made by folding 0.034 in. thick Aluminum sheet metal, which had been cut to the proper shape using a water jet, into a box formation. Holes were then added to account for electrical connectors, pipe fittings, and the fluorometer's light path. However, a conflict occurred when determining what size holes to allot for the light path. The fluorometer, itself, had a large hole for emitting light and a large one for collecting light, both on the scale of 1 to 2 inches in diameter. However, holes of this size in the shield would result in electromagnetic leaking. Holes can be included in the shield, but they must be as small as possible to reduce the possibility of field-leaking. Holes used in the shield were around 0.5 in. This is because 0.5 in. is about the size of 1/10 the length of the smallest wavelength that could be used during spectroscopy. By having a hole 1/10 the length of a wavelength of radiation, the radiation is inhibited from leaking out of the shield.
A collection hole 0.5 in. in diameter was shown to be acceptable by running fluorescence tests in which the collection hole was cut down to 0.5 in. in diameter. The amplitude of the results decreased by about a factor of 3, which was deemed small enough of an effect to be acceptable. Therefore the collection hole in the shield was made to be 0.5 inches in diameter. The light emitting hole is larger than 0.5 in-it is 1 in2. However, in order for the proper amount of light to be emitted from the fluorometer, this hole is required to be this large. After testing the field outside of this hole with a magnetic field detector, it does not appear to be a significant source of radiation leakage, and therefore its dimensions are acceptable.
In the rest of the shield, gaps between different metal surfaces, such as at the seams of the box, were made to be as small as possible, and always less than 0.5 in. Copper fingerstock from Omegabytes was inserted between metal surfaces to cut down gap sizes and prevent radiation leakage. Wherever possible, metal-to-metal contacts were created.
Figure 4-11: Constructed shield. Cables and piping are connected to the shield.
4.7 Positioning
The alignment post was the last element to be constructed. The two posts were made from round plastic stock. They were manufactured at different times and, as a result, are made from different materials: Delrin and polystyrene, as those were the materials readily available at the time. Each plastic rod was cut to the proper height for positioning. Holes were drilled on both the top and bottom surfaces of the posts and 0.25 in. diameter plastic dowel pins were press fit into each of the holes. A 0.375 in. thick piece of aluminum was added on to the bottom of the shield to provide material for
creating grooves into which the posts could fit. Holes were drilled in this base plate and into the bottom of the coil chamber. The holes were properly aligned to ensure that the center of the sample would be in line with the center of the light path in the fluorometer. Figure 4-12 shows how the rods play a role in aligning the set-up within the shield.
Figure 4-12: Coil set-up positioned within shield. Two plastic rods elevate the chamber while keeping it in position within the shield.
4.8 Testing
After the coil set-up, shield, and positioning mechanism were completed, several tests were conducted to test the set-up's effectiveness. The first test conducted analyzed current flowing through the coil as a function of the frequency of the input signal. The Network Analysis was run next, which detected the frequency range over which the coil functions as an inductor and the range over which it functions as a capacitor. Air cooling was then tested to ensure that air provided sufficient cooling within the set-up to prevent resitive heating. Finally, two types of global heating tests were conducted to test the coil's ability to magnetically heat particles.
4.8.1 Current versus Frequency Test
The current running through a coil does not remain constant over a range of frequencies, but rather experiences peaks and variations. This phenomenon is caused by differences in impedance within the coil system.
In the coil set-up, current generated by the signal generator runs along a wire within a cable, leading into and out of the coil system. The cable connects to the wire
coil, it experiences a change in impedance. This change results in some amount of reflected current, proportional to the degree of change. Reflected waves decrease the amount of current running through the system as they may add destructively with the flowing waves of current. Figure 4-13 shows a diagram of the wave path.
Incident Wave
fr.,
---Figure 4-13: 111] Mismatched impedance. As the wave transfers from areas of different impedance
(Z), some amount of wave is reflected.
To understand the field generated within the coil, the amount of current running through the system must be known. To characterize the current, the relationship between current and input frequency must be determined. This relationship was tested by
detecting the current into the coil over a range of frequencies and gains. A schematic of the set-up used is shown in Figure 4-14.
Signal
Generator | Current Co i
Probe Coil
Oscilloscope
Figure 4-14: Schematic of coil versus frequency set-up. The signal begins with the signal generator, passes through the current probe, into the coil, back through the current probe, and finally out through the oscilloscope.
To carry out the test, the gain of the 100W amplifier was set to a specific value. Then, a test was conducted which detected the current flowing through the current probe over a range of frequencies: from 100 KHz to 100 MHz. The gain was then changed and the same test was run again. This test provided information not only about the relationship between current and frequency, but also about the relationship between current and gain.
Using this information about current characterization, a simulation was conducted to characterize the amount of current that flows through the coil. This amount of current differs from the current flowing through the current probe as the current probe has a different inductance than the coil. The inductance of the coil was detected using the network analyzer. The circuitry of the system was modeled and is shown in Figure 4-15. This model was inputted into PSPICE, a software program that allows users to design and simulate analog and digital circuits.
Current Probe
Coil
Pair
Figure 4-15: Circuit diagram for coil set-up. Current path begins at the voltage source (the amp), travels through a coax cable, through the current probe, through another cable, and into the
Helmholtz coil pair.
Using the PSPICE program, a model of the current running through the coil was
obtained. The current running through the current probe was also modeled and compared against the previous current-versus-frequency test to ensure accuracy of the models. The resulting models are shown in figure 5-2.
4.8.2 Network Analysis
A network analysis test was run to detect the frequency ranges over which the coil acts as an inductor and the range over which it acts as a capacitor. In order for magnetic heating to take place, the coil must behave as an inductor.
A network analysis also provides information about where the impedance is smallest, which is useful for determining where the current is largest.
4.8.3 Air Cooling
An air-cooling test was performed to verify that air removes a significant portion of the resistive heat generated. To perform this test, water was used as the sample inside of the coil. The test began by running the coil at 232 MHz, resulting in generation of resistive heat inside of the set-up. 232 MHz was used because the network analysis results indicated that the impedance of the coil was at a minimum at this frequency, and therefore the current running through the system was at a maximum. Maximum current through the system provides a worst-case scenario, as the coil heats up the most when the largest amount of current runs through it. The coil remained on for 300 seconds, and then was switched off. It remained off, to cool, for the next 450 seconds. The coil was then turned back on for 300 seconds, though this time 30 SCFH of air was blown through the system to decrease the effects of resistive heating. The system was then switched off and remained off for another 450 seconds. The pattern of running for 300 seconds, then cooling for 450 seconds was continued throughout the test, and the air pressure was increased by 30 SCFH during each new sequence. By the last sequence, 180 SCFH of air ran through the system. The temperature of the system was constantly monitored by a temperature probe within the water sample.
4.8.4 Global Heating
The coil's ability to globally heat a nanoparticles sample by magnetic heating was tested using a sample of EMG 705. EMG 705 is a concentrated sample of 10 nm
magnetic Fe304particles in water that experience a temperature rise due to losses during magnetic realignment.
The sample was heated inside of the coil set-up over a range of frequencies while receiving 60 SCFH of air cooling. The frequencies used were 101 KHz, 1.23 MHz, 11.1 MHz, 26.4 MHz, and 92.3 MHz. These particular frequencies were chosen as points where the current flow through the coil is high. During the test, the temperature of the EMG particles was compared to that of a water sample run over the same frequencies. This test provided information about the magnetic heating that takes place within the coil.
A second test was run to test the set-up's ability to function within the
fluorometer. During this test, concentrated Au8 clusters were magnetically heated within the coil [6]. The temperature of the sample and its fluorescence were monitored over time and were compared. This test provided information about the set-up's ability to function within the fluorometer.
Chapter 5
Results
5.1 Current as a Function of Frequency
As outlined in section 4.8.1, the current running through the current probe and into the coil set-up was tested as a function of frequency and gain. The results obtained are shown in figure 5-1. Stied -N1 1.'C 20 40 I00 fe(I 4MHZ
Figure 5-1: Current vs. frequency over a range of gains. The peaks in largest amount of current flows through the current probe.
current show areas where the
The current running through the coil, itself, was simulated using the program, PSpice, as outlined in section 4.8.1. The results obtained through the simulation are shown in figure 5-2. 30S
100
.00 0 0 I I 0 --- 1500 2000 2500 -- 3000- Currenl in
Coil
- Current in
Probe
O.OE+OO 2.00E+01 4.OOE+1 6 00E+E+0 BJE+01 1 .WE+02 Ft rqetncy (H14z)
Figure 5-2: Current flowing through the coil and through the current probe. Nodes occur in current probe data as a result of a lack of impedance matching.
The model of the current running through the coil shows that the current peaks at a low frequency and then decreases as the frequency increases.
5.2 Network Analysis
The network analysis, as described in section 4.8.2, provided information about the frequencies over which the coil behaves like an inductor and the frequencies over which it behaves like a capacitor. Figure 5-3 shows the results that were obtained when the coil was tested over a range of frequencies.
,) 'I.UUt+UJ
.
-. -- -8.00E+02 6.00E+02 e 4.OOE+02 0 2.00E+02 O.OOE+OO -2.00E+02 -A nn-.no 1 .OUt+UJ 1.60E+03 1.40E+03 ' 1.20E+03 I1.00E+03 8.OOE+02 8 6.00E+02 4.00E+02 2.00E+02 O.OOE+OO 1 nrrr.n--I)) 4.00E.02 3.OOE02 2.00E02 1.00E+02 5 O.OOEo00 --1.OOE+02 -2.OE+02 -3.00E+02 -4.00E+02 -5.00E,02 Freqluency tHz
Figure 5-3: Smith chart values. a) Values taken between 10 KHz and 250 MHz. b) Values taken between 800 MHz and 4 GHz.
In a Smith chart, positive values reflect inductive behavior, while negative values reflect capacitive behavior. The coil was tested over a range of frequencies and, based on the smith chart results, was shown to be inductive over the following ranges of frequencies:
From To 0.01 25 MHz 27 217 MHz 228 233 MHz 0.932 1.15 GHz 1.375 1.609 GHz 1.852 2.116 GHz 2.365 2.393 GHz 2.83 2.88 GHz 2.907 3.159 GHz 3.381 3.6 GHz 3.822 4 GHz
Table 5-1: Frequency ranges where the coil is inductive.
5.3 Air Cooling
The results of the air-cooling test, which was outlined in section 4.8.3, show that air flow through the coil chamber effectively removes generated resistive heat.
0, I-U4. or u -500 500 1500 2500 3500 4500 5500 Tine (sec)
Figure 5-4: Temperature as a function of time during air cooling. The red bars along the bottom indicate a period of heating, 300 seconds long. The blue bars indicate a period of cooling, 450 seconds long. First, the coil was heated with no cooling, then with 30 SCFH of air. Each subsequent
red bar after that indicates another rise in 30 SCFH of air pressure, until the max pressure of 180
SCFH was achieved.
Figure 5-4 shows the effects that air cooling had over preventing a temperature rise in the sample. Without air cooling, the sample raised in temperature by 6.3°C over the course of 300 seconds. With 30 SCFH of air flowing through the system, the temperature rise dropped to 1.20C over 300 seconds. When the air flow increased to 60 SCFH, the temperature rise dropped even more to 0.65 C. Therefore, air flow of 60 SCFH or greater is sufficient to remove resistive heating effects. The subsequent heating periods, which took place with incrementally more air pressure, also saw a steady drop in the temperature rise. i i i i i I IIi j i i i I
5.4 Global Heating
During the global heating test, outlined in section 4.8.4, the EMG 705 particles saw an increase in temperature that was significantly higher than that of the control water sample. The larger temperature rise of the EMG particles is attributed to magnetic heating. The results are shown in figure 5-5.
34 32 .' 30 v 28 i 26 I,-24 22 - pEMO 705 -Water 0 500 1000 1500 2000 2500 3000 3500 Time (sec)
Figure 5-5: Results of globally heating EMG 705. Each peak corresponds to heating that took place
at a different input frequency. Frequencies used were 101 KHz, 1.23 MHz, 11.1 MHz, 26.4 MHz, and 92.3 MHz. Water was also heated under the same conditions to act as a control.
In addition to EMG 705 particles, Au8-PAMAM cluster particles were heated. These particles were heated at 233 MHz, as this frequency was shown to have a maximum of current flow. Water and PBS were also heated under the same conditions to act as controls. The heating process took place within the fluorometer, and a fluorescence spectroscopy scan concurrently took place. Figure 5-6 provides the thermal results of the heating process. The Au experienced a temperature rise that was significantly larger than that of the PBS and water samples. The Au nanoparticles exhibited a temperature rise of approximately 300C, while the PBS only rose by 15°C. This larger temperature rise is attributable to magnetic heating that takes within the magnetic Au particles, but not within the water or PBS.
60 -55 -50 -.2
45
7 40 i 35 30 25 20 --.- Au -+ Water -a-- P6S 0 50 100 150 200 250 300 Time (seciFigure 5-6: Magnetic heating at 233 MHz. Au particles, water, and PBS were heated for 150 seconds at 233 MHz.
Figure 5-7 shows the fluorescence results for the Au scan. The Au experiences a change in emission just as the sample begins to heat. When the heat is turned off, the emission begins to return to its initial amplitude. The change in fluorescence indicates that the temperature of the particles themselves, not just their medium, has risen. At higher temperatures, metallic nanoparticles have a lower probability of emitting a photon of light, resulting in lower-amplitude emissions.
1 UUU 1550000 O 1500000 X 1450000 < 1400000 1350000 1300000 0 100 200 300 400 50 Tinmo (seet
Figure 5-7: Fluorescence scan during Au heating. The red bar indicates the times when the sample is
heating. Light blue represents cooling.
_ _ __ _
- ·-
--- I .... . -. .. ·--- I -"
Chapter 6
Conclusions and Future Work
6.1 Success Level
The coil set-up was shown to be mostly successful in how it functions. This section will examine how effectively the set-up accomplishes the requirements that were initially set out for the system.
6.1.1 Electromagnetic Requirements
The coil was shown to successfully produce a field. However, it is unknown whether the field produced is in fact uniform, as the theory predicts, as there is currently no way to test the consistency of the field at the center of the coil.
The goal was to create a coil that could produce approximately 750 A/m of field at its center. Based on characterization of the coil obtained from equation (9), the coil produces 750 A/m of field when 1.48 Amp of current flow through it. By comparing this required amount of current to the results of the PSPICE simulation from Figure 5-2, it becomes apparent that the coil passes 1.48 Amp of current at 0.63 MHz. Therefore, at 0.63 MHz, the coil accomplishes the set-out task of creating a field of 750 A/m.
Furthermore, the coil is required to behave inductively to generate a magnetic field. The Network Analysis results shown in Figure 5-3 indicate that the coil does behave as an inductor over a variety of frequency ranges.
6.1.2 Heating Requirements
The heating requirements dictated that the coil induce heat in the nanoparticles as a result of magnetic heating, not resistive heating generated by the coil. In order to accomplish this task, the effects of the resistive heating have to be removed from the system, while the nanoparticles continue to heat to do magnetization. The results of the
initial air cooling test, shown in Figure 5-4, show that air cooling does eliminate a significant amount of resistive heating generated in the system. This test was conducted with water as the sample, which only experienced temperature rise due to the coil's resistive heating, as water is not magnetizable. The temperature results reflect the air's ability to affect resistive heating. The EMG 705 global heating test results shown in figure 5-5 support the theory that the coil heats particles by magnetic heating. These results show a significantly higher rise in the temperature of EMG particles over water, indicating that magnetic heating is affecting the particles. However, in this test the water does heat up by 3-4 degrees, which is a larger temperature rise than was seen in the initial air cooling test. This result indicates that, at certain frequencies, higher air pressure may be needed to better eliminate the effects of resistive heating.
The Au global heating test further supports the theory of magnetic heating because the magnetizable particles experienced larger temperature rises than the non-magnetizable mediums. The fluorescence scan corroborates the temperature rise of the particles, as a rise in temperature of the Au particles is associated with a drop in emission amplitude, which was seen.
6.1.3 Monitoring Requirements
The set-up was shown to function effectively within the fluorometer. The light paths were successfully aligned, as the fluorometer was able to excite the sample inside the set-up and scan the sample's emission. The results obtained in figure 5-7 would not have been possible had misalignment or light leakage occurred. Furthermore, the data reflects an adequate signal, indicating that the set-up did not interfere in the fluorescent measurements.
6.1.4 Housing and Interface Requirements
The housing of the set-up, which took the form of the shield, was effective in shielding both light and electromagnetic radiation. The fluorometer was able to function properly while the set-up was turned on inside of it, indicating that there were no leaked
fields interfering with the machine's own electronics. The light was also sufficiently blocked as fluorescence scans were successfully produced.
6.2 Applications
Now that this system has been shown to successfully heat magnetic particles, it will facilitate future studies on how different particles of different sizes and materials undergo heating. Different magnetic particles can be used inside of it and heated at different currents and frequencies and the particles' behavior can be monitored through fluorescence spectroscopy.
6.3 Future Work
More work still needs to be done on the coil set-up to ensure its effective
functioning. Currently, the coil passes the largest amount of current at low frequencies. However, for certain systems and particles it may be beneficial to operate the coil at higher frequencies. The coil would have to be altered to change its electromagnetic properties so that it could pass a large amount of current at a range of different frequencies.
Furthermore, during the global heating tests it was apparent that some amount of resistive heating was still present in the system during cooling. Better removal of resistive heat would make the system more effective in its goal to locally heat particles.
References
[1] A. Wijaya, K. A. Brown, J.D. Alper, and K. Hamad-Schifferli, "Selective Heating of Multiple Nanoparticles," Proceedings from the Materials Research Society Symposium,
Boston, MA, 2005, 900E, 0900-009-40.1-6
[2] Fluorescence Resonance Energy Transfer. 1 May 2006. Wikipedia. 9 May 2006. <http://en.wikipedia.org/wiki/FRET>
[3] Helmholtz Coil. 20 Sept. 2005. Wikipedia. 20 Sept. 2005. <http ://en.wikipedia.org/wiki/Helmholtz_coil>
[4] Helmholtzsm. 20 Oct. 2005. Integrated Engineering Software. 20 Oct. 2005. <http://www.integratedsoft.com/images/helmholtzsm.gif>
[5] "Imaging Techniques." Centre for Synaptic Plasticity. 13 Oct. 2004 Centre for Synaptic Plasticity, University of Bristol. 1 Apr 2006
<http ://www.bris.ac.uk/depts/Synaptic/info/imaging/imaging_ l.htm>.
[6] Jie Zheng, Caiwei Zhang, and Robert M. Dickson, "Highly Fluorescent, Water-Soluble, Size-Tunable Gold Quantum." Physical Review Letters. 93 (2004): 077402.
[7] Jordan, A., Scholz, R., Wust, P., Fahling, H. & Felix, R. "Magnetic Fluid hyperthermia (MFH): Cancer treatment with AC magnetic field induced excitation of biocompatible superparamagnetic nanoparticles." J. Magn. Magn.
Mater. 201, 413-419 (1999).
[8] K. Hamad-Schifferli, "DNA Hybridization: Electronic Control," Encyclopedia of
Nanoscience and Nanotechnology, edited by J. A. Schwarz, C. Contescu and K. Putyera
[9] K. Hamad-Schifferli, J.J. Schwartz, A.T. Santos, S. Zhang, J.M. Jacobson, "Direct Electronic Control of Biomolecular Systems: Using Nanocrystals as Antennas for Regulation of Biological Activity," Proceedings from the Materials Research Society
Symposium, San Francisco, CA, 2001, Y8.43.1-6
[10] K. Hamad-Schifferli, J.J. Schwartz, A.T. Santos, S. Zhang, J.M. Jacobson, "Remote electronic control of DNA hybridization through inductive coupling to an attached metal nanocrystal antenna," Nature, 2002, 415, 152-155
[11] "Low-Noise Amplifier Stability Concept to Practical Considerations, Part 1." Maxim
Integrated Products. 2006. 5 May 2006
<http://www.maxim-ic.com/appnotes.cfm/appnote_number/1 849>
[12] Morrison LE, Stols LM. AMOCO Technology Company, Naperville, Illinois 60566. "Sensitive fluorescence-based thermodynamic and kinetic measurements of DNA
hybridization in solution." Biochemistry. 1993 Mar 30;32(12):3095-104.
[13] R. Hiergeist, W. AndraK, N. Buske, R. Hergt, I. Hilger, U. Richter, W. Kaiser, "Application of magnetite ferrofluids for hyperthermia." Journal of Magnetism and
Magnetic Materials 201 (1999): 420-422.
[14] Rosensweig, R.E. "Heating magnetic fluid with alternating magnetic field."
Journal of Magnetism and Magnetic Materials 252 (2002): 370-374.
[15] Shinkai, M. et al. "Intracellular hyperthermia for cancer using magnetite
Appendix A
Set-up Pictures
Figure A-1: One coil of the Helmholtz pair.
Figure A-2: Top view of set-up inside shield. The top of the chamber has been removed to enable a view inside the chamber. Pipes and connectors lead from the coil, through the shield, and out.
Figure A-3: Top view of assembled set-up. Similar to A-2 except the top of the chamber has been screwed down. A temperature probe sticks out of a hole in the top of the chamber (black wire).
Figure A-4: Set-up during a fluorescence scan. Piping into the shield carries air. Black wire
Appendix B
Dimensioned Drawings
ii i - 3 - a - -] =l: - A -Z = -I = I -; i I 7 I-, IB-1: Chamber. Dimensions are in inches. ._-,--li 'a"
J L
_: I
-2 !1F-B-2: Coil stands. B-3: Window.
JEI
AL~- - - ·-- i; l~~~~~~~~~~~~~~~~~~ ;-1 i_ ---t l - 1 -__ - i 3i - -7-i1 ---
- - r- -~~~~~4 liF--- j_ ( 1 -I,-T:
B-4: Bottom of shield.~~~~~~~~~~
;1
'7 B-5: Top of shield. 'A N_ I4
¼-1 1 f ----I ... JL · --! ! r t II t ~1 ~ ~1~~ I 1- f I " f. i I !-I ;r ---- ! !K--U
MITLibraries
Document Services Room 14-0551 77 Massachusetts Avenue Cambridge, MA 02139 Ph: 617.253.5668 Fax: 617.253.1690 Email: [email protected]http: //libraries. mit. edu/docs