THE EFFECT OF NONUNIFORM AXIAL HEAT FLUX )ISTRIBUTION NEIL E. TODREAS WARREN M. ROHSENOW SEPTEMBER 20, 1965 CONTRACT NsG-496 REPORT NO. 9843-37 DEPARTMENT OF MECHANICAL ENGINEERING MASSACHUSETTS INSTITUTE OF TECHNOLOGY
ENGINEERING PROJECTS LABORATORY NGINEERING PROJECTS LABORATOR'
'IGINEERING PROJECTS LABORATO' INEERING PROJECTS LABORAT'
'NEERING PROJECTS LABORA 'EERING PROJECTS LABOR
'ERING PROJECTS LABO'
'RING PROJECTS LAB' ING PROJECTS LA IG PROJECTS L i PROJECTS L PROJECTS ROJEC' ')JEr
THE EFFECT OF NONUNIFORM AXIAL HEAT FLUX DISTRIBUTION
ON THE CRITICAL HEAT FLUX
by
Neil E, Todreas Warren M. Robsenow
Support extended by the
National Association for the Advancement of Science under Contract NsG-496 with the
Center for Space Research DSR Project No. 9843
September 20, 1965
Department of Mechanical Engineering Massachusetts Institute of Technology
ii Abstract
A systematic experimental and analytic investigation of
the effect of nonuniform axial heat flux distribution on critical heat rilux was performed with water in the quality condition. Utilizing a model which ascribes the critical condition, to either a nucleation-induced disruption of the annular liquid film or annular film dryout, the experimental results taken at low pressures (50-200 psia) were confirmed. Application of this model to higher pressure conditions
(500-2000 psia) indicated qualitative agreement with available
data of other investigators.
Experimental data was obtained for flux distributions representing cosine, linear increasing and decreasing, inlet and exit peaked, spike and uniform shapes. These flux distrib-utions were achieved by electrical resistance heating of test
sections whose outside diameter had been machined to the re-quired dimensions.. In each case the critical location as well as the total critical power was obtained by testing the tubes in vertical upflow to failure.
The analytic prediction of the results for all flux shapes has been achieved by development of a model which considers the effect of nucleation within the annular film. It is thown that the occurrence of the critical condition is related to the local degree of nucleation (the ratio of the local flux to the flux required to cause nucleation at the local conditions) and the local film flow rate. Both the experimental total critical power and the critical location are confirmed by this model. The
results indicate that the total critical power for the outlet peaked flux distributions tested (ratios of maximum to minimum flux of 2, 4, and 5.75 to 1) can be 15 to 30% lower than for uniform flux distributions at comparable hydrodynamic operating conditions. In addition, from this model for given operating conditions, a locus of critical conditions can be constructed from uniform flux distribution data which will enable predic-tion of the performance of nonuniform flux distribupredic-tions at similar conditions of mass velocity, pressure and diameter.
ACKNOWLEDGEMENT
Support for this study was extended to the Massachusetts Institute of Technology by the National Aeronautics and Space Administration under contract with the Center for Space Re-search. In addition support to facilitate initiation of the study.was provided by the Shell Companies Foundation. This study was done in part at the Computation Center at the Mass-achusetts Institute of Technology.
The permission granted by the Babcock and Wilcox Company and the Atomic Energy Commission to include results from a Babcock and Wilcox Company preliminary report is gratefully acknowledged.
Professors P. Griffith, A. Bergles, H. Fenech and M. Suo gave their time generously to discuss the program during the
course of the investigation.
Mr. F. Johnson and Mr. E. Hartell of the Heat Transfer Laboratory were of great assistance in constructing the experi-mental arrangement and keeping the facility operational.
Mr. A. Werthen of the Whitman Tool and Die Company and Mr. P. Wassmouth were responsible for developing the
techni-ques for fabricating the required test sections to specified tolerances. The machining of all test sections was performed
iv TABLE OF CONTENTS PAGE Title Page Abstract i Acknowledgement iii List of Figures vi Nomenclature Conversion of Units CHAPTER I: INRODUCTION 1 1.1 Background of Problem 1
1.2 Scope of the Research 2
1.3 Literature Survey 3
CHAPTER II: TWO PHASE FLOW WITH HEAT ADDITION 18
2.1 Flow Regimes 18
2.2 Critical Heat Flux 22
CHAPTER III: EXPERIMENTAL PROGRAM 28
3.1 Description of Apparatus 28
3.1.1 Hydraulic System 28
3.1.2 Power Supply 30
3.1.3 Instrumentation 31
3.1.4 Test Section 33
3.2 Experimental Procedures and Experience
34
3.2.1 General Loop Operation 34
3.2.2 Loop Operation for Critical Heat 36
Flux Data
3.2.3 Two Phase Heat Transfer Coefficient 38
Measurements
3.2.4 Correction of Oscillatory Instabilities 39
CHAPTER IV: PRESETATION AND DISCUSSION OF RESULTS 43
4.1 Experimental Results 43
4.1.1 Total Critical Power 44
4.1.2 Critical Location 46
4.1,3 Reproducibility of the Data 48 4.2 Formulation of the Method of Analysis 50
4.3 Calculation Procedure for the Method of 54 Analysis
4.4 Application of the Method of Analysis to 57
Experimental Data
4.4,l Discussion of Results 60
4.4.1.1 Total Critical Power 61
4.4.1.2 Critical Location 61
4.4.2 Discussion of Results - Flux Spikes 66 4.5 Application to Higher Pressures 70
CHAPTER V: SUMMARY AND CONCLUSIONS 74
5.1 Summary 74
5.2 Conclusions 75
5.3 Design Procedure (50-200 psia) 76
APPENDIX A Error Analysis 78
APPENDIX B Test Section Analysis 82
APPENDIX C Test Section Design 110
APPENDIX D Data Reduction and Analysis 115
APPENDIX E Program for Data Reduction and Analysis 122
APPENDIX F Tabulation of Data 170
BIBLIOGRAPHY 177
vi
LIST OF FIGURES
FIGURE
1 Effect of Local Heat Flux Spike on Burnout 2 Prediction of Critical Condition by Local
Con-dition Method of Janssen and Kervinen (Ref. 6) 3 Prediction of Critical Condition by Equivalent
Length Method of Lee and Obertelli (Ref. 9)
4 Regimes of Two-Phase Flow
5 Flow Regime Map for Test Conditions
6 Comparison of Uniform Flux Data with Existing
Correlations, G = 0.5 x 10⁶ BTU/HR-FT2
7 Comparison of Uniform Flux Data with Existing Correlations, G = 1.0 x 10⁶ U/HRi'r2
8 Comparison of Uniform Flux Data with Existing Correlations, G = 2.0 x 10⁶ 2U/HR-FT 2 9 Schematic Layout of Experimental Facility and
Test Section Arrangement
10 Axial Flux Distributions Tested
11 Confirmation for Test Section 112 That the
Overall Slope Goes to Zero at the Flow Rate
(G = 2.0 x 10 LBM/HR-FT2) where Oscillation Occurred
12 Total Critical Power for Uniform and Cosine Flux Distributions at G = 0.5 x 10⁶ LBM/HR-F2
13 Total Critical Power for Linear and Peaked Flux Distributions at G = 0.5 x 10⁶ LBM/HR-r2
14 Critical Locations (Inches from Inlet) for the Nonuniform Axial Distributions Investigated at
G = 0.5 x 10⁶ LM/m-T2
15 Total Critical Power for Uniform and Cosine Flux Distributions at G = 1.0 x 10⁶ M/HR-FT
16 Total Critical Power for Linear and Peaked Flux
FIGURE
17 Critical Locations (Inches from Inlet) for the Nonuniform Axial Flux Distributions Investigated at G = 1.0 x 10⁶ LBM/HR-FT 2
18 Total Critical Power for Uniform and Cosine Flux Distributions at G = 2.0 x 10⁶ LB/HF 2
19 Total Critical Power for Linear and Peaked Flux Distributions at G = 2.0 x 10⁶ LBM/HR-F'12
20 Critical Locations (inches from Inlet) for the Nonuniform Axial Flux Distributions Investigated at G = 2.0 x 10⁶ FT/R-2
21 Summary of Effect of Linear Increasing and De-creasing Flux Distributions on Total Critical Power
22 Summary of Effect of Peak Inlet and Exit Flux Distributions on Total Critical Power
23 Total Critical Power for Data of Bertoletti et al (Ref. 11)
24 Total Critical Power for Data of Swenson (Ref. 5)
25 Total Critical Power for Data of Babcock and Wilcox (Ref. 15)
26 Schematic Presentation of Method of Analysis
27 Bergles-Rohsenow Criteria (Ref. 35) for Incipient Boiling (q/A) = 15.60 P10156(TWALL-TSAT)2.30/p0.023 4 28 Variation of Two Phase Heat Transfer Coefficient
(h) with Mass Flow Rate (G) and Quality (X)
hTP per Dengler-Addoms Correlation (Ref. 38) 29 Typical Determination of Heat Flux Required for
Incipient Boiling, (q/A)g, at the Critical Location
30 Heat Flux Conditions Along Test Section Length
31 Operating Lines for Test Section 1271 for QTOT
Equal to and Less Than QCRIT
32 Critical Flux Results at G = 0.5 x 10⁶ LBM/HR-FT2
viii
FIGURE
34 Critical Flux Results at G = 2.0 x 10⁶ LBM/HR-W 2
35 Dimensionless Representation of Bergles-Rohsenow Nucleation Theory. The Effect of .imited Maximum Cavity Sizes is Shown for P = 100 psia (Z w t-.l)
Only
36 Uniform Flux Distribution Data of Hewitt et al (Ref. 41)
37 Operating Histories for Total Input Power up to the Critical Power (Uniform and Linear Flux Dis-tributions)
38 Operating Histories for Total Input Power up to the Critical Power (Cosine and Peaked Flux Dis-tributions)
39 Effect of Axial Flux Distribution on the Critical
Location
40 The Effect of M Value (Ratio of Maximum to Mini-mum Flux) on the Critical Location
41 The Effect of Inlet Subcooling on the Critical Location (Peak Exit and Inlet Flux Distributions) 43 Comparison of Critical Flux Results for the
Range of Mass Velocities Investigated
44 Effect of Length on the Critical Condition
45 Effect of Inlet Subcooling on the Critical Condition
46 Effect of Flux Shape Length on the Critical Condition for G = 1.0 x 10⁶ LBM/HR-T2
47 Effect of Flux Spike Length and M Value (Ratio of Maximum to Minimum Flux) on the Critical
Condition for G = 1.0 x 10 LBM/HR-F2 and
AHIN = -100 BTU/LBM
48 Critical Flux Results at 1000 Psia from Babcock and Wilcox Data (Ref. 15)
49 Estimation of the Critical Re ion Width (in
%
Total Input Power) of Figure for 1000 psia Data (Ref. 15)FIGURE
50 Critical Flux Results at 2000 psia from Babcock and Wilcox Data (Ref. 5)
51 Estimation of the Critical Region Width (in
%
Total Input Power) of Figure 50 for 2000 psia Data(Ref. 5)
52 Effect of Inlet Subcooling on Critical Flux Results for Cosine Flux Distribution with Flyx Spike (Ref.
x NOMENCLATURE Symbol AF A 3 Ax Di Cp Cl C7 Do E g G h H I k L L Variable Flow cross sectional area Inside surface area
Wall cross sectional area Inside diameter
Specific heat at constant pressure Constant associated with peaked inlet and outlet flux distributions defined by Eq. B-53
Constant associated with spike (Cosine Shaped) flux distribution defined by Eq. B-85
Outside diameter
Test section voltage drop Acceleration due to gravity Gravitational constant, 32.2
Mass velocity
Heat transfer coefficient Enthalpy
Test section current Thermal conductivity
Test section heated length
Length of cosine portion of test section length or spike length
(see Fig. 10)
Half-wavelength of cosine test sec-tion which is truncated to lengthQ,
(see Fig. 10)
Half-wavelength of cosine portion of test section which is truncated to length "' (see Fig..10)
Units ft2 ft2 ft2 inches btu/lbm0F inches inches inches volts ft/sec2 lbm ft-sec lbm/hr-ft2 btu/hr ft F btu/lbm amperes btu/hr ft0F inches inches inches inches
Symbol LX=O LS M P P r q/A,
0
Q r R Re T XXtt
u,x,y,z v V W Nomenclature (Continued) VariableLength of test section for peaked and spiked flux distributions de-fined in Fig. 10.
Location at which saturation condition is reached
Length over which quality condi-tion exists
Ratio of maximum to minimum flux Pressure
Prandlt number Heat flux
Integrated power input
Maximum cavity size required for nucleation
Overall tube resistance Reynolds number
Temperature
Quality
Martinelli-Nelson Parameter
Axial position indices (see Fig.
10)
Specific volume Velocity
Mass flow rate
Units inches inches inches dimensionless psia dimensionless btuAr-ft 2 btu/br ft OHM dimensionless OF lbm steam total lbm dimensionless inches ft 3/lbm ft/sec ibm/hr
xii ANN C CRIT EXIT f fg film G i IN INLET L MAX MIN OUT p S SAT SUB TOT TP V WALL u,x,y, z Subs ts
Tube length in annular flow condition Critical location Critical condition Exit Saturated liquid Liquid to vapor Film Gas
Required to initiate nucleation Inside, inlet Inlet Liquid Maximum Minimum Outlet Pump Saturation location Saturation condition Subcooled Total Two Phase Vapor Wall
p a 2'
0
or q/A Greek Letters Specific resistivityConstant associated with peaked flux distributions defined by Eqs. B-51 and B-73 Surface tension Shear stress Viscosity Kinematic viscosity Heat flux ohm/ft dimensionless lb /ft lbf/ft2 lbm/hr ft ft 2/hr btu/hr ft2
xiv
CONVERS
ENGLISH TO MTRIC (MKS, CGS ) PRESSURE (P)
UNIT MASS FLOW RATE (G)
HEAT FLUX (0) DENSITY (p) KINEMATIC VISCOSITY (7) VISCOSITY ( ) LENGTH (1) METRIC TO ENGLISH PRESSURE (P)
UNIT MASS FLOW RATE (G)
HEAT FLUX (0) DENSITY (p) KINEMATIC VISCOSITY (7) VISCOSITY (4) LENGTH (1) ION OF UNITS kg/cm2 = 0.0702Xpsia kg/m2sec = 1.361X10~3Xb/hr ft2 g/cm2sec = 1.361X10~4X b/hr ft2 watts/cm2 = 3.15X1O4XBrU/hr
ft2
kJ/m2sec =3.105X10-t3XBTU/ r f 22 gm/cm3 = 62.14Vxb/ft 3 cm2/sec = 3.88Xft2/hr gm/cm sec = 243Xb(m)/br ft mm = 25.4X in psia = 14.25Xkg/cm2 nb/hr ft2 = 735Xkg/m 2sec Ab/hr ft2 = 7350Xg/cm 2sec BTU/hr ft2 = 317OXwatts/cm2 = 322XkJ/m 2sec Ab/ft 3 = o.o16Xgm/cm3 ft2/hr = 0.258Xcm 2/see6(m)/hr
ft = 0.00412Xgm/cm sec in = 0.0394XmmCHAPTER I
INTRODUCTION
1.1 Background of the Problem
Forced convection boiling of water in axial flow is being utilized in pressurized and boiling water reactors and has been investigated as a means for cooling the nozzles of electro-thermal engines, electric-arc wind tunnels and nublear rockets. One of the most important limits in the thermal performance of such systems is the so-called critical or burnout condition. This condition is characterized by a sharp reduction in ability to transfer heat from the heated surface. Much test data are available for uniform heat flux distributions along the test section and numerous-correlations of these data have been pro-posed. However, in reactor
systems
as well as high temperatureflow nozzles mentioned above, 'the heat flux distributions are inherently nonuniform and possess such large gradients that the existing uniform flux burnout correlations are not appli-cable. In addition, although interpretation of the limited data available on nonuniform heat flux distributions varies as discussed in the literature survey of section 1.3, the overall conclusion is that certain non-uniform heat flux dis-tributions can significantly lower the critical heat flux com-pared to a uniform heat flux distribution under similar hydro-dynamic operating conditions. Therefore, it is highly desir-able for design purposes to have a satisfactory method for predicting the effect on the critical condition of nonuniform heat flux distributions which exist in practice.
-2-(a) A reasonably symmetrical flux distribution with
central peak, approximated by a "chopped" cosine. This corresponds to an end-of-core-life condition where the flux is not significantly perturbed by control rods or nonuniform burnup, or to a core with chemical control
(b) A flux distribution markedly peaked near the inlet
of the channel, corresponding to a new, clean core with control rods in the upper part of the core
(upflow); and
(c) A flux distribution markedly peaked near the exit
of the channel, corresponding to a maximum xenon override condition where the control rods are withdrawn but the upper part of the core has had less burnup.
In addition to these macroscopic flux distributions, there may be superimposed microscopic flux peaks which may occur at any point along the channel. These flux peaks may be due to nuclear effects (fuel peaks or water holes) or manufacturing dimensional tolerances (fuel thickness or eccentricity) and
are of some short but undefined axial extent. It is the purpose of this investigation to determine the effect of these types of axial flux distributions on the critical heat flux in the quality region by a systematic experimental and analytic investigation. The two quantities of interest are (1) the location of the critical condition and (2) the power input to the reactor channel required to cause the critical condition,
1.2 Scope of the Research
I A comprehensive experimental program was undertaken to
investigate nonuniform axial flux distributions under bulk boiling conditions. In addition to the flux shapes of direct reactor interest, additional nonuniform as well as uniform shapes were tested to permit more thorough analysis of the fundamental nature of the critical condition. Also the flux gradient was varied for several of the distributions tested as tabulated below to bracket and extend data available in the literature.
Approximate Ratio Maximum Flux Flux Distribution Minimum Flux
Uniform 1.0 Cosine 2.27, 4.03, 5.75 Linear Increasing 2.27, 5.75 Linear Decreasing 2.27, 5.75 Peak Inlet 5.75 Peak Outlet 5.75
Flux Spike (Step) 4.1 to 5.1
Flux Spike (Cosine) 2.27, 5.75, 7.00
The experimental program was run on the flow loop available in the Heat Transfer Laboratory of the Mechanical Engineering Department. Therefore the operating pressure was limited to
approximately 200 psia but the analytic results obtained from this data were successfully applied qualitatively to the
higher pressure regions of practical interest. The ranges of other operating and test section conditions are listed below.
TEST SECTION
Material - Aluminum Tubes
Inside Diameter - .214 Inches (.544 cm)
Heated Length - 30 and 48 Inches (76.2 and 122 cm)
Inlet Calming Length - 3.7 Inches (9.4 cm)
OPERATING CONDITIONS
-4-Mass Flow Rate - .5, 1.5 and 2.0x10⁶ lbm2(680,2040,
hr ft and 2720 kg/m2sec)
Inlet Temperature - 60 to 2900 F
Power - Direct Current Resistance Heating
Burnout Detection - Tubes Tested to Failure
It should be noted that several definitions of the critical
condition are used throughout the literature. Generally the def-inition selected by an experimenter is related to the burnout detection mechanism used. In this work since each tube was tested to failure, the critical condition is taken as the physical
destruction of the aluminum test section. Correspondingly the critical location is defined as the location of the test section failure.
1.3 Literature Survey
Review of the literature on the subject of axial heat flux
distribution reflects the developing interest in this area manifested by expanding experimental programs and more
sophis-ticated analytic procedures. However, as this literature is reviewed it should be noted that for all efforts except that of Becker(16) and Tong , which are the most recent, workers have attempted to characterise the results by intuitive judg-ments based on uniform flux results. Since uniform flux data indicates that the critical condition occurs at the exit where enthalpy is a maximum but heat flux is equivalent to that
all along the tube, it is not possible to distinguish whether the critical heat flux is governed by local or integrated conditions. Hence, in the case of nonuniform flux distribu-tions, we find some test results are interpreted to suggest that the critical heat flux is a function of local conditions along the nonuniformly heated test section, while other results
are interpreted to suggest that the total integrated heat transfer or exit enthalpy determines the critical condition which is therefore independent of the local conditions at
the critical location.
The seemingly perplexing part of this disagreement is that reliable data supporting each interpretation has been presented. In anticipation of the conclusions of this work
it can be stated that both the above interpretations can be shown to be correct, if each is viewed witbin the framework
of a broader interpretation of the critical phenomenn. That is, the critical condition is aphenomenon which, when represented
by the analytic model developed in this work, is dependent on
both local and integral conditions, the relative importance of each, depending upon the existing thermal and hydrodynamic conditions.
Among the earliest results were those of the Bettis Plant reported in the summary report by DeBertoli et al(l) which includes results of DeBortoli, Roarty and Weiss(2) and
Weiss(3). These results consisted of the two basic kinds of nonuniform heat flux experiments (1) gradual variation of
axial heat flux in cosine or other shape distributions where (d(q/A)/dx is small) and (2) axial step changes in heat flux commonly called hot-patch or spike tests.
The cosine tests reported by DeBertoli were for a
rectangular test section (0.055 in. x 2.116 in. x 27 in. or 0.14 cm x 5.36 cm x 68.5 cm) with 2000 psia (136 atm) water *Numbers in parentheses refer to references listed in the
-6-for a center-peak-to-minimum heat flux of 4.0 and maximum-to-average of 1.38. The critical condition always occurred between the peak flux location and the channel exit. A plot of local heat
flux vs. local enthalpy at the critical condition resulted in
a downward sloping curve which was approximately 70% of the critical heat flux calculated for a uniform flux distribution at the same mass flow velocity and exit enthalpy by the
Bell(4
) correlation. A surprising result was the observation that with the central peak in the cosine distribution the magnitude of average heat flux vs exit enthalpy when a criti-cal condition exists somewhere along the tube length would lie close (+15% to -25%) to a plot of critical heat flux vs exit enthalpy for the uniform flux distribution data.
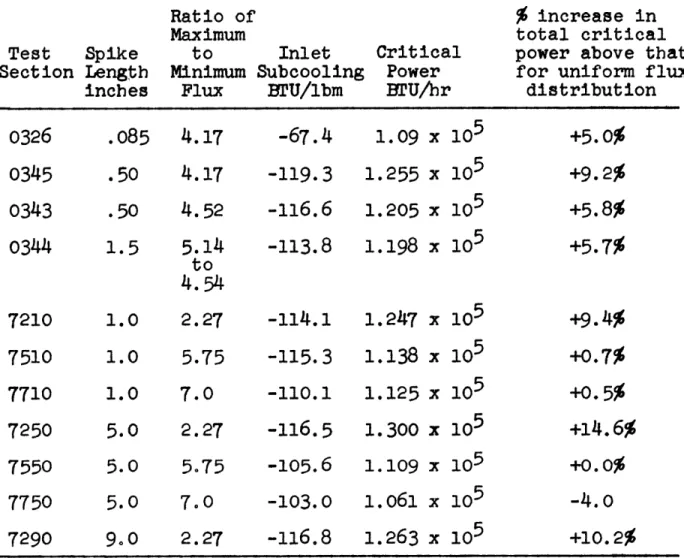
The hot-patch tests performed at Bettis utilized a rec-tangular channel (0.097 in. x 1.0 in. x 27 in. or 0.25 cm x
68.5 cm) with water at 2000 psia (136 atm). The first 26 5/8
in. (67.5 cm) of the channel were at a uniform heat flux 01 and the last 3/8 in. (0.95 cm) was operated at heat flux 02 where 02/01 was maintained at 1.98 throughout the tests. The results are shown in Fig. 1 where the upper curve is 02 at the critical condition and the lower curve is the corresponding magnitude of
#1=02/1.98.
Superimposed on this plot is thecurve for 031 the critical heat flux obtained for the same
exit enthalpy and flow rate when the channel is uniformly heated along the entire 27 in. (68.5 em) length. At around 60 OF
(33 00) exit subcooling,
02=03,
and at exit quality of around50%, 3 1i. It is seen that the ratio
decreases from around unity well in the subcooled region to near zero as quality increases. These results show that for the subcooled exit region, where E p=1, the equivalent hot-patch
heat flux must be achieved in the uniformly heated case to obtain burnout, hence suggesting the importance of local condi-tions in the burnout phenomena. On the other hand, in the 50% quality region, where E=O, burnout is achieved at the same exit enthalpy even though the hot-patch heat flux is greater than the uniformly heated tube flux. This suggests that the integrated conditions are of prime importance in this region.
These initial results illustrated the existence of non-uniform flux effects and indicated the need to allow for these
effects in design, particularly since these distributions could lower the critical heat flux from that expected by extrapola-tion of uniform flux distribuextrapola-tions data. The next investiga-tion in this area was an extensive program performed by
Swenson et al(5), with 2000 psia (136 atm) water for cosine distributions with central peak, central peak with spikepeak near inlet and peak near outlet in 0.411 to .446" dia. (1.04 to
1.17 cm) and 72 in. (183 cm) long tubes. The flux spike tests
were very limited but did indicate a decrease in effective-ness, EP, as the exit quality increased in agreement with the Bettis results. However, in this case the quality range was limited to approximately 30% to 24%. For the,
central-peak flux distribution, the data at the critical location was about one-half of the magnitude of (q/A)crit at the same enthalpy in a tube with uniform flux distribution.
-8-The data for both skewed coeine distributions were still
lower. The average heat flux vs exit quality (critical condi-tion existing between the locacondi-tion of the peak flux and the exit) agreed reasonably well with (q/A)crit vs.exit enthalpy for uniform flux distribution for the central peak and the peak-near-outlet data but the data for peak-near-inlet fell much below this. These results indicate that when additional flux distributions are considered, the apparent success ob-tained with cosine and central peak distributions in comparing the average critical heat flux to the critical heat flux for uniform distributions cannot be generalized. This fact should
be borne in mind in the following discussion of other programs which have achieved success in applying such techniques or their
variations to cosine shape distributions only. From a practical point of view, these techniques of simple comparison with, or extrapolation of, uniform heat flux data give reasonable answers when applied to cosine distributions and can be used in these cases. However, for the important cases of peaked inlet and outlet distributions, these techniques fail dramatically and thus indicate that these methods are not based on a correct fundamental interpretation of the critical phenomena.
Reported programs in this group which deal exclusively with the cosine flux distribution include that of Janssen and Kervinen (6), Casterline and Matzner (7, Shaefer and Jack 8 ),
Lee and Obertelli(9 and Loee(lO). Janssen and Kervinen carried out experiments for cosine, and
truncated-cosine heat flux distributionsfor an annulus (0.54 in. x
the inner rod heating 1000 psia (68 atm) water. The ratios of maximum flux to minimum flux, M, were 1.86, 3.25 and 3.5. In all cases the inlet was subcooled and the operation was reported to be stable without noticeable flow oscillations. The data from these experiments was analysed by plotting local heat flux versus local quality for all points on the cosine test section at the critical power on the same curve with similar data for uniform flux distributions as represented by a General Electric
correlation for such data (see Fig. 2). Assuming that the critical condition depends only on local conditions, the point of tangency between these curves will allow prediction of (1) the burnout location and (2) the power level at burnout. Based on this type of analysis, the cosine data was about 9 to 20%
lower than predicted. Considering that (1) the actual burnout location was uncertain to at least +1 inches due to placement
of thermocouples whose temperature rise was monitered and (2)
that the uniform rod data upon which the correlation was based had a deviation of the same order as above (9 to 20%), the
method predictsthe cosine distribution behavior well. However, it should be noted that using the same uniform correlation and
the integrated burnout concept, the cosine average heat is also
within 20% of the uniform critical heat flux. Thus for cosine
data of reasonable steepness, predictions of comparable
accuracy can be obtained with the two basically divergent views of the burnout phenomenon.
Similar results were obtained in the high mass flow range
(G 23.0xl06 lbm/hr ft2) by Casterline and Natzner(7) who carried
-10-.400 inch diameter (1.02 cm) tube with water at 1000 psia
(70.2 kg). However for lower mass flow rates, the cosine tube cm
supported higher heat fluxes for the same local conditions than the uniform tubes. Thus for lower mass flow rates, analyses based on both local and average conditions fail for this dis-tribution with the rather extreme ratio of MAXIMUM FLUX/
MINIMUM FLUX =
34.8.
However this discrepancy may be due to the presence of reported severe pressure oscillations which were probably due to the inherent compressibility existing in the void fraction in the long tube since the inlet conditions were in all cases subcooled.Limited but interesting data applicable to nozzle cooling applications was obtained by Schaefer and Jack(8 ) for central
peak shapes at very high heat fluxes. These experiments were performed with tubes having heated lengths of 1.5 and 5.5 in.
(3.81 and 14.0 cm), .120 in. (.304 cm) diameters in 200 psia
(14.0 m2) water. The flux gradient was large since the heated cm
length was short and M large (5.88). The experiments were run at high mass velocity (G = 4.0x10⁷ lbm 2) and yielded high
hr ft
local critical heat fluxes (q/A = 4.0x10⁷ -B 2)' Hence this hr ft
data which is outside the normal range of variables is avail-able for comparison with new methods of analysis.
Extensive additional tests with cosine flux distributions have been reported by Lee and Obertelli(9) and Lee(1()). These experiments were performed with 60 to 144 in. (152 to 366 cm) tubes of diameters .373 or .383 in. (.95 or .975 cm) in water at pressures of 550 to 1600 psia (38.6 to 112 akg). The first
cm
second report contains data from the 144 in. long tubes at 1000 psia only. These reports show that the average heat flux condi-tion for estimating burnout is satisfactory. This condicondi-tion
can be expressed as the equivalence of the average cosine heat flux with the critical uniform heat flux under the same thermal and hydrodynamic test conditions or simply as equivalence of total input power to the test sections in each case. The reports also introduce another prediction method based on the integrated condition concept. In this case prediction of burn-out power and location is obtained as the point of intersection between cosine and uniform data on a local heat flux versus length plot. However, the length used on this plot for the uniform case is an equivalent length which is defined as
LE r 9 h OMZXcos( )dz
where O(Z) = heat flux on the cosine tube at a point distant
(Z) from the inlet. In this manner, for each location on the cosine tube, an equivalent length of a uniform tube is defined such that the local heat fluxes and integrated power inputs are the same at that point (Z) for uniform and cosine heat flux distributions (see Fig. 3). Using this refined method good results for the critical power and location are achieved for the range of cosine shapes tested (M=5.0).
Only three additional investigations have been completed utilizing flux distributions other than the cosine shape. Bertoletti et al(11) tested rods 25.4 in. long (64.5 cm) of
.318 in. diameter (.807 cm) in water at 1020 psia (71.5 kg/cm 2).
decreas-
-12-ing flux distributions in addition to cosine and uniform dis-tributions. In all nonuniform distribution cases the maximum flux to minimum flux ratio, M, was about 2.3. The data was presented to show the equivalence of total power input for test
sections of all flux distributions for the same thermal and hydrodynamic test conditions. Review of the data confirms this equivalence for the cases of inlet quality above saturation. However for subcooled inlet conditions, which are of direct interest to many practical applications, divergence of total power input of up to 10 to 20% between the various flux dis-tributions is apparentwith the exit peaked distribution
exhibiting the lowest allowable total power. Additional CISE data reported by Silvestri(12) further indicates that the total power input is not independent of flux shape for subcooled
inlet conditions. In these experiments,heat was added uniformly over only the first and last quarter of the tube with the
middle half being unheated. The data showed that for, subcooled inlet conditions,the total power for the nonuniform flux dis-tribution was also up to 10 to 15% below that for the uniform flux. Such deviations, which were also previously pointed out for exit peaked shapes in Swenson's data of reference (5), are of direct consequence to reactor design for the control-rods-withdraw configuration. In addition this deviation illustrates that the total power input equivalence concept is not valid over the complete range of nonuniform flux distributions of interest. The experiments of Styrikovich et al(13) were performed in
6.3 in. (16.0 cm) long tubes of diameter .236 in. (.6 cm) in
water at 1470 and 2000 psia (103 and 140 2). The outside
diameter of the test sections varied linearly (increasing and decreasing) with length, hence the flux distribution varied as the square of the external diameter. Results with subcooled
inlet conditions, which did not exhibit flow pulsations, indi-cated that the local critical heat flux for both increasing and decreasing flux shape was greater than the uniform critical heat flux at the same iraet _ronditions. In addition for the
linearly decreasing flux, the onset of the critical condition occurred near the inlet as contrasted to the CISE
tests where it was detected by wall thermocouples to set at the tube exit in all cases. To explain these results, the proposal is advanced by Styrikovich that the deviation of the upstream heat flux distribution from uniform causes an attendent devia-tion in vapor content in the boundary layer. Postulating that the vapor content in the boundary layer is effective in aiding or retarding the vapor film formation which causes the critical condition, higher upstream heat flux is predicted to promote achieving the critical condition while the reverse holds for
lower upstream heat flux levels. This qualitative explanation has been modified and adopted in part in the analysis of the data of the present investigation.
Duke(14 ) performed a series of critical heat flux and
film heat transfer coefficient measurements with an exponential decreasing flux distribution (M=27.0) in 36 in. (91.5 cm) long tubes of .187 in. (.476 cm) diameter in water at 535 to 1915 psia (37.5 to 134.5 kdi). The range of mass flow rates
inves-cm 6
tigated was limited to the rather low values of .01 to .24x10 lb/hr ft2 (13.6 to 325.0 k ). The results for both critical
-14-heat flux and -14-heat transfer coefficient were correlated by statistical techniques and hence application of these correla-tions outside the limited range of variables investigated is
very questionable.
Additional investigations with varied nonuniform flux dis-tributions are presently being carried out' in the USA and
Sweden. The U.S. work is being performed at Babcock and
Wilcox Co. on 72 in. (183 cm) long tubes of .446 in. (1.13 cm) diameter in water at pressures of 1000, 1500, and 2000 psia
(70.2, 105 and 1140.14 -). The flux distributions include
cm(5)
those of the previous Babcock and Wilcox work as well as several of the same distributions tested in annular configura-tions. The most recent progress report(15) tndicated that the data agreed well with that of their previous program.
Preliminary Babcock and Wilcox review of this latest data indi-cated that analysis based on local condition hypothesis was not valid whereas analysis based on the integrated average critical heat flux or the input power to the critical location looked promising. Such an analysis is a variation of the total input power equivalence but realistically considers only the power
input to the critical location.
The Swedish work(16 ) is being performed for linear
increas-ing and decreasincreas-ing flux distributions in .236 in. and .394 in. (.6 cm and 1.0 cm) long tubes. The local burnout heat flux data is apparently predicted by the correlation of
Becker(l7) when the nonuniform heat flux is accounted for in the related heat balance equation. The basic correlation is a
simplification of the results of Isbin(lS) which assumes the critical condition to occur at the axial position where the annular liquid film disappears. Becker achieves simplification of Isbin's model by assuming based on his own data for uniform tubes that the critical condition is a function of local condi-tions only. The success of this local condition hypothesis in predicting the critical heat flux for linearly increasing flux distributions is not surprisingsince in this case the local flux and local enthalpy are both a maximum at the critical
location. However, this is not the case for linearly decreasing flux where upstream burnout may occur and here the accurate predictions obtained may be significant. However a significant drawback of the entire procedure is that the critical location is not predicted and in fact the calculation of critical heat flux requires knowledge, presumably to be supplied from experi-mental data, of the critical location. However since the
completed report is not yet available, comprehensive critical review of this method of analysis is not yet possible.
The most recently published work is that of Tong et al(l9) in which the hypothesis is forwarded that the critical condi-tion occurs when the enthalpy of a superheated liquid layer adjacent to the heated surface reaches a limiting value. The superheated layer is presumably formed and maintained by a bubble layer which isolates it from the core. The limiting
enthalpy value of nonuniform flux cases was taken equal to that for a uniform flux. Using this approach a correction factor, F, was defined to enable prediction of nonuniform behavior from existing uniform data.
-16-it
q DNB, equivalent to uniform flux
q DNB, local in nonuniform flux
The analytic expression for F is a function of (1) local criti-cal heat flux, (2) a constant C which was determined to be a function of local conditions and (3) an integral of local heat flux weighted by the factor eC(DNBz). Thus we see F
combines local (1 and 2) and integrated (3) effects in a manner determined by the model chosen. This method is applied to
experimental data of many varied flux distributions yielding predicted F values within + 25% of experimentally determined
values. While this agreement does not significantly improve the accuracieb available from other schemes, the method does yield the following significant result. In the subcooled
and low quality region, the factor C is large and thus the product C (lDNB-z) is small. This reduces the weighting
fac-tor and results in local conditions primarily determining the critical condition. Conversely for high qualities, C is
small and integrated conditions primarily determine the criti-cal condition. Using a basicriti-cally different model for the
critical condition, this same dependence of the critical condition on local versus integrated conditions is obtained
in the present work.
From the foregoing review of the literature, we see that most attempts to deal with nonuniform flux effects have been
based a priori on a concept that the critical condition is a
phenomenonrelated to either local or integrated conditions.
Significantly these attempts have satisfactorily predicted behavior over only narrow parameter ranges. In addition their apparent
successful interpretations of similar data from diametrically opposite viewpoints has lead to much confusion. The efforts of Becker(16) and Tong 19 while not yet pointing the way to a general satisfactory solution of the problem, have been based
on postulated models of the heat transfer and critical phenomenon. In the case of Tong in particular, the application of the model itself to the various nonuniform flux distributions determines the relative importance of local versus integrated conditions. Such an approach seems to be the most reasonable method of analysis and it is along these lines that the subject investi-gation has been directed. However, to fully comprehend the
formulation of the model which has been applied, it is necessary to review what is known regarding the flow of water and steam in heated tubes. In the next chapter,- therefore, the subject of two phase flow in tubes with heat addition will be discussed as it relates to the subject experiment.
-18-CHAPTER II TWO PHASE FLOW WITH HEAT ADDITION
To provide a sound basis for the developments presented in Chapter IV, the present understanding of two phase flow in tubes with heat addition will be reviewed.
2.1 Flow Regimes
Consider a cylindrical tube with vertical upflow of water under forced convection being electrically resistance heated. Adapting the, discussion of Milioti(20) let us review with reference to Fig. 4 the dominant flow regimes and
associa-ted heat transfer mechanisms which will ideally exist along the tube. Coolant water entering the bottom of the tube is below the
saturation temperature corresponding to its pressure. In Sec-tion 1, where subcooled water exists forced-convecSec-tion governs the heating process.
As the water temperature approaches the saturation value, the surface temperature reaches the saturation temperature. As soon as the surface temperature exceeds the saturation tempera-ture by a few degrees, the liquid immediately adjacent to the heated surface becomes superheated. In this condition, if the degree of superheat is sufficient, bubbles can form along the surface at suitable nucleation sites. Under certain conditions bubbles have been found to slide along the wall surface in the direction of flow, As the bubbles grow larger, they detach from the wall and enter the fluid stream where they collapse because of the cooler bulk stream temperature. This Section, 2, is the subcooled nucleate boiling region.
When the bulk stream temperature reaches saturation, the bubbles can now be sustained in the turbulent flow of water. This Section, 3, is the saturated nucleate boiling region char-acterized by very high heat transfer rates. It is in
this region that the quality of the two-phase flow begins to increase. The bubbles cause a very high turbulence in the
superheated liquid, as they grow and detach themselves from the wall. This intense turbulence of the liquid upon the surface accounts for the high heat transfer rates in this bubble flow region. As more and more bubbles form at the wall and join the bulk stream, they start to coalesce and form larger bubbles. This tendency is expected, because a large bubble has less
surface area than the equivalent volume of small bubbles and thus there is a tendency for bubbles to agglomerate. The flow
is now unstable under all conditions, and eventually slugs
of intermittent water and steam give the hydrodynamic pattern
called slug flow as shown in Section 4.
Downstream from Section 4, the steam slugs begin to pre-dominate and the steam increases in proportion to the water to the point where it can now be considered the continuous phase.
A thin film of slow moving superheated liquid forms on the wall,
while the steam flows in the central core. The liquid film thickness is of the order of thousandths of an inch and has a wave-like surface. The steam moves with a much higher velocity than the liquid film, resulting in high heat transfer coeffic-ients and an annular slip-type flow shown in Section 5. There is usually also a spray of small droplets in the steam core, hence, the name spray-annular flow region. Through Section 5,
-20-the liquid
film
flow rate on the wall decreases due to net entrainmept of liquid from the film and evaporation of the film. Depending on the local heat flux and quality, nuclea-tion can also occur within the thin liquid film. Heat transfer can be though of primarily as conduction through the liquid film with evaporation at the liquid-vapor surface.When Section 6 is reached, the liquid film has disappeared, the wall is dry, and one finds tiny droplets of water in the steam. As soon as the liquid film is destroyed and the wall dry, the evaporative cooling of the wall breaks down, causing a very large decrease in the heat transfer coefficient with a correspondignly large increase in wall temperature. In Sec-tion 7, single-phase dry saturated or superheated steam is present. Because only single-phase steam is present in this region, it can be considered a film boiling region. However, the heat fluxes which can be carried under this condition are considerably lower than those which can be carried with non-film boiling.
From this discussion, it is seen that the critical condi-tion can be caused by at least two different mechanisms, (1) in the subcooled or low quality region by a vapor blanketing
of the tube wall, or (2) in the high quality region by dryout
of the liquid film. In fact, the occurrence of the critical condition can also be postulated to be caused by a nucleation
induced disruption of the liquid film or by the instability
to quantitatively identify the existence of the various flow regimes possible and the transitions between these flow regimes. Flow maps exist for predicting this information for adiabatic
systems but since the effects of heating tend to distort the regime boundaries, such maps are not an accurate representation
of conditions with heat addition. Generally speaking, heating may be expected to promote the transitions between the regimes shown in Fig. 4 so that for given pressure and mass flow rates these transitions occur at lower qualities than in the adiabatic case. In particular the bubbly flow region may be suppressed and the flow may go directly from single phase to slug flow. Similarly the slug-annular transition may occur at lower quality. From limited results reported at high pressures by
Suo(21) and at low pressures by Lopina (22), such expectations seem to be borne out.
With regard to the low pressure conditions of the subject tests, the corrections to an adiabatic flow map due to heating are small since the flow regime transitions occur at relatively low qualities. Considering the test conditions and the dimen-sions of the test sections, the relevant flow regime map for these experiments is presented in Fig. 5. The transitions pictured are limited to the transitions to annular from both bubble and slug.
At high mass velocities the annular transition is taken from the correlation of Baker. (24) For these conditions, the slug regime is suppressed and the transition occurs directly from bubbly to annular flow over the quality range of
approxi-
-22-maetly 6 to 10%. It should be recognized that at a given mass flow rate this transition to annular flow is gradual and intermediate flow regimes are probably encountered before true annular flow is achieved. As Fig. 5 shows, this transi-tion describes conditransi-tions in the region of the test condi-tions investigated. Due to non-adiabatic condicondi-tions, addi-tional uncertainties in the actual location of the flow regime transition are introduced. Hence a mean value of 8% was chosen to characterise the annular transition for all three flow rates of the subject data.
For completeness, the annular transition at lower flow rates is also illustrated on Fig. 5. At these low flow rates, the transition is from slug to annular flow and was
calculated from the correlation of Haberstroh and Griffith. (23) 2.2 Critical Heat Flux
Prediction of the critical heat flux for uniform flux
distribution is necessary in this study for two reasons: (a) a uniform flux distribution correlation is required to evaluate published correlation methods for nonuniform flux distributions such as that of Janssen et al(6) and Lee(lo).
(b) test runs with uniform distribution should be checked
against available correlations to insure that operating procedures and the experimental rig are performing satis-factorily.
Unfortunately there is no existing low pressure (14.7 to 200 psia) quality range correlation which is applicable over a wide range of test conditions and geometries. In fact data in this region is limited to that of Lowdermilk and Weiland(25), Jens and Lottes (26), Lowdermilk, Lanzo and Siegel(2),
Becker (28), Becker and Persson (17) and Lopina(22). From this
datag four correlations are available which use certain of this data as indicated below:
CORRELATION DATA SOURCE
Lowdermilk, Lanzo and Siegel(27) Lowdermilk, Lanzo and #Siegel (7
Von Glahn(29) Lowdermilk, Lanzo and Siegel (27)
MacBeth(30)
Lowdermilk and Weiland(25) 15 Jens and Lottes(26)
psia Becker(28)
250
psia
Becker and Persson(l7) Becker(28) , Becker and Persson(17)
The correlation of Lowdermilk, Lanzo and Siegel(27) is based on their data obtained at inlet temperature of 759F
atmospheric exit pressure, and diameters from 0.051 inches
to .188 in. The correlation establishes two burnout regimes: a
high velocity, low-exit quality regime for G/(L/D)2< 150 correlated by (q/A)CRDO.2(L/D)0.1 5 = 1400 G0.5
-24-and a low velocity, high exit quality regime for G/(L/D)2 >150
correlated by
(q/A)CRD0.2(L/D).85 = 270G0.85
The correlation of Von Glahn(29) is intended to cover
cryogenic fluids as well as water over the pressure range 14.7 to 2000 psia. The correlation is based on a relationship
developed between Xc, a critical vaporization parameter, and a function consisting of several dimensionless groups. Specifi-cally
GD P r0.4 0.4 1.7
X () NB
c 1.3 41 pv IL
Flow Fluid Property
Parameter Parameter
where X =
NBv = ~ 2
J
PeP'NB g )1.5
the functional relation f being graphically described in the
NASA report.
The MacBeth correlation(30) also represents data as either a high-velocity or a low velocity regime with the boundary
between regimes defined graphically. For a system pressure
p <200 psia, and a L/D K200, the maximum mass velocity for
6
2existence of a low velocity regime is .25x10 lb/hr ft2. Thus the data for this report lies within the high velocity regime which is given as
6 A + *CD(Gxl0-6A q/Ax10 - 1+CL where A=y0 D (Gx1062 J4 -6 75 C y3D (GxlO
)
D inchesThe "y" coefficients obtained by MacBeth by computer optimization of data at various pressures are
psia 250 psia yO 1.12 1.77 yJ -0.211 -0.553 y2 0.324 -0.260 y3 0.001 o.o166 y4 -1.4 -1.4 y5 -1.05 -0.937
Finally the correlation of Becker(l7) as discussed in Chapter I covers the pressure range 142.5 to 195.0 psia. The correlation, which is based on extension of the flow model of Isbin(l8) is presented as curves of
1 1/2 versus XCRIT
q/A( )
where XCRIT - the steam quality at the critical location
q/A =surface heat flux, 2
- mass velocity.*
F m2m S
Each of thacorrelations together with the uniform flux distributlon data of this report are plotted in Figs. 6, 7, and
-26-is obvious. In addition the dependence of critical heat flux on pressure for the MacBeth correlation is opposite to that for the Becker and Von Glahn correlations. In appraising these figures the following conclusions can be drawn (the deviation between stable and unstable points will be discussed in
Chapter III).
(1) The MacBeth correlation contains only the early and
limited data of Lowdermilk and Weiland(25), which is suspect to flow instabilities as described in the later report by
Lowder-milk(27), and the data of Jens and Lottes (26) which was taken at
low flow rates (.01 to .04x10-6 lb/hr ft2) in large diameter (.94 in) tubes. Hence this correlation would not be expected to yield reasonable results for the subject test conditions.
(2) The Von Glahn and Lowdermilk correlations are based on Lowdermilk(27) data which had limited diameters (up to .188
inches) and a single subcooling. Thus as discussed by Lopina 22) for the test diameters of the subject test data, these correla-tions are not applicable.
(3) The Becker correlation yields good agreement with
results at low flow rates (G = 0.5x10⁶ lb/br ft2). As flow
rate increases, the agreement becomes poorer.
(4) The 250 psia prediction of MacBeth's correlation agrees well with the data. However the data is at generally lower pressures than the pressure for which the correlating line was established.
These results indicate that the available low pressure corre-lations do not appear to be based on the correct fundamental vari-ables. Hence although each is satisfactory over the range of data from
which it was derived, none can be safely extrapolated to the desired region of the subject test conditions. Therefore, the best empirical procedure for representing the present data appears to be use of a simple equation of the form,
q R= C1 + AM where the constants can be
-28-CHAPTER III EXPERIMENTAL PROGRAM
3.1 Description of Apparatus
The following section contains a description of the experi-mental facility and test sections which was used in this inves-tigation. This was divided into four categories: the hydraulic
system, the power supply, the associated instrumentation and the test sections. Although detailed descriptions of the apparatus
are available in other reports,(31) they are repeated here for the convenience of the reader. The basic apparatus had been designed and constructed in a previous study by Bergles.(32)
3.1.1 Hydraulic System
A schematic of the flow loop is shown in Fig. 9. The
pipings and fittings, all of brass and stainless steel for corro-sion resistance, are erected around a test bench constructed of Dexion slotted angles and plywood. Rayon reinforced rubber hose was used where flexible connections were required. Flow circu-lation is provided by a Fairbanks Morse two-stage regenerative pump (260 psi at 3.6 gal/min) driven through a flexible coupling
by a 3 HP Allis Chalmers induction motor. To avoid
contamina-tion of the system water, the pump was fitted with special seals of teflon-impregnated asbestos. A relief valve set for
300 psi protected the pump casing from overpressure.
The main flow loop contains a Jamesbury ball
valve to control the overall pressure drop. The test section line, installed in parallel with the main loop can be isolated
loss upon test section failure,upstream and downstream check valves-were built into the test section connector pieces. The upstream valve contains a spring sized to hold the valve open during normal operation with system pressure on either side of the valve but closed at test section failure with system
pressure upstream and ambient pressure downstream. The down-stream valve is simply held open by system pressure during normal operation but closed at test section failure by the pressure difference between the back system pressure and the ambient test section pressure. The test section flow rate is controlled by means of Jenkins needle valves set just upstream and downstream of the test section itself. The valve down-stream is particularly useful in adjusting test section pressure. The test section line also contains two basic
Fischer-Porter flowmeters with the appropriate isolating valves. Four Chromalox heaters of approximately 6 kw. each are also
provided to control the test section inlet temperature. Three of these are controlled simply with "off-on" switches while the fourth can provide a continuous range from 0 to 6 kw. by means of a bank of two variacs mounted on the test bench. Pressure fluctuations at the outlet of the pump are damped out by means of a 2.5 gallon Greer accumulator charged with nitrogen to an initial pressure of 40 psi. This accumulator contains a
flexible bladder-type separator which prevents the nitrogen
from being absorbed by the system water. A Jamesbury ball valve isolates the accumulator from the loop at shut-down.
Since the system is closed loop, the heat added to the system water is rejected to a shell-and-tube heat exchanger
-30-connected to a city water line. Due to seasonal temperature variations, the minimum operating temperature varies from
approximately 500F in the winter to 750F for summer operation. Continuous deionization and deoxygenation is provided in a parallel loop containing four resin beds, two of which provide deionization and the other two, deoxygenation. The conductivity
of the loop water may be maintained at 1.5 x 10⁶ ohm-cm as read on a Barnstead meter. In order to insure a minimum of dissolved air in the system, a 5 gallon degassing tank was provided with five electrical heaters (3-220 VAC and 2-110 VAC), This tank was also used to provide makeup water to the system. A storage tank for filling the system and degassing tank was mounted
above the degassing tank and could be filled with distilled water from standard 5 gallon bottles with a small fypro pump. Both the storage tank and the degassing tank were equipped with glass sight gages so that the proper levels could be maintained.
3.1.2 Power Supply
Power was supplied to the test section by means of two 36 kw. Chandrysson externally excited generators, each capable of delivering 3000 amperes at 12 volts. The generators are
driven by
440
volt-3 phase-600 rpm synchronous motors.The power could be regulated from zero to maximum power as desired through a portable control console. The generator outputs were connected in series and the output from one was added to or subtracted from the output of the other. Water-cooled shunts, installed in parallel with the test section,
burnout.
An existing buss-bar system was used, with the addition of air cooled copper braided cables just at the test section. The use of these flexible cables permitted flexibility in the size of the test section which could be accomodated. At the up-stream end of the test section, the cable assembly is clamped to an aluminum plate to which a rigid aluminum test section holder is attached. At the downstream side, the connection to the test section holder is accomplished by a flexible braided conductor. This entire connection to the test section was put in tension by a spring arrangement to assure adequate allowance for thermal expansion of the test section. The test section holders were made of aluminum plate in two segments which, when bolted together, clamped to a bushing surrounding the test
section. The downstream end of the test section was connected to the piping with rubber hose to provide electrical insulation
and increased flexibility. 3.1.3 Instrumentation
Instrumentation was provided to monitor the steady-state and transient conditions throughout the system. Pressure gages on the main loop, as indicated in Fig. 9, aid in adjusting the pressure level in the test section and in determining system
stability. A thermocouple was installed in the degassing tank to monitor the water temperature during degassing operations.
Another at the discharge of the pump insured that the water temperatures in the deionizing beds never exceeded 1400F. A variety of metering tubes and floats which could be installed
-32-provided measurement of the test section flows from 1.5 to
4000
lbm/hr. The results were calibrated at installation andchecked periodically against the initial calibration.
The test section itself was instrumented with thermocouples to record inlet and outlet water temperatures. In both cases, the thermocouples were located at positions where the flow was well-mixed. At the downstream end, the thermocouple was
located far enough from the exit of the heated section so that it could be safely assumed that the vapor fraction is completely condensed.
Thermocouples were constructed from Leeds and Northrup 24-gage duplex copconstantan wire. Calibrations were per-formed and deviations from N.B.S. standard tables were found to be slight so that no corrections were necessary. All of the
thermocouples were connected to a common ice junction through a twelve position Leeds and Northrup thermocouple switch. The
output could be read on either a potentiometer or a recorded. The recorder is a pen-type, single channel instrument manufac-tured by Minneapolis-Honeywell Brown. There are five manually selected ranges for o-6, 5-11, 10-16, 15-21, and 20-26 milli-volts. Occasional calibration against the potentiometer
insured the accuracy of the recorder to within .01 millivolts, Test section pressures, both upstream and downstream were monitored on 4 1/2 inch U.S. gage supergages with 0-200 psi
range. Each gage was checked on a dead weight tester and cali-brated to an accuracy of approximately .5 psi over the entire
range. They were checked against one another periodically at various static pressure levels under zero flow conditions.
Porous-plug snubbers were provided to protect the geges from
severe pressure fluctuations.
The heat input to the test section was computed from measurements of the voltage drop across the heated length and
the current to the section. The voltage drop was read on a Weston, multirange d.c. voltmeter with a specified accuracy of ±1/2% of full scale. The current was inferred from the
voltage drop across an air-cooled N.B.S. shunt with a calibra-ted conductance of 60.17 amps/m.v.
3.1.4 Test Section
The required flux shapes were obtained by machining the tube outside diameter to obtain the desired variation in wall cross-sectional area since electrical power generation is directly proportional to resistance. The design was made
within the limits imposed by (a) available power and hydraulic
supply (b) test conditions and geometries desired for
investi-gation and (c) materials having adequate resistivity and machinability. A discussion of the interplay between these variables and the final test section designs is presented in
Appendix C. Confirmation of the shape of the experimental flux distribution was obtained on a sampling basis by room temperature incremental resistance measurements and by 100%
inspection of resultant outside diameter dimensions. Details
of the results of these procedures and discussion of other
factors affecting the shape of the experimental flux distrib-ution are included in Appendix A. See Figure 10 for schematic presentation of the various test sections used in the inves-tigation.