Publisher’s version / Version de l'éditeur:
Journal of the Acoustical Society of America, 68, 1, pp. 184-190, 1980-07
READ THESE TERMS AND CONDITIONS CAREFULLY BEFORE USING THIS WEBSITE. https://nrc-publications.canada.ca/eng/copyright
Vous avez des questions? Nous pouvons vous aider. Pour communiquer directement avec un auteur, consultez la première page de la revue dans laquelle son article a été publié afin de trouver ses coordonnées. Si vous n’arrivez pas à les repérer, communiquez avec nous à [email protected].
Questions? Contact the NRC Publications Archive team at
[email protected]. If you wish to email the authors directly, please see the first page of the publication for their contact information.
NRC Publications Archive
Archives des publications du CNRC
This publication could be one of several versions: author’s original, accepted manuscript or the publisher’s version. / La version de cette publication peut être l’une des suivantes : la version prépublication de l’auteur, la version acceptée du manuscrit ou la version de l’éditeur.
Access and use of this website and the material on it are subject to the Terms and Conditions set forth at
Eigenmode analysis of the interference patterns in reverberant sound
fields
Chu, W. T.
https://publications-cnrc.canada.ca/fra/droits
L’accès à ce site Web et l’utilisation de son contenu sont assujettis aux conditions présentées dans le site LISEZ CES CONDITIONS ATTENTIVEMENT AVANT D’UTILISER CE SITE WEB.
NRC Publications Record / Notice d'Archives des publications de CNRC:
https://nrc-publications.canada.ca/eng/view/object/?id=1ca331fc-8fb1-4737-b72a-8f7cbbea9cf2 https://publications-cnrc.canada.ca/fra/voir/objet/?id=1ca331fc-8fb1-4737-b72a-8f7cbbea9cf2S e r
THl
N21d
no. 900
cop.2
NATIONAL RESEARCH COUNCIL
OF
CANADA
CONSEIL NATIONAL DE RECHERCHES DU CANADA
EIGENMODE ANALYSIS OF
THE
INTERFERENCE
PATTERNS IN REVERBERANT SOUND FIELDS
Reprinted from I
1
Journal of the Acoustical Society of America Vol. 68, No. 1, pp. 184-190, July 1980
DBR Paper No. 900 Division of Building Research
:
ana
E
lysis of the in1
reverberant sound ficl"-
terfer
erns
'.
T.
ChuNoise and Vibration Section, Division of-Building Reseorch, National Research Council of Canada. Ottaw
Ontario, KIA OR6. Canada
meceived 4 March 1980; accepted for publication 26 March 1980)
Results for the interference pattern in a reverberant sound field have been aenvea oy m a n s UI an eigenmour: analysis and compared with tesults obtained from the free-wave model. It is found that the incoherent 01
random nature of the sound field assumed in the free-wave model can only be achieved if the room is excited by random noise. For single frequency excitation an equivalent incoherent field can be approached by additional averages of results over many different source locations. The analytical solutions are supported by a computer study based on the eigenmode model. A detailed discussion about the correction factor due to boundary interferences in relation to sound power measurement is also given.
PAC3 numbers: 43.55.Br, 43.55.Ka, 43.20.K~
INTRODUCTION = ( x , y , z ) due to a simple source Q e - j W t a t ro=(xo,yo,zo] can be written as 6 s 7
In a few recent evidence was presented in support of the view that the eigenmode and the free-
wave models of the sound field in a reverberation cham- ~ P W Q
p =
-
e - i ~ tber were consistent. For example, the spatial cross- V
&
AN(k2 $N(r)JIN(ro)-
k; +2ik6,)'
correlation function, the spatial variance of the mean- square pressure $', and the interference patterns at
the boundaries of a rectangular reverberation chamber where the origin of coordinates is a t one corner of the have been demonstrated t o be derivable from either chamber, N stands for the t r i o of numbers I,m,n and model.
This par
ear
..
bounc . A)er will show that the interference patterns A ~ = ~ / E , ~ ~ C ~ , E ~ = ~ and e , = 2 for i # O , i a r i e s can also be obtained by both methods
provlaea the assumptions involved a r e compatible. qN(x, y , z ) = C O Sc o ~ k ~ y c o s k ~ ~ ~
,
'hus it is necessary to differentiate between single f r e -
uency excitation and random noise excitation. k = - In k=m-r k,=
-,
nn G=k:+k;+k:, L,' L y 9An important application of the prediction of boundary L
,
interference patterns is in sound power measurement.The inaccuracy in obtaining a true room-average mean- square pressure, when sampling is limited t o the cen- t r a l portion of the room, can be compensated for by means of a boundary correction factor. In view of the current results, such a factor will be reexamined in greater detail.
I. EIGENMODE THEORY OF STEADY STATE SOUND Let us consider a rectangular room of sides L,, Ly, L, and volume V =L,L&,. The sound field a t the point r
k = w/c is the wavenumber, p is the density of the medium, and is the specific normal admittance of the chamber surface assumed to be r e a l and small. It is noted that only t e r m s near k, =k contribute significantly because the damping,term 2k6, is usually small. In t e r m s of complex notation, the mean-square pressure
F 2
can be obtained a s $(pp*) where the bar denotes time averages and*
denotes complex conjugate. Using Eq. (1) to form the mean-square value givesEquation (2) is the basic formula t o be used in the fol- this paper the distinctions between these three cases I
lowing study of interference patterns near boundaries, will be properly considered. i.e., the variation of
p 2
a s afunction of distance from.boundaries. It is expected from Eq. (2) that answers II. RANDOM-NOISE EXCITATIONS
might be different for three different types of excita- The normalized spatial cross-correlation function tion, namely, random noise excitation with single under narrow -band noise excitation was investigated source position, pure-tone excitation with single source previously5 by implicitly assuming that no two mode's position, o r averaging over many source positions. In have the same frequency. Although this assumption 184 J. Acoust. Soc. Am. 68(1), J U I ~ 1980 0001-4966/80/070184-07$00.80 @ 1980 Acoustical Society of America 18,
alized Sp
does not affect the norm:
atiai
'cross -emre: tion function, nor the i n t e r ~ e r e n c e patterns to be st- died here, it does change the absolute values of the mean-square pressure. In the present study, such a n assumption is not used. Recognizing the fact that the empty rectangular room can be considered a s a linear time-invariant system, Eq. (2) can be treated as the input -output relationship for a particular sour ce-field points pair.' Thus if the source emits random noise of equal energy (i.e., white noise), the mean-square pressure a t the field point can be obtained by integra- ting Eq. (2) over frequency assuming Q2 and0
to be constants, i.e.,A closed-form solution can be obtained for the integral in Eq. (3) only for the case with N = M but not otherwide, i.e.,
In order to a s s e s s the importance of t e r m s involving N # M, a numerical computation of the integral of Eq. (3) has been carried out for a number of values for k, and k, around a frequency of 1 kHz with room charac- teristics corresponding to NRC's big reverberation chamber. These a r e shown in Table I. Good compari- son between results from the numerical integration and the closed form solution of Eq. (4) for cases in- volving k,=kN serves a s a check of the accuracy of our numerical method. As indicated by the results of Table I, the main contribution comes from t e r m s with N = M because the values of the integral a r e large for N=M, and the $'s for both the source and the field points a r e always positive, whereas, those for N # M can be positive o r negative and tend to average out to very small contributions. Thus in general Eq. (3) can be approximated as
Then if one i s interested in narrow-band analysis, Eq. (5) can be rewritten a s
where
C
' denotes summation over only those modes whose characteristic frequencies lie within the band- width of interest.Tabulation of nume&al ~ l ~ :$@e*&iij ' & ~
fiq. ~ J J L Ua number ~ of values for k N and k ar~qnd a frer,
34 -
quency of 1 Wz. The d u e of theihtegrzil 6 h d s only&&
I ~ N - ~ M I -
Val1 ue of integ
A
It is interesting to note that absence of cross-prod1 t e r m s between modes in Eq. (6) means that phase r e - lationship between modes is not important in forming the mean-square pressure. For a linear time-invari system, a stationary random input gives r i s e to a sta tionary random output. The above observation will establish a criterion for characterizing the :
a s being deterministic or random.
sound fie.
. - . - - .A
It is well known that a source at a corner can excirc the maximum number of modes; this condition will bc taken in the following analysis. (The extent to which different source positions can affect the results will 1
left t o Sec. N. -Computer Study .) For high frequen- cies, the number of normal modes being summed in Eq. (6) .d still very large s o that summation can be
converted into integration over wavenumber space.7 Since only those modes whose characteristic frequen. cies lie within the bandwidth of interest a r e to be sun med, the corresponding limits of integration over the wavenumber space must be for an interval Ak around kc, the wavenumber of the center frequency of the bal The modal density d ~ / d k, a t wavenumbers around k, is given by k: v/2r2. Considering only the oblique modes, which dominate a t high frequencies, E'S may be set equal to 2 and Eq. (6) can be changed
ant
x J A ~ o s 2 ( k , x ) cos2(ky y) cos2(ker)) dk,
,
(7
where S =2( L , L y + L y L a + L , L , ) is the surface i r e a of the chamber and () denotes an average over the surface of an octant of a sphere of radius k, and thickness dk, in the wavenumber space. Changing from'rectan- gular to spherical coordinate systems for the wave- number space it follows:
k, = k, sine cos@
,
k, = k, sin0 sin@,
k, = k, cose.
The () average of Eq. (7) becomes. . .
1 r 12 r 12
I,
11 +cos(2kNxsin0 cosg) +cos(2kNy sine sin@) +cos(2kNz cos0) +cos(2kNx sin0 cosq5) cos(2kNy sin0 sin$) +cos(2kNx sin0 cos@) cos(2kNz cose) +cos(2kNy sine sin@) cos(2k& cos0)+cos(2kNx sine cos@) cos(2kNy sine sin@) cos(2kNz cos0)} sine de d @
.
Equation (8) is similar t o the integral obtained by Waterhouseg when he formulated the problem in t e r m of the free-wave model. This is no surprise because what WaterhouSe averages, in t e r m s of the waves
coming from different directions, i s physically equiva- lent to what a r e being averaged over the wavenumber space arising from the summation of the different ex- cited modes. Using Waterhouse's result for the ,inte- gral, one obtains
where jo(a) =sin(a) /a,
5;=X2+y2, 5 ; = 2 + z 2 , 5 ; = y 2 + z z , r 2 = x 2 * J ? + z 2 ; The integral of the type
1"
'
dk,,1
required when Eq. (9) is substituted into Eq. (7) has been considered by Cook1' who concluded that it is equal to PURE-TONE EXClTATlO ! phase rl o accounl r t h e r dis .. .- elationsh
t.
Such a :cussion ; ip betwef : field i s bout the.
* -*...-.-, n the me: . L - L . . ~..
m modes deflnitelj coherent ate articl B free-w: :onclusio! . - . Tor a single source positiopressure under pure-tone excitation is given ~y qq. ( 4 ) .
Argument based on the sign of the Jl's alone is not suf-
ficient to justify neglect of the cross-product t e r m s
between modes for this narticular case. In other words,
t h
int Fu
case will be given in a DCY-. .e.LL It SI
say that one cannot expect thl we mode
t o be applicable here. This ( n is also
fled by the computer h d y reparted in Sec. IV. has t o bt I not r'mt
.
nature o 3 taken lom. rf this lffices t o 1 results veri- 1% over rt t e r m s The situation is quite different when ~averagilsource positions is applied. The cross-produc
between modes a r e effectively eliminated by the ortho- gonality properties of the characteristic function. With the help of
Sin(ka) A k + t e r m s of the order of
k a Eq. (2) cap be rewritten as:
where k = (k, +k,) /2 and A k =k,
-
k,. It follows that fornarrow-band analysis, the variation of the mean- - 1
PwQ
,
$2N(r)2 r w 1 s z (
.
)
7
AN[(k2 -k$), +(2k6,).]square pressure normalized by the asymptotic value
becomes where
[ I ,
signifies averaging over all possible sourcepositions in the room. In other words an equivalent
[h
'(4 /h2(0011Aw = 1 +jo(2kcx) +jo(2kcy) +jo(2kcz) random field has been achieved by the source position+jo(2kc 5,) +jo(2kc 5,) +jo(2kc 5,) averaging technique. Such a technique has also been
used by Chien and Soroka3 in deriving the cross-cor-
+jo(2kcr )
,
(lo) relation function.
a result identick1 to that derived from the free-wave
Using the same high-frequency argument a s
model for an incoherent reverberant field.g With the
it can be shown that Eq. (14) becomes, with 6 =
proper choice of the variables x, y, and z , Eq. (10) can be considered as a repkesentation of the interference
pattern from a corner of a room.
*
Other interference patterns from edges and planes
can also be derived from Eq. (19). For example, the
interference pattern from the edge represented by the 0-x axis of the room is obtained by substituting the
variables (x,, y, z ) in Eq. (10) where xl is the root
point on the 0-x axis. Provided the root point is not too close t o the corner, for high frequencies considera-
tion, the following approximations :
jo(2kcx,) =jo(2k,S ,) =jo(2kc5 ,) =jo(2kcr)
-
0,
will simolify Eq. (10) t o
[ ~ 2 ~ ~ 1 , Y ,z) /h2(-)IAw = l +jO(2kcy) +jo(2kcz) +j0(2kc5 ,),
which is again the same
as
that given by Waterhousegfor the interference pattern from an edge. Similar a r - gument will show that the interference pattern from the
before,
:ss/v,
where () is given by Eq. (9). The modal density d ~ / d k ,
at any wavenumber kN is k$ v/2.rr2 and the limit of inte-
gration for this case is from 0 to 00 because the summa-
tion in Eq. (14) is for a l l possible values of Chien and
Soroka3 have shown that,
Thus combining results from Eq. (15) and Eq. (16), the normalized mean-square pressure for pure-tone ex- citation with averaging over source positions can be written as:
x-z plane a t the root point (x,, O,z,) which is not close +jo(2k5
,I
+jo(2k5,) +j ,)t o an edge o r a corner is given by
[F"(x,y,z,) J F 2 ( ~ )
l A w
= l +jo(2kcy).+jo(2kr)
,
(17)(I2) which has the same form a s Eq. (10). Thus it can be
Equation (1 2) also agrees with Waterhouses's r e ~ u l t . ~ concluded that the free-wave and eigenmode models
a r e consistent fc averaging over a IV. COI It is r MPUTER brthe car lource po STUDY
d that analyses given m me previou tivo sections a r e high-frequency asymptotic solutions. A more direct approach by carrying out the actual sum- mations of the allowable modes in Eqs. (2), (6), and (14) would be instructive and desirable. This type of cal-
culation is currently being carried out using a Nova 820 minicomputer. An in-depth computer study of the reverberant sound field i s beyond the scope of the pre- sent paper and will be presented later, but in the mean- time some pertinent results will be given in this sec- tion to support the analytic analysis.
In this computer study, all types of modes were in- cluded except the dc component due to the (0,0,0) mode. For cases of pure-tone excitation with or without averaging over source positions, Eqs. (14) and (2) show that the main contribution to comes from terms with
k , ,= k. The total number of modes to be summed was
governed by an arbitrary chosen criterion that
IkZ
-
k2,.,1 c 100, which turned out to be quite adequate.For the case of narrow-band analysis, the total num- ber of modes being summed was dictated by the r e - quirement that the modal frequency be within the band- width of interest. The bandwidth chosen was 1/3 octave. Since there i s no way of establishing
5:
in this study, the boundary points had to be tied to the theoretical values and values of all the other points to be normal- ized by the boundary points accordingly. Dimensions and ab'sorption characteristics of the boundaries of the room were chosen to simulate conditions of theNRC
big reverberation chamber and these a r e summarized in Table 11. The Schroeder large room limit'' for this room is slightly above 31 5 Hz.
Interference patterns in front of a plane boundary a s well a s from a corner have been computed for a large
TABLE 11. Summar~r of room characteristics used in the com- puter study. Room dimensions: A mx 6.5 mx 4.9 m.
Wall absorption characteristics
f
Specific normal admittance125 0.0023 160 0.0030 200 0.0028 2 50 0.0027 315 0.0028 400 0.0030 500 0.0032 630 0.0033 800 0.0035 1000 0.0035 1250 0.0037 1600 0.0038 2000 0.0043
'Note: For 1/3 octave narrow-band analysis, B has been assumed to be uniform. The smallest value of 0.0023 was used for all frequencies.
187 J. Acoust. Soc. Am., Vol. 68, No. 1, July 1980
FREQUENCY. Hz
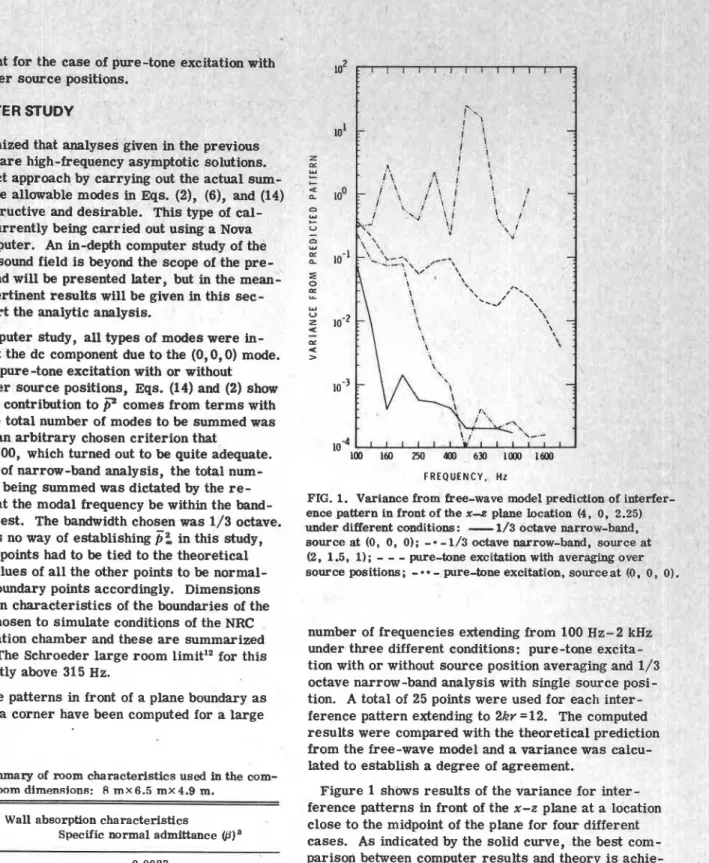
FIG. 1. Variance from free-wave model prediction of interf ence pattern in front of the n-e plane location (4, 0, 2.25) under different conditions:
-
1/3 octave narrow-band, source at (0, 0, 0);- -
1/3 octave narrow-band, source at (2, 1.5, 1);- - -
pure-tone excitation with averaging over source positions;-
-
pure-tone excitation, sourcnumber of frequencies extending from 100 Hz-2 kHz under three different conditions: pure-tone excita- tion with or without source position averaging and I/: octave narrow-band analysis with single source posi- tion. A total of 25 points were used for each inter- ference pattern extending to 2kr = 12. The computed results were compared with the theoretical predictiol from the free-wave model and a variance was calcu- lated to establish a degree of agreement.
Figure 1 shows results of the variance for inter- ference patterns in front of the x-z plane at a locatio close to the midpoint of the plane for four different cases. As indicated by the solid curve, the best com- parison between computer results and theory i s achie ved for the l/3 octave narrow-band analysis with the sound source at a corner of the room. The agreemen i s very good down to 160 Hz a s illustrated by the ac- tual comparison between the computed pattern (open circles) and the theoretical curve shown in Fig. 2. Agreement deteriorates at low frequencies, however, when the sound source was not located at the corner a s
indicated by the dash-dot curve in Fig. 1. The reason being that most of the modes a r e no longer fully ex- cited.
The dash-dot-dot curve of Fig. 1 shows no agree- ment between the computer results and prediction of the free-wave model at all frequencies for the case of pure-tone excitation with a fixed source position. This
PIG. 2. Cc
.I--- -* 1-
terference patterns in front of the x-z
~ L U : a b LUG~CLUU j r , 0, 2.25); O1/3 octave narrow band at 160
Hz, source at (0, 0 , 0); O pure-tone excitation at 2 kHz with averaging over source positions; pure-tone excitation at 1.25 kHz, source at (0, 0, 0).
the statement made in Sec. III that the field
.a definitely not random for this case. A plot of the omputed pattern (solid circles) at 1.25 kHz i s shown
I Fig. 2 to indicate the degree of disagreement. As
ointed out in Sec. I11 also, an equivalent random field result can be approached by averaging over all pos- sible source positions. The dash-dash curve of Fig. 1 suggests that this is true at least at high frequencies. This is more clearly demonstrated in Fig. 2 where the computed pattern (half solid circles) at 2 kHz is also plotted.
Similar conclusions can be drawn from the computer results of interference patterns from a corner. A few examples of the computed pattern a r e shown in Fig. 3 t o show the degree of agreement with predictions from the free-wave model. Good comparison with theory i s obtained even at 160 Hz for the case of 1/3 octave nar- row-band analysis with the sound source at a corner, and reasonable agreement with theory can be achieved for the case of pure-tone excitation with averaging over many source positions at high frequencies.
V. CALCULATION OF TRUE ROOM-AVERAGED VALUE OF
p2
The accepted procedure for obtaining a true room- average value of
F 2
in relation to sound power mea- surements in reverberation chambers'3914 is to sample the mean-square pres6ur.e in the central portion of the room at least X/2 away from any boundaries and apply a correction factor to account for the buildup offi2
near the boundaries. Such a procedure has been recom-
mended indiscriminately for cases with random-noise or pure-tone sources. In view of the new results pre- sented here, it is worthwhile to reconsider this cor-188 J. Acoust. Soc. Am., Vol. 68, No. 1, July 1980
ler along a FIG. 3. Computed interference patterns from a corn L
line with 0 = 0.8 rad. and 6 = 0.3 rad. 0 1/3 octave = r u n d
at 160 Hz, source at (0, 0, 0) ; O pure-tone excitation at 2 kHz
with averaging over source positions; plre-tone excitation at 1.25 kHz, source at (0, 0. 0).
rection factor under the different conditions of tion. A more direct approach will be taken in t
lowing developments using the point source formulation. excita- :he fol-
A. Narrow-band noise analysis-single source position
The mean-square pressure at any location, r, i s given by Eq. (6). Applying Eq. (13), the true room- average value of
p2,
denoted by(p2),
can be written a s :On the other hand, if the sampling of
3'
i s to be done in the central region of the room X/2 from all boun-daries, the sample-mean value of
F Z
will be different from the true room-average value. Using the c--"-uous sampling concept, the sample -mean value obtained by integrating Eq. (6) over the volume terest, that is:
; U I I L l l I
-
! can be
of in-
where V' = (L,
-
X) (L, - A ) (L,-
x).
It can shown that(20) for k x , k,, k, not equal to zero and {} = L~
-
X if ki = 0.A correction factor, COR, can thus be computed using Eqs. (18), (19), and (20):
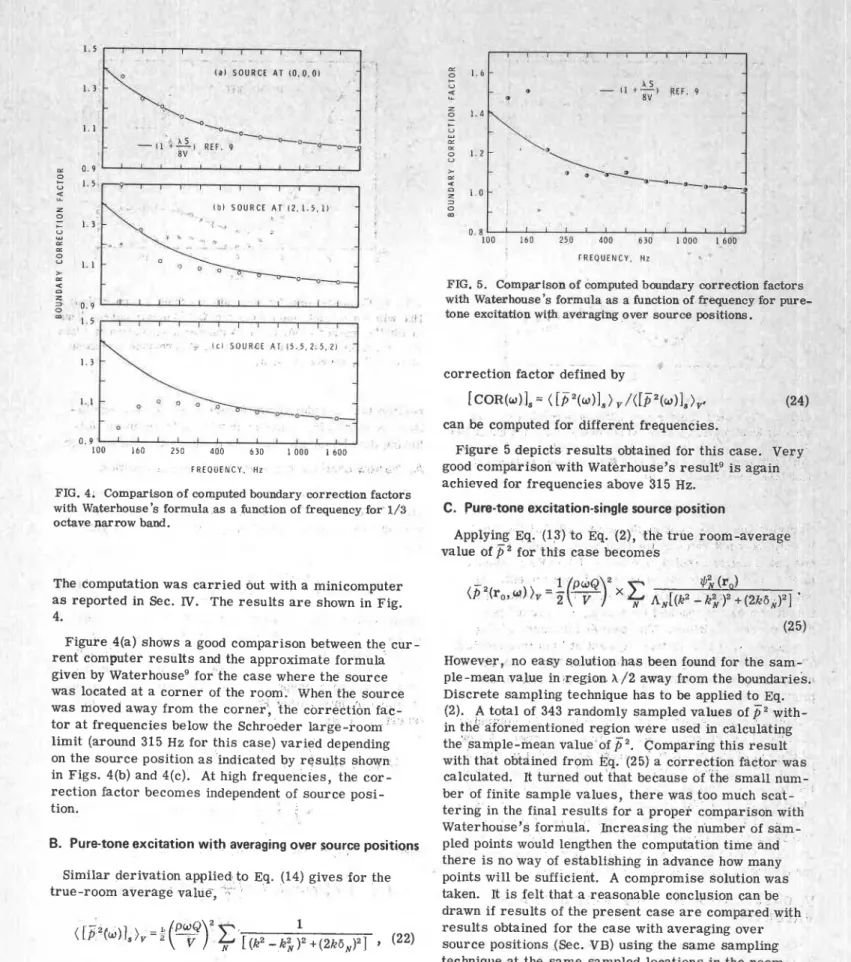
( a ) SOURCE I1 I;+ R E F . P - T- av I I I I I I I I L L z ( b l S O U R C E A T 1 2 . 1 . 5 . 1 1
-
0 - 1.3 V "J rr = 0 1 . 1-
> rr -c L3 0 . 9 " ~ l l l l " l t ' i l 1 0 0 1 6 0 2 5 0 4 0 0 6 3 0 1 0 0 0 1 6 0 F R E Q U E N C Y . H zFIG. 5. Comparison of computed boundary correction f&ctc with Waterhouse's formula as a function of frequency for PI
tone excitation with averaging over source positions. correction factor defined by
can be computed for different frequencies.
Figure 5 depicts results obtained for this case. Ve good comparison with Watbrhouse's resultg is again
achieved for frequencies above 315 Hz.
F R E Q U E N C Y . Hz
FIG. 4, Comparison of computed boundary correctian factors
with Waterhouse's formula as a function of frequency for 1/3 C. pure-tone excitation-single source position
octave narrow band.
Applying Eq. (13) to Eq. (2), the true roon value of
p2
f o r this case becomesThe computation was carried but with a minicomputer a s reported in Sec. IV. The results a r e shown in Fig. 4.
However, no easy solution has been found for m e sai ple-mean value in'regian k/2 away from the boundar Discrete sampling technique has to be applied to Eq.
(2). A total of 343 randomly sampled values of
pZ
win the afbrementioned region were used in calculating the sample-mean value of
p2.
Comparing this result with that obtained from kq. (25) a correction factor was calculated. It turned out that because of the small num- ber of finite sample values, there was too much scat- tering in the final results for a proper comparison with Waterhouse's formula. Increasing the number of s a m - pled points would lengthen the computation time and there i s no way of establishing in advance how many points will be sufficient. A compromise solution wastaken. It is felt that a reasonable conclusion can b e drawn if results of the present case a r e compared with results obtained for the case with averaging over source positions (Sec. VB) using the same sampling technique at the same sampled locations in the room. A comparison of results i s shown in Table I11 for two different runs,: one with the source a t (O,O, 0) and the other a t (5.5,2.5,2).
Figure 4(a) shows a good comparison between the cur- rent computer results and the approximate formula given by Waterhouseg for the case where the source was located at a corner of the room. When the source was moved away from the corner; 'the correctibn fac-
a .
tor a t frequencies below the Schroeder large -room limit (around 315 Hz for this case) varied depending on the source position a s indicated by results shown in Figs. 4(b) and 4(c). At high frequencies, the cor
-
rection factor becomes independent of source posi- tion.ith-
B. Pure-tone excitation with averaging over source positions
Similar derivation applied to Eq. (14) gives for the true-room average value,
and for the sample-mean value,
It i s intBresting to note that although the interference patterns for this case of pure-tone excitation with sin- gle source position do not agree with theory (see Sec.
IV.), the boundary correction factor concept for sam-
0
0
0
C
A N[a2
-
a:
+ ( z a a ~ ~ ],
(23) where {} { } {} i s defined by Eq. (20). Thus a similar189 J. Acoust. Soc. Am., Val. 68, No. 1, July 1980
, -
r With
using 343
Run #la Sou1
TABLE In. Comparison of boundary correction factors for the case of pure-tone excitation with and without averaging
rer source positions sampled positions.
-
Run #2
Frequenq rce dith Source
(Hz) [ Isb 0,O)
[I,
at (5.5,2.5,2)125 1.77 4 1.34 1.44 160 1.54 - - ~ 5 1.52 1.19 200 1.33 1.25 1.20 1.05 2 50 1.21 1.28 1.23 1.10 315 1.08 0.91 1.01 0.90 400 1.31 1.28 1.08 0.99 500 1.24 1.16 1.14 1.21 630 1.07 1.03 1.16 1.22 800 1.16 1.08 1.06 1.11 1000 1.14 1.23 1.01 0.92 1250 1.06 1.01 1.11 0.99 1600 0.97 0.94 1.01 1.19 2000 1.00 0.93 0.98 0.89
Note: The randomly sampled positions between Runs + 1
and #2 were different; this accounts for the differences in re- sults for the case with averaging over source positions in the two runs.
[ I, = avera ging over many source positions.
pling in a limited region still appears t o be appro- priate, possibly due to some s o r t of averaging effect a s indicated by the reasonable agreement of results with the case of averaging over source positions.15 This result is significant in that if provides an accep- table argument for extending Waterhouse's boundary
correction factor concept even to the case of a single source emitting a single frequency.
1
VI. CONCLUSIONAt high frequencies, closed-form solutions for the interference patterns near boundaries have been ob- tained from an eigenmode analysis, and found to agree with those predicted from the free-wave model. The
incoherent o r random nature of the sound field r e - quired by the free-wave model can be achieved only with random-noise excitation. For pure-tone excita- tion, an equivalent quasirandom field can be approached by averaging over many source locations.
The analytical solutions a r e further supported by a computer study which reveals the departure of these interference patterns from predictions a t low frequen- cies and/or for different source positions other than that a t a corner of the room. The computer study con- f i r m s that the free-wave model prediction does not apply to the case of pure-tone excitation with single source position
A more direct approach based on the eigenmode model has been taken for investigating the boundary correc- tion factor concept proposed by Waterhouse in obtaining
190 J. Acoun. Soc. Am., Vol. 68, No. 1, July 1980
sting e r the
r e s
true room-average value ( 80 intere:
ults came out of this study: (1) The Schroed large-room limit seems to s e t a low frequency limit above which the free-wave and eigenmode models agree in the case of 1/3-octave band analysis irrespective of source positions. Even for pure tone excitation a similar conclusion is reached, if averaging is done '
over many source positions (the computation were for all possible source positions). (2) The usual boundary correction factor also appears t o be of the right order for the case of pure-tone excitation with single source position although the sound field is not random in this case. Current results seem t o indicate that the cor- rection factors a r e similar t o those for the case with averaging over source positions. Thus t o improve the law-frequency situation, an obvious solution, both for cases of pure-tone and random noise excitation is to average over several source positions.
ACKNOWLEDGMENT
This paper i s a contribution from the Division of Building Research, National Research Council of Ca- nada, and is published with the approval of the Direc- tor of the Division.
'c.
T. Morrow, J. Sound mb. 16, 29-42 (1971).'R. V. Waterhouse and R. K. Cook. J. Acoust. Soc. Am. 59, 576-581 (1976).
3 ~F. Chein and . W. W. Soroka, J. Sound Vib. 48, 235-242 (1976).
'R. V. Waterhouse and D. W. van Wulfften Palthe, J. Acoust. Soc. Am. 62, 211-213 (1977).
5 ~T. Chu, . J. Sound Vib. 62, 309-311 (1979).
%. M. Morse, Vibration and Sound (McGraw-Hill
,
New York , 1948), 2nd ed.'p. M. Morse and K. Uno Ingard, Theoretical Acoustics (Mc- Graw-Hill, New York, 1968), p. 595.
's.
H. Crandall and W. D. Mark, Random Vibration in Mechan-ical Systems (Academic, New York, 1963), Chap. 2.
'R. V. Waterhouse, J. Acoust. Soc. Am. 27, 247-258 (1955). 'OR. Cook, R. Waterhouse, R. Berendt, S. Edelman. and
M. Thompson, Jr., J. Acoust. Soc. Am. 27, 1072-1077 (1955).
"w.
T. Chu, 6'Comments on the coherent and incoherent Nature of a Reverberant Sound Field." submitted for publication in J. Acoust. Soc. Am.1 2 ~ . R. Schroeder, J. Acoust. Soc. Am. 34, 1819-1823 (1962). I3ANs1 Standard S1.21-1972, "Methods for the determination of
sound power levels of small sources in reverberation rooms" (American National Standard Institute, 1430 Broadway, New York, NY 10017).
14'L~etermination of sound power levels of noise sources-pre- cision methods for discrete-frequency and narrow-band sources in reverberation rooms", IS0 3742-1975 (E) (hter- national Organization for Standardization, Geneva, Switzer- land).