Cerebral Cortex July 2011;21:1593--1601 doi:10.1093/cercor/bhq221
Advance Access publication November 17, 2010
Rapid Adaptation of Visual Search in Simulated Hemianopia
Sara Ann Simpson1, Mathias Abegg1,2,3and Jason J. S. Barton1,2,41
Department of Medicine (Neurology),2Department of Ophthalmology and Visual Sciences, University of British Columbia, Vancouver, V5Z 3N9 Canada,3Department of Ophthalmology, University of Bern, Bern, Switzerland and4Department of Psychology, University of British Columbia, Vancouver, V5Z 3N9 Canada
Address correspondence to Jason J. S. Barton, Neuro-ophthalmology Section K, VGH Eye Care Center, 2550 Willow Street, Vancouver, British Columbia, Canada V5Z 3N9. Email: [email protected].
Patients with homonymous hemianopia have altered visual search patterns, but it is unclear how rapidly this develops and whether it reflects a strategic adaptation to altered perception or plastic changes to tissue damage. To study the temporal dynamics of adaptation alone, we used a gaze-contingent display to simulate left or right hemianopia in 10 healthy individuals as they performed 25 visual search trials. Visual search was slower and less accurate in hemianopic than in full-field viewing. With full-field viewing, there were improvements in search speed, fixation density, and number of fixations over the first 9 trials, then stable performance. With hemianopic viewing, there was a rapid shift of fixation into the blind field over the first 5--7 trials, followed by continuing gradual improvements in completion time, number of fixations, and fixation density over all 25 trials. We conclude that in the first minutes after onset of hemianopia, there is a biphasic pattern of adaptation to altered perception: an early rapid qualitative change that shifts visual search into the blind side, followed by more gradual gains in the efficiency of using this new strategy, a pattern that has parallels in other studies of motor learning.
Keywords: artificial, attention, eye movements, hemifield, recovery
Introduction
Homonymous hemianopia is a common condition in which there is loss in both eyes of the visual field contralateral to the side of a lesion of the pathway between the optic chiasm and striate cortex. This can impair tasks such as reading, driving, and walking (Zihl 1999; Tant et al. 2002). The difficulty of hemianopic subjects with detecting objects in the environment can be shown experimentally with visual search tasks (Zangemeister et al. 1995; Zihl 1995, 1999). Compared with subjects with full fields, hemianopic subjects fail to detect targets more often and display less systematic scan patterns, in which they use more fixations, smaller saccades, longer search times, and longer scanpaths (Tant et al. 2002).
However, up to 40% of hemianopic patients show some spontaneous compensation for their visual loss by 12 weeks after onset (Zihl 1995; Zihl et al. 2009). Visual search tasks can also index the efficacy of compensation: Patients with residual difficulties in daily life are more likely to use longer scanpaths and make more fixations during search (Zihl 1995, 1999) and spend more time scanning the side of the hemianopia (Pambakian et al. 2000). Whether the nature of the cerebral injury causing hemianopia has additional effects on search or the degree of compensation is a matter of debate. Both the volume and the location of brain injury may have an impact, with occipitoparietal and posterior thalamic lesions having particularly deleterious effects (Zihl et al. 2009). On the other hand, it has also been suggested that
altered search performance is not correlated with duration since injury, the severity of the field defect, or the side of injury (Zihl 1999).
Disentangling the effects on visual search due solely to the visual field from possible effects of extrastriate cortical damage is difficult in patients because of the variable anatomic contours and usually large volumes of tissue affected by human pathology. Also, studies of compensation in hemianopic subjects are limited to more long-term effects, as few patients can be studied in the immediate aftermath of their insult, and such studies cannot distinguish strategic changes from neural recovery and/or plasticity. With strategic changes, behavior is adapted to substitute alternate means of accomplishing a task, whereas in the latter case, function is restored because of recovery of damaged tissue or redistribution of function to other surviving cortex. In hemianopic search, the latter effects can be postulated even if the hemianopia persists, if some of the abnormalities in search reflect not the hemianopia but independent behavioral abnormalities from additional extras-triate damage (Zihl 1995).
Studies of healthy subjects with simulated hemianopia can therefore be useful. These can show the effects on search attributable to visual loss alone as the subjects by definition have no cortical damage. In this regard, several studies have used gaze-contingent techniques to simulate hemianopia (Tant et al. 2002; Machner et al. 2009; Schuett et al. 2009a; Schuett et al. 2009b, Mitra, 2010). These have reproduced many fea-tures of the ocular search patterns seen in real hemianopia, such as longer search completion times, more fixations used, longer scanpaths, and more scanning on the hemianopic side. However, these studies disagree as to whether the simulations show that all key aspects of altered search behavior in hemianopia can be explained as adaptations to the field defect or if they cannot and therefore suggest a contribution from damage to other visual or attentional processes.
Similarly, simulated hemianopia can provide useful informa-tion on how behavior adapts to altered visual input. Changes in performance over time in simulated hemianopia are due only to strategic adaptation as there is no cortical damage to recover or to circumvent. Also, simulations can be used to study behavior immediately after onset of the field defect to determine how rapidly adaptive changes develop at a time scale that would be impossible in real patients. This has not been examined in detail yet, with only one group reporting improved reading and visual search after 15 min of practice with simulated hemi-anopia (Schuett et al. 2009a, 2009b). Delineation of the deficits and strategic changes over time related solely to hemifield loss can provide important benchmarks for our understanding and interpretation of effects seen in pathological hemianopia and the efforts directed at its rehabilitation.
In this report, we created artificial hemianopias in healthy subjects, using a gaze-contingent computerized display. We had 2 main goals. First, we examined the pattern of fixations and saccades over the entire experiment to determine the similarities between the behavior in simulated hemianopia and that reported previously for pathological hemianopia. Given the mixed conclusions in prior studies of visual search in simulated hemianopia, this was important to establish what changes should be studied in our second and chief goal, which was to examine the temporal profile of strategic adaptation of visual search, independent of issues of recovery or plasticity, to determine if behavior showed significant adjustments in the period immediately after onset of a hemianopia.
Materials and Methods
Subjects
Ten healthy subjects participated (males= 7 and females =3), with
median age of 28 years (range: 26--36) and median education of 19 years (range: 17--27). All subjects were right-handed and had corrected visual acuity of 20/20, with full visual fields to confrontation testing. No subject had a history of neurologic or ophthalmologic disease. The protocol was approved by the institutional review boards of Vancouver General Hospital and the University of British Columbia, and all subjects gave informed consent in accordance with the declaration of Helsinki.
Apparatus
Eye movements were recorded with a desktop-mounted EyeLink 1000 video-based system (www.sr-research.com), a video-based tracker that monitors the pupillary red reflex and corneal reflex with a sampling rate of 1000 Hz. Subjects had their head resting comfortably on both chin and forehead rests directly. The task was presented on a 22$ NEC
FE2111SB monitor (140 Hz, 1024 3 768 pixels) with the screen
spanning 60° of visual angle horizontally and 48° of visual angle vertically at the viewing distance of 34 cm.
Prior to data collection, the EyeLink was calibrated by having subjects fixate on points on a 5- or 9-point grid (screen center, and halfway to screen edges in vertical and horizontal directions), which was then validated to an accuracy of less than 1.0° of error. Before each individual trial, the screen displayed a cross at center, which subjects had to fixate with a position error of less than 1° for 200 ms, for the trial to start. If not, a black dot appeared at the center and the subject was recalibrated.
Procedure
The screen displayed black uppercase Times New Roman letters that spanned 1° of visual angle, randomly positioned on a white background, the only provisos being that adjacent letters did not overlap and that there was equal number of letters on the right and left halves of the screen. The task was to find and count the number of letters ‘‘A’’ among 25 other letters (one of each of the rest of the alphabet). In each block, one trial had 4 As and the rest had 0--3 As, the number randomly determined. Subjects were told that there were between 0 and 4 targets: trials with 4 targets were not included in the analysis since subjects would terminate search once they found the fourth A. Subjects indicated the number of As found by a keypress, after which the display was replaced by the fixation cross at center.
The experiment consisted of 4 blocks with 25 trials per block. The first and third blocks were normal view conditions. The second and fourth blocks were simulated hemianopia conditions, one left and one right hemianopia, with the order randomly determined across subjects. Participants were allowed a short break after the second block. Hemianopia was simulated with a gaze-contingent display. In this process, the current eye position, being sampled every 1 ms, is used by the control computer to alter the display, eliminating all stimulus elements on one side of the current fixation position and replacing these with a blank white screen of the same luminance as the
background. As with all gaze-contingent methods, the efficiency of the simulation depends on the ‘‘turnaround’’ time, which is usually limited by the screen refresh rate. Our relatively high refresh rate of 140 Hz translates to a maximum lag of 7.1 ms (It is worth noting that the impact of lag on simulated hemianopia is minimal compared with simulations of a central scotoma. A long lag might allow a brief moment of foveal vision after a saccade in the case of a simulated central scotoma. For simulated hemianopia, though, a long lag after a saccade toward the hemianopic field will not afford a glimpse of the hidden stimuli, but merely gives a momentarily greater region of blindness, while the lag after a saccade toward the seeing field will only allow some persistent visibility for areas the subject already saw during the prior fixation.). The hemianopia did not spare the fovea.
Analysis
Overall Search Parameters
We analyzed performance over the entire experiment to determine the similarity to prior data on hemianopic search. First, we examined several global indices of search performance, including 1) accuracy, in which trial responses were scored simply as correct or incorrect, 2) search completion time, from the moment the stimuli appeared to the time the subject pressed the answer key, 3) number of fixations made during search, and 4) length of the search scanpath, which was the sum of the amplitudes of all saccades made during search. These were analyzed with a general linear model with the main factors of view condition (right hemianopia, left hemianopia, first full-field, and second full-field) and subjects as a random effect, with Tukey’s honestly significant different (HSD) test used to examine contrasts.
Second, we asked where fixations were distributed during search. We assessed horizontal distribution by dividing the screen into quarters and examining the number of fixations in each quarter (Behrmann et al. 1997). We used a general linear model on the dependent variable of number of fixations, with main factors of view condition and display-quarter (far left, near left, near right, and far right), with subjects as a random effect, and Tukey’s HSD test to examine individual contrasts. Also, for a more fine-grained illustration of fixation distribution similar to prior reports on hemianopia (Barton and Black 1998), we pooled fixations across all subjects and plotted fixation density (fixations per horizontal degree of screen visual angle) as a function of the horizontal position of each individual fixation. This was done by averaging the distance between each fixation and its nearest neighboring fixation in horizontal coordinates. To smooth the data, we averaged this for the 30 fixations to the left and the 30 fixations to the right of each fixation: in essence, this provides a moving window of local fixation density, with a window width of 60 fixations.
Third, we examined the saccades used to search, by calculating the unsigned amplitude of the horizontal component of saccades made during the trials. We used a general linear model with the main factors of direction (leftward saccade and rightward saccade) and view condition, subjects as a random effect, and Tukey’s (HSD) test to examine contrasts. We also performed a second analysis that examined whether saccadic effects varied with the position of the saccade in the search display. To do this, we classified saccades by the quarter in which their starting position was located. We used a general linear model on the dependent variable of saccadic horizontal amplitude, with main factors of view condition (right hemianopia, left hemianopia, full-field first view, and full-full-field second view), display-quarter of origin (far left, near left, near right, far right), and saccade direction (right, left), with subjects as a random effect, and again using the Tukey’s HSD test to examine individual contrasts.
Time Course Analysis
We used an analysis that examined how parameters evolved over the series of 25 trials (Tant et al. 2002). First, we examined how the 3 global parameters of search changed: completion time, number of fixations used in search, and scanpath length. For each of the view conditions, we performed a linear regression of the group mean data against trial number to determine if there was a significant change as the experiment progressed.
Second, we examined how the distribution of fixations changed over the 25 trials. To obtain a single parameter that reflected this, we used the mean fixation position of each subject in each trial, both horizontally and vertically. Because of the skewing of the horizontal data in the hemianopic conditions, as is evident in the graph of fixation density, mean horizontal fixation position will underestimate the degree of shift away from the screen center in these conditions: hence our analysis tends toward the conservative. As with number of fixations, we plotted group means as a function of trial number and performed a linear regression to see if there was a correlation indicating that average fixation positions shifted over the course of the experiment.
Third, we examined 2 additional parameters that reflect the dynamics of search. First, we asked whether the density of fixations changed. We sorted fixations by horizontal position and calculated the mean distance between fixations. A subject who makes many closely spaced fixations will have a low value on this parameter: increased efficiency of search may be reflected in a higher value, indicating the ability to spread out fixations and scan larger areas of the display. We used linear regression to examine for a significant change in vertical and horizontal fixation spacing over the 25 trials. Second, we asked whether the horizontal amplitude of saccades used to search changed. Because effects may vary with direction and quadrant of origin, we did not use linear regression to examine the change in a single variable but rather analyzed right and left saccades in separate general linear models, with main factors of view condition, display-quarter of origin, and trial number, with subjects as a random effect.
The linear regressions performed in the above analyses assume that change has a uniform rate. To determine if rate of change actually changed, we performed a slope inflection analysis. This involved segmenting the data at a specific trial: data for trials preceding and including this trial comprised an early segment, while data for trials following it comprised a late segment. We then tested the null hypothesis that the slopes of the early and late segments do not differ, using a technique to compare linear regressions (http://departmen-t.obg.cuhk.edu.hk/researchsupport/Compare_2_regressions.asp) (Armitage 1971). The segmentation point was marched orderly through the trial-number series, with the one requirement that both the early and late segments had at least 3 data points on which to perform linear regression. Trial numbers at which the slopes of early and late segments differed significantly, after Bonferroni correction for multiple comparisons, were taken as the location of an inflection point, separating time periods in which the rate of change differed. If there were multiple contiguous significant results, the trial number with the highest significant value was taken as the inflection point.
Results
Overall Search Parameters
There were main effects of view condition for accuracy (F3,27= 13.10, P < 0.0001), total duration of search (F3,27 = 38.37, P <0.0001), total number of fixations in search (F3,27=36.90, P < 0.0001), and the length of the scanpath used to search (F3,27=18.32, P <0.0001) (Table 1). For all of these variables, the Tukey’s HSD test showed that both hemianopic conditions differed from both full-field conditions; however, the hemi-anopic conditions were not different from each other, and the full-field conditions also did not differ from each other.
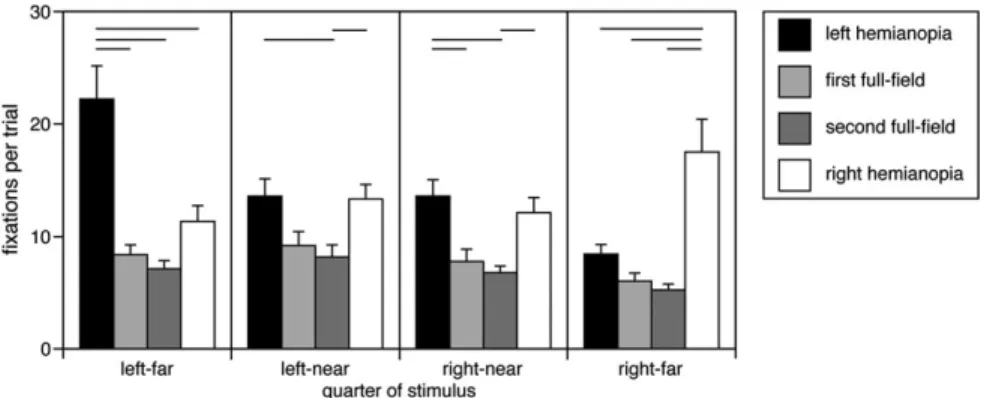
For horizontal fixation position, there was a main effect of view condition (F3,135 = 57.67, P < 0.0001) and of display-quarter (F3,135=6.31, P <0.0005), with a significant interaction between the 2 (F3,135=11.73, P <0.0001). Tukey’s HSD test showed that during left hemianopia, except for the contrast between the left-near and right-near quarters, all quarters differed from each other (Fig. 1): the right-far quarter had less fixations than the other quarters and the left-far quarter had more fixations than the others. During right hemianopia, the far quarter had more fixations than the left-far and right-near quarters. No conditions differed from each other in either of the full-field conditions. Contrasts between view conditions showed that, other than a general increase in fixations in hemianopia, fixations in the far quarter on the side of the hemianopia were increased in both right and left hemianopia compared with all other conditions. Last, none of the contrasts of mirror symmetric quarters between left hemianopia and right hemianopia were significant (e.g., right-far quarter in right hemianopia vs. left-far quarter in left hemianopia): hence, the effects of right hemianopia were similar to those of left hemianopia with regard to the blind hemifield. The fixation density plot showed that during right hemianopia, subjects developed a peak of fixation density that continued to increase until the right edge of the display was reached, with some fixations that extended beyond it (Fig. 2). Similarly, with left hemianopia, there was a peak toward the left edge of the display.
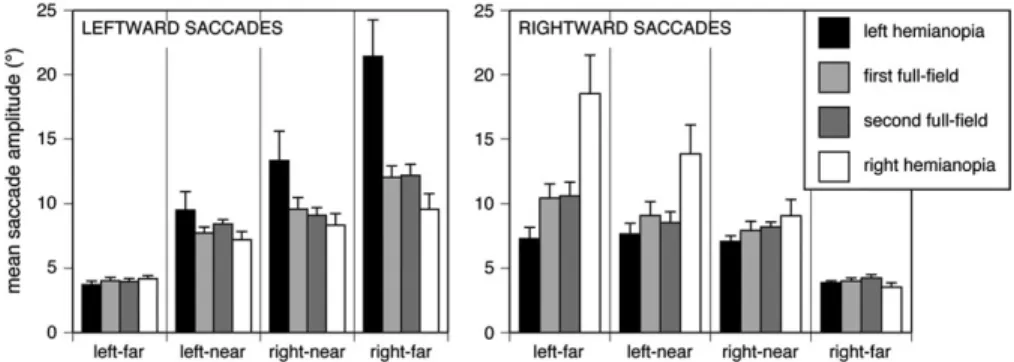
For saccadic horizontal amplitude (Table 1), the main effects were not significant, but there was an interaction between view condition and direction (F3,63=9.75, P <0.0001). Tukey’s HSD test showed that leftward saccades did not differ among the different view conditions but rightward saccades were larger in the right hemianopic condition than in all other conditions. In the second analysis, which asked whether saccadic amplitude effects varied by their starting position (Fig. 3), there was a main effect of direction (F1,279 = 3.94, P < 0.048), view condition (F3,279 = 3.99, P < 0.009), and of display-quarter (F3,279=3.10, P<0.027). All 2-way interactions were significant, but the key result was a significant 3-way interaction between all factors (F9,279=2.12, P <0.029). Tukey’s HSD test showed that for leftward saccades, the only difference was that leftward saccades starting from the far right quadrant were larger in left hemianopia than in all the other view conditions. Similarly, rightward saccades starting from the far left quadrant were larger in right hemianopia than in the other view conditions. Rightward saccades starting in the near left quadrant were also larger in right hemianopia than in left hemianopia and the second full-field condition. Thus, under hemianopic conditions, subjects make larger saccades toward the blind side when starting from a fixation point on their seeing side.
Time Course Analysis
Subjects required less completion time in later trials for both left (F1,23=11.7, P <0.003) and right hemianopia (F1,23=12.2, P <0.002). There was no significant difference between the slopes of the regressions for left versus right hemianopia (t46= 0.32, P=0.75). There was also a decline in completion time in the first full-field condition (F1,23=14.7, P <0.0009) but not in the second full-field condition. Inflection point analysis showed a change in slope in the first full-field condition at trial 9: there was a decrease in completion time before this point (F1,6 = 14.1, P <0.008) but not after (Fig. 4).
Table 1
Main effects of simulated hemianopia
First full-field Second full-field Right hemianopia Left hemianopia Accuracy (%) 0.98 [0.02] 0.98 [0.03] 0.83 [0.13] 0.86 [0.11] Duration (min) 8.60 [0.14] 7.30 [0.12] 17.15 [0.29] 18.15 [0.30] Scanpath length (°) 365 [116] 325 [85] 738 [408] 703 [239] Fixation number 31.4 [11.7] 27.3 [8.9] 54.6 [18.7] 57.7 [18.9] Left saccade amplitude (°) 8.38 [1.77] 8.56 [1.49] 7.78 [2.69] 11.01 [5.41] Right saccade amplitude (°) 8.43 [2.50] 8.52 [2.21] 12.02 [6.65] 6.98 [1.97]
Subjects also used less fixations as the trials progressed for both left (F1,23=24.01, P <0.0006) and right hemianopia (F1,23= 8.15, P < 0.0089) (Fig. 4). There was no significant difference between the slopes of the regressions for left versus right hemianopia (t46=0.28, P =0.78). Again, there was a decline in fixation number in the first full-field condition (F1,23=16.69, P< 0.0005) but not in the second. As for completion time, inflection point analysis showed a change in slope in the first full-field condition at trial 9: there was a decrease in fixation number before this point (F1,6=7.11, P <0.03) but not after.
The data for scanpath length were very similar. Subjects used shorter scanpaths as the trials progressed for both left (F1,23= 20.8, P < 0.0002) and right hemianopia (F1,23 = 9.52, P < 0.0053). There was no significant difference between the slopes of the regressions for left versus right hemianopia
(t46= 1.16, P =0.25). Again, there was a decline in scanpath length in the first full-field condition (F1,23=9.91, P <0.0046) but not in the second, although this time the inflection point analysis did not show a significant change in slope during the experiment.
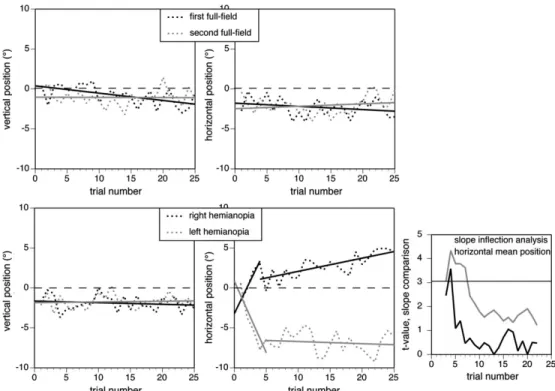
Mean horizontal fixation position did not change with time in either the first (F1,23 = 1.85, P= 0.19) or second full-field conditions (F1,23=0.92, P=0.34). With right hemianopia, there was a progressive rightward shift (F1,23 = 35.4, P < 0.0001) (Fig. 5, also illustrated in histogram form in Fig. 6). Inflection point analysis showed a change in slope at trial 6: before this point, there was a steep rightward shift (F1,2=65.79, P=0.014) and afterward a more gradual shift (F1,19=32.81, P <0.0001). With left hemianopia, there was a progressive leftward shift (F1,23 = 5.95, P < 0.025). Inflection point analysis showed Figure 1. Horizontal fixation distribution. The bars show the group mean of number of fixations in each horizontal quadrant of the display per trial, averaged over the entire experiment, with error bars indicating one standard error. Horizontal lines at the top of the graph indicate significant contrasts between the view conditions within each display quadrant.
Figure 2. Horizontal fixation density. For each view condition, we plot group data for the number of fixations per degree, per trial per subject, as a function of horizontal fixation position, from the entire experiment. Vertical gray lines indicate the borders of the screen. Hemianopic conditions show a peak of fixation density near the edge of the screen in the hemianopic field.
a change in slope at trial 5, with an initial leftward shift (F1,3= 11.54, P <0.043) and no shift after this trial. For mean vertical fixation, as expected there was no shift over the 25 trials in any view condition.
For fixation spacing, there was a progressive increase in horizontal spacing over all 25 trials, in both right (F1,23=7.34, P < 0.013) and left hemianopia (F1,23 = 23.6, P < 0.0001) (Fig. 7). While there was no significant increase in the second full-field condition, the first full-field condition also showed a progressive increase in horizontal spacing (F1,23=15.2, P < 0.0008). The inflection point analysis showed a change at trial 7, with an initial increase in horizontal spacing before this trial (F1,5=8.97, P <0.031) and no increase after. Also of note, the vertical data showed a progressive increase in vertical spacing over all 25 trials, in both right (F1,23 =8.2, P <0.009) and left hemianopia (F1,23 = 21.8, P < 0.0002). While there was no significant increase in the second full-field condition, the first
full-field condition also showed a progressive increase in vertical spacing (F1,23=18.7, P <0.0003), without a significant inflection point.
For saccadic amplitude, the general linear models done for right and left saccades separately showed no main effect or interaction involving trial number. We also performed more limited post-hoc general linear models on the rightward saccades starting in the far left quadrant and the leftward saccades starting in the far right quadrant, as these show the most significant differences from hemianopia. These analyses also failed to show an effect or interaction with trial number. Hence, we find no evidence that saccadic amplitude changes significantly over time in hemianopia.
Discussion
Our results showed less efficient visual search in simulated hemianopia with longer search completion times, more
Figure 3. Amplitude of the horizontal vector of saccades. Leftward saccades are plotted in the left graph and rightward saccades in the right graph, separated by the display quadrant in which the saccade originated (left far, left near, right near, and right far). Group means of amplitudes are shown from the entire experiment, with error bars indicating one standard error. In the hemianopic conditions, subjects make significantly larger saccades toward the blind side when starting from the far quadrant on the seeing side.
Figure 4. Change in completion time (left graphs) and number of fixations (right graphs). Full-field conditions are shown at top and hemianopic conditions at the bottom. Dashed lines connect group mean data for each trial position, with solid lines indicating regression lines. For both hemianopic conditions, there is a significant decrease in both completion time and number of fixations made per trial over the experiment. For the first full-field condition, there is a significant decrease for both variables over the first 9 trials and then no change. The inflection analyses for completion time and number of fixations for the first full-field condition are shown in the small graph at right: a high t value exceeding the horizontal bar indicates a significant change in slope at that trial.
fixations used, and longer scanpaths, results that are similar to those found in prior studies of visual search, both in simulated hemianopia (Tant et al. 2002; Machner et al. 2009; Schuett et al.
2009a, Schuett et al. 2009b) and also in patients with hemianopia (Pambakian et al. 2000; Tant et al. 2002), even for patients studied within a month of onset (Machner et al.
Figure 5. Change in mean vertical (left graphs) and horizontal fixation position (right graphs). Full-field conditions are shown at top and hemianopic conditions at the bottom. Dashed lines connect group mean data for each trial position, with solid lines indicating regression lines. Mean vertical fixation does not change in any view condition. Mean horizontal fixation is also stable in the full-field conditions. For both hemianopic conditions, there is a significant shift in mean horizontal fixation toward the blind field over the first 5-6 trials and then a slower shift in right hemianopia and none for left hemianopia. The inflection analyses for mean horizontal fixation for the 2 hemianopic conditions are shown in the small graph at right: a high t value exceeding the horizontal bar indicates a significant change in slope at that trial.
Figure 6. Illustration of change in fixation distribution over time. Histogram plots show in each row the number of fixations per 64 pixel-wide horizontal bin, summed over the vertical extent of each display. Each row represents a trial, progressing over time from bottom to top of the graphs. For the 2 hemianopic (HH) conditions (top graphs), a concentration of fixations near the edge of the display on the blind side develops rapidly. Fixation distributions are relatively even and remain stable in the 2 full-field (normal view) conditions.
2009). We also showed that the spatial distribution of fixations used in search is shifted in simulated hemianopia, with more scanning on the side of the blind hemifield. This too has been seen in other simulations of hemianopia (Tant et al. 2002; Schuett et al. 2009a) and has parallels with findings in hemianopic patients (Zihl 1995; Behrmann et al. 1997; Pambakian et al. 2000; Tant et al. 2002). It was not seen in the one study of earlier stages of hemianopia (Machner et al. 2009), though this may have been complicated by the inclusion of patients with partial defects such as quadrantanopia. More fine-grained analyses of quadrants or quintiles in some of these studies (Ishiai et al. 1987; Behrmann et al. 1997) also showed what we found, that fixations are not only greater on the side of blindness but also clustered in the zone farthest into the hemianopic side.
Thus, our study design replicates many of the global search indices and spatial patterns of visual search reported for both real and simulated hemianopia in the past. In patients with real hemianopia, there is always the potential that some components of their anomalous search patterns may reflect additional impairments in perception or attention rather than compensation for hemianopia, and this is almost certainly true for patients with very large posterior lesions. The value of simulations lies in their ability to isolate the effects of the field defect alone; in this regard, our analyses suggest that many of the features reported for hemianopic search are indeed due to hemianopia per se and not due to additional cerebral damage to other attentional or sensory processes that have sometimes been invoked (Schuett et al. 2009b; Zihl et al. 2009), but which would be intact in the healthy subjects in this simulation. This would also suggest that simulated hemianopia is a reasonable surrogate for pathological
hemi-anopia and can be used to study the immediate effects of hemianopia, at a time after onset that is difficult to study in patients in practice.
Although the above indicates general agreement on the changes to fixation behavior seen in both real and simulated hemianopia, prior results regarding whether saccades are altered in hemianopia have been mixed. One study of patients did not find a difference in saccadic amplitude overall or within each hemispace (Zihl 1995). Another found smaller amplitudes with no difference between saccades toward or away from the blind side in either simulated hemianopia or patients with hemifield defects (Machner et al. 2009). Yet another found slightly smaller amplitudes for saccades toward the blind side, again in both simulated hemianopia and hemianopic patients (Tant et al. 2002), similar to another study using visual scenes (Pambakian et al. 2000). In contrast, a study of simulated hemianopia found the opposite, slightly larger saccades toward the blind side (Schuett et al. 2009b).
Our analysis of saccadic amplitude demonstrates that one potential source of confusion in this literature may reflect the failure to take into account both the direction and the starting location of saccades. Prior studies examined either the effect of hemifield location without considering the direction of the saccades (Zihl 1995) or the effect of direction without considering the location of the saccades (Pambakian et al. 2000; Tant et al. 2002; Schuett et al. 2009b) and found only small effects or no effects. Similarly, we found no main effects on saccadic amplitude of direction or location. However, we did find a significant interaction between the 2. Figure 3 shows clearly that the key difference in hemianopia was that the farther away from the blind side the saccade started, the larger the amplitude of a saccade directed to the blind side. Hence
Figure 7. Change in mean vertical (left graphs) and horizontal fixation spacing, the mean distance in degrees between fixations (right graphs). Full-field conditions are shown at top and hemianopic conditions at the bottom. Dashed lines connect group mean data for each trial position, with solid lines indicating regression lines. Mean vertical and horizontal spacing both increase with time for all view conditions except the second full-field condition. For the first full-field condition, this increase is greater in the first 7 trials horizontally. The inflection analysis for mean horizontal spacing for the first full-field condition is shown in the small graph at right: a high t value exceeding the horizontal bar indicates a significant change in slope at that trial.
one important change in visual scanning after hemianopia is to use saccades to redirect fixations deeper into the blind side when starting from the seeing side, an effect that would be missed if both direction and location were not considered together.
The chief goal of this study was to examine the temporal evolution and the type of adaptive changes in visual search made by healthy subjects subject to an acute hemianopia. We found first that as subjects start the experiment with the first full-field view condition, there were rapid gains in search efficiency over the first 9 trials, with reduction in completion time, number of fixations used, and the density of fixations. Beyond this point, visual search with full fields was relatively stable, and when subjects returned to full-field viewing the second time, performance remained stable for all parameters.
For the hemianopic conditions, there was a biphasic pattern. First, in the initial 5--7 trials, the distribution of fixations was shifted toward the blind side. In the remainder of the block, there was no or minimal further horizontal shift of fixations but continued declines in fixation number, completion time, and both the vertical and horizontal density of fixations. This suggests that in hemianopia, there is an initial qualitative shift as fixations are strategically shifted into the blind side, followed by slower and continuing gains in general efficiency of implementing this strategy, similar to the gains in general efficiency seen in the first 9 trials of the first full-field condition when subjects became familiar with the visual search task.
Previous studies of simulated hemianopia have shown improvements in reading and visual search over 15 min of practice (Schuett et al. 2009a, 2009b) but did not evaluate the dynamics of this improvement. As with our efficiency gains, improvement was manifest mainly as reductions in errors, completion time, fixation number, and scanpath length. However, no change in the distribution of fixations between the right and left hemispace was found. The reason for this is apparent in their methods: pre- and posttraining assessments averaged performance over 5 trials. Since our findings show that shifts in fixation distribution occurred in the first 5--7 trials, their pretraining assessment averaged over the early period when the rapid shift in fixation distribution occurred.
The spatial realignment of fixation distributions over the first 5--7 trials we observed may have a parallel in the adaptations in manual pointing induced by prism adaptation, in which spatial realignment of pointing requires about 12--15 trials to stabilize (Redding and Wallace 1996; Pisella et al. 2004; Luaute et al. 2009). This is accompanied by changes in both cerebellar and parietal activity, with the latter thought to be related to error detection and correction (Luaute et al. 2009). The more prolonged gains in efficiency of search we found may in turn have parallels with observations of training-induced improve-ments in difficult or ‘‘inefficient’’ visual search (where difficulty is related to the properties that distinguish the target from the distractor). Such improvements do not occur rapidly but continue to accumulate over hundreds of trials (Sireteanu and Rettenbach 1995, 2000; Leonards et al. 2002).
The postulate of multiple adaptation effects with different time courses is not without precedent. Studies of manual reaching subject to force perturbations show a temporal dynamic suggestive of a fast adaptive process over a few trials combined with a slower one that requires hundreds of trials (Smith et al. 2006). A mixture of rapid conscious strategic
changes and slower adaptive spatial realignments has been hypothesized in studies of pointing or tracking behavior, in which the screen cursor output generated by a hand-held stylus was rotated by 60°--90° (McNay and Willingham 1998; Bock 2005; Bock and Girgenrath 2006), as well as studies of pointing after prism adaptation (Redding and Wallace 1996; Pisella et al. 2004). The strategic changes in these studies, however, are quite rapid, supposedly taking no more than 1 or 2 trials to be completed. On the other hand, studies of locomotor adaptation after space flight show a biphasic pattern with rapid short-term motor learning over the first 6 trials followed by slower long-term adaptive responses over the subsequent weeks, with correlations between short-term and long-term effects (Mulavara et al. 2010).
Studies of other visual simulations have also provided some evidence on the temporal dynamics of adaptation to altered visual fields. Subjects adapted reading behavior to an artificial central scotoma by settling into a preferred reading locus after 5--10 sessions of 15--40 min duration each, with concomitant improvements in accuracy (Varsori et al. 2004). Interestingly, subjects forced to read within an eccentric window in the inferior field showed a biphasic pattern of change (Fornos et al. 2006). Over the first 5--10 sessions of about 30 min duration each, there was a rapid reduction in the number of vertical saccades, which represented ineffective attempts to foveate the reading zone. In contrast, restructuring of horizontal saccades occurred more slowly, with increased frequency of progressive (left-to-right) saccades and larger amplitudes, surmised to reflect the increased visual span that has been shown to develop over several days of practice in other studies of parafoveal reading (Chung et al. 2004).
Our results thus provide a hemianopic adaptive parallel to a number of ocular motor and locomotor studies of adaptation to altered sensory contingencies. In many of these studies of motor learning, a rapid qualitative adjustment of performance is accomplished over a brief initial period of repeated training, which appears to require repetitions on the order of 5--15 trials. Following this, many studies show continuing but slower gains in proficiency, which in the case of hemianopic visual search may be manifest as increased visual span, shorter more efficient scanpaths, and reduced search time. At present we do not know whether the degree of early adjustment is correlated with the longer term gains in efficiency of search, as has been shown in the case of locomotor adaptation after space flight (Mulavara et al. 2010). Nevertheless, given that patients with hemianopia vary in the degree of their search efficiency and that this variability correlates with their functional impairment in daily activities (Zihl 1999), understanding the factors that promote effective early adjustments on the one hand and substantial long-term efficiency gains on the other may be important for optimizing the adaptation of these subjects to their deficit.
Funding
Canada Research Chair to J.B.;Schweizerische Stiftung fu¨r medizinisch-biologische to M.A.
Notes
This work was presented at the Vision Sciences Society meeting in Naples, May 2010. Conflict of Interest : None declared.
References
Armitage P. 1971. Statistical methods in medical research. Oxford: Blackwell Scientific Publications. p. 279--301.
Barton JJ, Black SE. 1998. Line bisection in hemianopia. J Neurol Neurosurg Psychiatry. 64:660--662.
Behrmann M, Watt S, Black S, Barton J. 1997. Impaired visual search in patients with unilateral neglect: an oculographic analysis. Neuropsychologia. 35:1445--1458.
Bock O. 2005. Components of sensorimotor adaptation in young and elderly subjects. Exp Brain Res. 160:259--263.
Bock O, Girgenrath M. 2006. Relationship between sensorimotor adaptation and cognitive functions in younger and older subjects. Exp Brain Res. 169:400--406.
Chung ST, Legge GE, Cheung SH. 2004. Letter-recognition and reading speed in peripheral vision benefit from perceptual learning. Vision Res. 44:695--709.
Fornos AP, Sommerhalder J, Rappaz B, Pelizzone M, Safran AB. 2006. Processes involved in oculomotor adaptation to eccentric reading. Invest Ophthalmol Vis Sci. 47:1439--1447.
Ishiai S, Furukawa T, Tsukagoshi H. 1987. Eye-fixation patterns
in homonymous hemianopia and unilateral spatial neglect.
Neuropsychologia. 25:675--679.
Leonards U, Rettenbach R, Nase G, Sireteanu R. 2002. Perceptual learning of highly demanding visual search tasks. Vision Res. 42:2193--2204.
Luaute J, Schwartz S, Rossetti Y, Spiridon M, Rode G, Boisson D, Vuilleumier P. 2009. Dynamic changes in brain activity during prism adaptation. J Neurosci. 29:169--178.
Machner B, Sprenger A, Kompf D, Sander T, Heide W, Kimmig H, Helmchen C. 2009. Visual search disorders beyond pure sensory failure in patients with acute homonymous visual field defects. Neuropsychologia. 47:2704--2711.
McNay EC, Willingham DB. 1998. Deficit in learning of a motor skill requiring strategy, but not of perceptuomotor recalibration, with aging. Learn Mem. 4:411--420.
Mitra AR, Abegg M, Viswanathan J, Barton JJ. 2010. Line bisection
in simulated homonymous hemianopia. Neuropsychologia.
48:1742--1749.
Mulavara AP, Feiveson AH, Fiedler J, Cohen H, Peters BT, Miller C, Brady R, Bloomberg JJ. 2010. Locomotor function after long-duration space flight: effects and motor learning during recovery. Exp Brain Res. 202:649--659.
Pambakian AL, Wooding DS, Patel N, Morland AB, Kennard C, Mannan SK. 2000. Scanning the visual world: a study of patients with homonymous hemianopia. J Neurol Neurosurg Psychiatry. 69:751--759.
Pisella L, Michel C, Grea H, Tilikete C, Vighetto A, Rossetti Y. 2004. Preserved prism adaptation in bilateral optic ataxia: strategic versus adaptive reaction to prisms. Exp Brain Res. 156:399--408.
Redding GM, Wallace B. 1996. Adaptive spatial alignment and strategic perceptual-motor control. J Exp Psychol Hum Percept Perform. 22:379--394.
Schuett S, Kentridge RW, Zihl J, Heywood CA. 2009a. Adaptation of eye-movements to simulated hemianopia in reading and visual
exploration: transfer or specificity? Neuropsychologia.
47:1712--1720.
Schuett S, Kentridge RW, Zihl J, Heywood CA. 2009b. Are hemianopic reading and visual exploration impairments visually elicited? New insights from eye movements in simulated hemianopia. Neuropsychologia. 47:733--746.
Sireteanu R, Rettenbach R. 1995. Perceptual learning in visual search: fast, enduring, but non-specific. Vision Res. 35:2037--2043. Sireteanu R, Rettenbach R. 2000. Perceptual learning in visual search
generalizes over tasks, locations, and eyes. Vision Res. 40 :2925--2949.
Smith MA, Ghazizadeh A, Shadmehr R. 2006. Interacting adaptive processes with different timescales underlie short-term motor learning. PLoS Biol. 4:e179.
Tant ML, Cornelissen FW, Kooijman AC, Brouwer WH. 2002. Hemi-anopic visual field defects elicit hemiHemi-anopic scanning. Vision Res. 42:1339--1348.
Varsori M, Perez-Fornos A, Safran AB, Whatham AR. 2004. Development of a viewing strategy during adaptation to an artificial central scotoma. Vision Res. 44:2691--2705.
Zangemeister WH, Oechsner U, Freksa C. 1995. Short-term adaptation of eye movements in patients with visual hemifield defects indicates high level control of human scanpath. Optom Vis Sci. 72:467--477. Zihl J. 1995. Visual scanning behavior in patients with homonymous
hemianopia. Neuropsychologia. 33:287--303.
Zihl J. 1999. Oculomotor scanning performance in subjects with homonymous visual field disorders. Vis Impair Res. 1:23--31. Zihl J, Samann P, Schenk T, Schuett S, Dauner R. 2009. On the origin
of line bisection error in hemianopia. Neuropsychologia.