XVI. COMMUNICATIONS BIOPHYSICS* Prof. M. Eden Prof. W. T. Peaket Prof. R. R. Pfeiffert Prof. W. A. Rosenblith Prof. W. M. Siebert Prof. T. F. Weisst Dr. J. S. Barlowt Dr. A. W. B. Cunningham*' Dr. H. Fischlertf Dr. R. D. Hall Dr. N. Y-s. Kiangt Dr. R. R. Rojas Corona Dr. R. Shofer t Dr. W. Simon**'", Dr. G. F. Songsterlf Dr. E. B. Vidale J. A. Anderson JoAnn Arnn T. H. Baker R. M. Brownt S. K. Burns F. H. Byers R. J. Clayton A. H. Cristt N. I. Durlach J. A. Freeman P. R. Gray J. J. Guinan, Jr.t F. N. Jordan L. J. Krakauer D. P. Langbeint P. H. Levine R. G. Mark E. G. Merrill S. A. Miller D. C. Milne C. E. Molnar E. C. Moxon M. Nahvi P. H. O'Lague Ann M. O'Rourke D. J. M. Poussart L. R. Rabiner J. J. Reynolds, Jr. M. B. Sachs M. M. Scholl J. J. Singer Judith E. Swensen I. H. Thomae D. G. Tweed G. von Bismarck M. L. Wiederhold
A. TISSUE DYNAMICS OF BRAIN TISSUE IN VITRO
Our group is in the process of quantifying potentials that occur in small pieces (1 mm3) of living brain tissue in a suitable in vitro environment and identifying the re-sponsible cells. This phenomenon has been noted in brain tissue from mammals (including adult humanl), birds,2 amphibians,3 fish,4 and insects 5; however, we usually use chick embryo brain tissue in our studies. The region of the brain to be used is exposed and cooled in a stream of cold (10-20oC) nutrient fluid.2 Approximately 1 cubic millimeter of tissue is excised rapidly either manually or with the automatic apparatus developed by us to provide uniform explants (Fig. XVI-10). The piece of tissue is floated in cold nutrient fluid to remove blood and membranes. It is transferred onto a thin plate of sintered glass partly immersed in a reservoir of warm (35 C) nutrient fluid in a glass culture vessel whose shape depends on the investigation to be undertaken. The explant
This work was supported in part by the Joint Services Electronics Program (Con-tract DA36-039-AMC-03200(E)), the National Science Foundation (Grant GP-2495), the National Institutes of Health (Grants MH-04737-05 and 5 RO1 NB-05462-02), and the National Aeronautics and Space Administration (Grant NsG-496).
tAlso at Eaton-Peabody Laboratory, Massachusetts Eye and Ear Infirmary, Boston, Massachusetts.
lResearch affiliate in Communication Sciences from the Neurophysiological Labo-ratory of the Neurology Service of the Massachusetts General Hospital, Boston, Mass-achusetts.
Special Research Fellow, National Institutes of Health.
t From the Department of Electronics, Weizmann Institute of Science, Rehovot, Israel. ttSpecial Fellow, National Institutes of Health.
''Research Associate, Department of Electrical Engineering, M.I.T.; also Research Associate, Department of Physiology, Harvard Medical School.
(XVI. COMMUNICATIONS BIOPHYSICS)
is placed a few millimeters above the surface of the reservoir, nutrient fluid being brought to it by the capillary action of the sintered glass. The high surface tension in the sintered plate ensures that a sufficiently small, relatively static, volume of fluid is in contact with the living tissue. The explant can then modify (and maintain) the small vol-ume of fluid in contact with it into a proper environment for itself. (Simple pH studies illustrate this - the fluid in the sintered glass for 1-2 mm around the explant remains at pH 7.2, while that in the rest of the sintered glass and the reservoir may vary as widely as 8.4.) Sintered glass of suitable dimensions (2 mm thick half-circle, 1 cm diameter) and of 'coarse' or 'very coarse' porosity brings sufficient fresh fluid to the living tissue by diffusion to keep it in a functional state for some days.
A 40-gauge platinum electrode insulated to its tip with teflon lies between the explant and the sintered glass and a 36-gauge bare platinum reference electrode dips into the free fluid in the reservoir. By using these electrodes, negative signals can be detected in the explants. The form of the signal sequences is individually characteristic for tel-encephalon and cerebellum (possibly for other areas of the brain also). The form and
amplitude of the individual signals is also characteristic for the area of brain involved. 1. The Signals
A technical report on this subject is to be written by P. L. Marcus, so only the sali-ent details will be given here.
The signals usually have a sinusoidal rise with a period of ~15 msec (for telenceph-alon) and invariably an exponential decay with a time constant of ~20 msec. This varies little for the signals of any one explant and for the signals from different explants of the same area of the brain, but it changes by a factor of four between cerebellar and telen-cephalic signals. The form of the cerebellar signal is a simple negative pulse, but the telencephalic signal has an inherent secondary positive pulse and is sometimes even more complex. The amplitude of cerebellar and telencephalic signals also differs - the cerebell'ar ones range between 2 and 20 pvolts, while those from telencephalon may be as high as 500 livolts.
2. Grouping of Signals
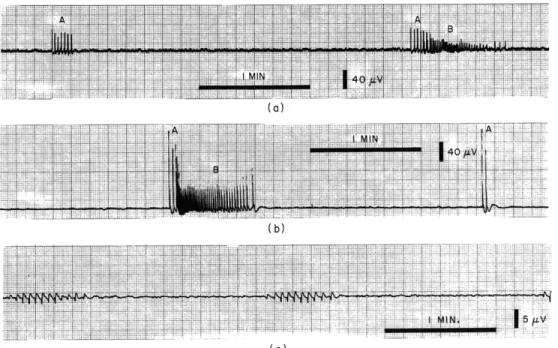
Cerebellum: Cerebellar potentials are originally in groups of 20-30 signals,6 but after approximately 12 hours the signals become considerably simplified and the number per sequence drops to 10-15 (Fig. XVI-1c). For any one explant, there is little varia-tion in the number of signals per sequence (Fig. XVI-2a). The amplitude and duravaria-tion, and the interval following each, of the different signals within a sequence are very sim-ilar (Fig. XVI-3). The amplitude, duration and interval following each individual signal seem to be in a constant direct relationship, i. e., the larger the amplitude the longer the signal and the interval that follows it. This may suggest a restricted metabolic
(XVI. COMMUNICATIONS BIOPHYSICS)
capability necessitating a recovery time whose duration is related to the size of the pre-vious signal. The duration of entire sequences of signals and the interval between sequences is very uniform, the only variation being an increase in the duration of a sequence with an increase in the number of component signals. The composition and form of cerebellar sequences is stable over periods of time up to several days. Figure XVI-4a shows only minor cyclic variations in the duration of the first signal in each of 1000 consecutive sequences containing more than 7 signals. The other param-eters of the first and subsequent signals in cerebellar sequences are equally stable.
Telencephalon: The telencephalic sequence is more complex than the cerebellar one (Fig. XVI-la and Ib). It starts with a short series of large-amplitude, long-duration,
(a)
YF~ FI JA~lITifTJV 1 FVV~it:- TT
~
1I..
7
-"17
r-"f7
(b)(c)
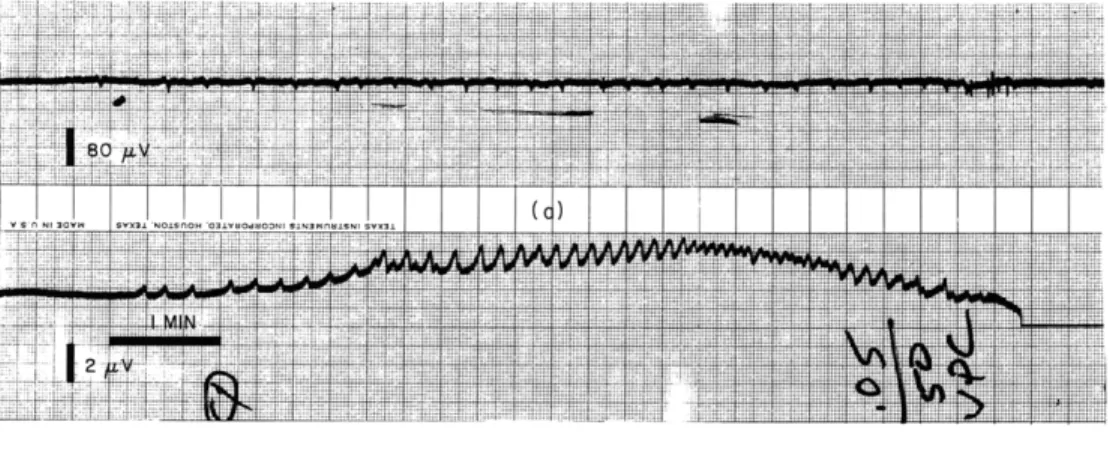
Fig. XVI-1. (a) and (b). Oscilloriter recording of activity from two separate explants of 14-day chick embryo telencephalon after 2 days in vitr.o Complete sequences of signals containing both A and B types of activity are shown and also an example of type A activity alone.
(c). Oscilloriter recording of spontaneous activity from an explant of 10-day chick embryo cerebellum after 4 days in vitro.
widely spaced signals (Group A activity) followed or overlapped by a longer series of signals of smaller amplitude, duration, and intersignal interval (Group B activity). This second series of signals undergoes one or more cyclic changes in these three param-eters, usually ending in a phase of relatively large, long, widely spaced signals (but not
as long, large or widely spaced as in Group A activity). Group A and B activity have well-marked differences. Group A activity often occurs alone (Fig. XVI-1). Group B
(a)
(b)
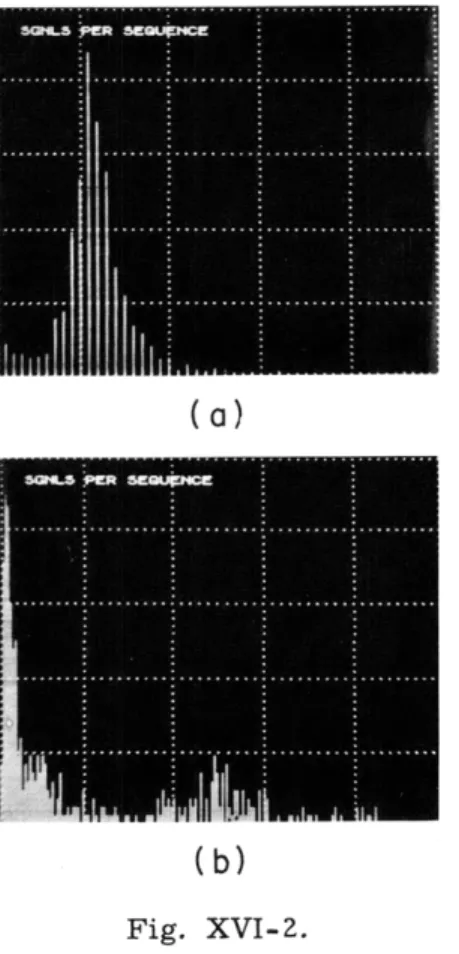
Fig. XVI-2.Distribution of number of signals per sequence for (a) cerebellar and (b) telencephalic explants in vitro. Ordinate, number of sequences; ab-scissa, number of signals per sequence. In the cerebellum the peak is at 12 signals per
sequence and in the telencephalon the peak is at 1 (spurious signals) and around 83.
(a)
(a)
( b)
(c)
(c)
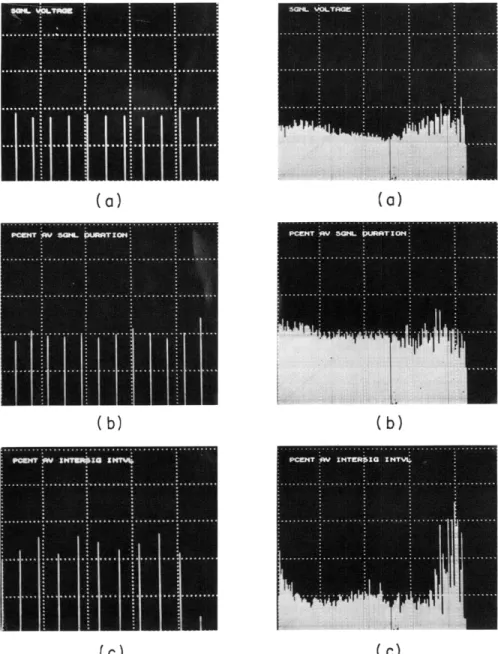
Fig. XVI-3. Comparison of the form of cerebellar and telencephalic signal sequences. Data from 200 sequences each with 12 signals were used for the cerebel-lum, and from 120 sequences containing between 64 and 152 signals were used for telencephalon. The original data for each signal in (b) and (c) were expressed as a percentage of the average value for the requisite parameter for the sequence in which the signal occurred. All values for the first signal were averaged, and the average is represented by the
first continuous vertical line. Values for the second signal were averaged and represented by the second continuous vertical line, and so on. The final product is the average form of sequences for the tissue involved. Data for cerebellum are on the left, and the equivalent data for telenceph-alon on the right. For all cerebellar figures and for the per cent average duration in telencephalon, each division of the vertical axis represents 50%. In the other two figures each such division represents 100%. (a) Signal amplitude (X 80 for cerebellum and X 40 for telencephalon). (b) Duration of the signal. (c) Inter signal interval.
(a)
(b)
Fig. XVI-4. (a) Duration of the first signal of each of 1000 consecutive cerebellar sequences with 8-17 signals per sequence. This value is expressed as a percentage of the aver-age for the sequence in which it occurs and the data have been smoothed by a 10-place moving average (each division of the vertical axis represents 100%). (b) Duration of first signal of each of 120 consecutive tel-encephalic sequences containing 66-152 signals (the value is expressed as in (a)). This represents only
12% of the data in (a), and the vertical scale is twice as great. Considering the difference in scales, the degree of variation in the data is similar in cerebel-lum and telencephalon.
15mcg/cc SODIUM PHENOBARBITAL PAPER SPEED 3"/MIN
(c)
Fig. XVI-5. Effect of 15 mcg/cc Sodium Phenobarbital on the spontaneous activity from an explant of 15-day chick
(XVI. COMMUNICATIONS BIOPHYSICS)
very seldom does (always being preceded by and perhaps even initiated by Group A activ-ity). Group A activity changes much less with aging in culture and persists for some time after the Group B type of activity has disappeared. They respond differently to the administration of drugs, e. g., barbiturates. In Fig. XVI-5 the first three sequences represent the normal behavior of the explant. The first and the third sequences are composed of both Group A and Group B activity superimposed, whereas the second sequence is composed only of Group A activity. Between the third and fourth sequences Sodium Phenobarbital in a concentration of 15 mcg/cc of nutrient fluid is administered to the explant. The occurrence of the fourth sequence is delayed and the intervals between subsequent sequences are significantly increased. It can be seen that the two types of activity are affected to different degrees both in amplitude and in the interval between them.
Since Group A and Group B types of activity overlap in time, it is unlikely that they come from one cell. Either more than one type of originating cell is present or the prod-uct of a single originating cell is modified by at least one secondary functional cell. In either case more than one type of functional cell must be present and must contribute to the formation of the telencephalic sequence.
The average form of the sequences in terms of duration of signal, magnitude of sig-nal, and interval between signals in an explant of telencephalon (Fig. XVI-3) shows much the same features as that of the individual sequences (Fig. XVI-1). It shows the same direct relationship between changes in amplitude, duration, and intersignal interval noted in cerebellum. There are progressive slow reduction in the duration of the signal and a sharp terminal increase in the intersignal interval. In metabolic terms, this may indicate temporary exhaustion of some metabolic material needed for signal production. Equally, it may be just the natural termination of a series of mutual exchanges of subthreshold stimuli with summation within a natural network of functional cells in the explant.
Occasionally, telencephalic explants show only Group A type of activity, in which case the average form and behavior of the sequence is very like that of cerebellar tissue.
The long-term activity from a single cluster of active cells in telencephalon in vitro is relatively stable over a period of up to a day (Fig. XVI-4b). Over longer periods of time, however, Group A activity is as stable as cerebellar activity (and thus it is pos-sible that it arises from a similar type of cell), while Group B activity is less stable and alters considerably over periods of days.
3. Number of Signals per Sequence
The number of signals per sequence (Fig. XVI-1) in cerebellar explants is small (7-14) and does not vary much, whereas in telencephalon the number of signals per sequence is greater (up to 200, but usually between 40 and 120) as is the scatter. The number of signals per telencephalic sequence varies for several reasons. (a) Group A
(XVI. COMMUNICATIONS BIOPHYSICS)
activity often occurs on its own and contains a smaller number of signals than the full sequence. (b) Activity may be recorded from more than one active cluster of cells in
any one explant and each such cluster may give rise to a different number and arrange-ment of signal (while retaining the general telencephalic pattern). (c) Extra single or double signals are much more frequent in telencephalic explants than in cerebellar explants.
Thus, as far as the form of the individual signal and of the natural sequences of sig-nals is concerned, the spontaneous activity from cerebellum and telencephalon differs significantly, each having its own characteristic sequence behavior.
4. Multiple Electrode Studies
If an explant is placed on the cut end of an array of gross (40-gauge) platinum elec-trodes (insulated from each other and bound at ~100-4 separation into a microcable with Teflon), it is possible to monitor a wide area of the explant for the occurrence of spon-taneous potentials. Such studies have shown that there may be several discrete active
clusters of cells within a single explant, each with its own variant on the characteristic form of sequence for the tissue. They have also shown that the electrical disturbance
associated with signal production does not spread uniformly through the tissue, but is directional, often being detectable by one electrode but not by its immediate neighbor. 5. Identification of the Cells of Origin of the Signals
In a previous publicationz we have considered the similarity in the CNS response of the whole animal and of the spontaneous potentials from brain tissue in vitro to the administration of strychnine and barbiturates and the reversible effects of anesthetic gases, changes in oxygen, carbon dioxide and nitrogen concentrations and the tempera-ture of the explant. We concluded that the activity must arise in living functional brain cells in the explant. It is necessary to identify these cells, to ascertain the part played by individual units in the activity of the whole explant and the inter-relationships between the activity of the several individual units. A combination of microelectrode and histo-logical techniques is the obvious choice for this investigation.
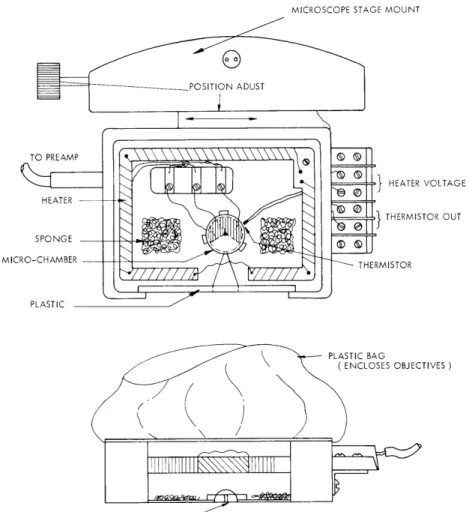
Special culture chambers and a microscope stage incubator (to maintain the temper-ature and humidity in the environment of the explant) have been designed and built for this purpose (Fig. XVI-7). We decided to use Methylene Blue's well-known property of vitally staining the granules in neurons to identify them during functional activity. A concentrated solution of Methylene Blue in balanced salt solution is diluted one in a hun-dred parts in nutrient fluid and used in place of the regular nutrient fluid. The granules in the neurons at the surface of the tissue then become clearly visible while those in the depth of the tissue are also distinguishable. In any explant, only the cells within 0. 2 mm of the surface oxygen and the same distance from a source of nutrient can survive - all
UMENTINCO ORATED. TEXS M DIN A HUSTON
T4 FR I !11 4V.IN Al
-Wi
4t E I
~4!-~tiitr-#;~
i~t ar~iA i~Cff~~txm 4lUMETS NCO
RATD HUSTN. EXA MAE I U..
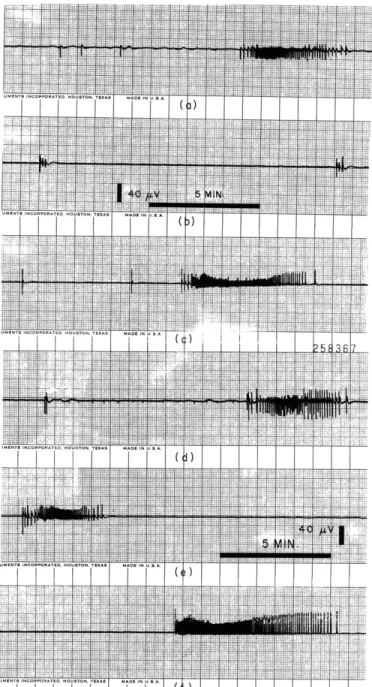
Fig. XVI-6. Activity of three separate explants of telencephalon from 14-day chick embryo 3 days in vitro before addition of Methylene Blue in (a), (b), and (c) and
7 1/2 hours after the addition of Methylene Blue (d), (e), and (f). Increase in magnitude of signals between (a) and (d) and (c) and (f) is obvious, as is the appearance of signals in (e) where none had been present for the previous 24 hours before which this explant had shown small sequences of signals.
UAENTS INCOI
~I~7
1 i i~it~srm~
iLlliRRI i:ff~-I~:tUt;f(t~-ii~:t: "-~ti:
MICROSCOPE STAGE MOUNT
- HEATER VOLTAGE
}
THERMISTOR OUT THERMISTORMICROELECTRODE OPENING
Fig. XVI-7. Microscope Stage Incubator: This has the purpose of ensuring proper temperature and humidity control for the microelectrode culture chamber described in this report. It must also be small enough to fit on the micro-scope stage without interfering with the freedom of movement of the stage or of the microscope objectives. The heating coil and temperature sensing and controlling devices are DC devices to minimize the back-ground electrical noise and allow adequate recording of potential changes within explants. The humidity is supplied by a slow flow of air saturated with water vapor by being passed through air-washing bottles and then through a water trap so that water condensing in the conducting rubber tubing does not drip into the chamber. This flow of air also helps to ensure even distribution of heat within the incubator arrangement by overcoming the effects of radiation from the heating coils. Further humidification is achieved by evaporation from moist sponges in the chamber. The walls of the incubator are made from readily distorted plastic material to give a maximum of freedom of movement of the stage and rotation of the lenses. This plastic bag extends from the microscope objective collar to the lip of the microincubator.
(XVI. COMMUNICATIONS BIOPHYSICS)
such cells can be detected with the Methylene Blue technique. If necessary (and we have not had to use it yet), the fluorescence of Methylene Blue in ultraviolet light can be used to help identify the cells deep in the tissue. To avoid the damage to the tissue by the activating wavelengths of light, a technique such as the 'flying spot' microscope will have to be used. Methylene Blue was tested for toxic effects on the functional behavior of the
explants, and (Fig. XVI-6a and XVI-6d, also Fig. XVI-6c and XVI-6f) the addition of this dye was found to cause a sustained increase in the magnitude of signals and the duration and complexity of sequences after a period of approximately 6 hours. Also, it caused the revival of spontaneous activity in explants where it has lapsed (Fig. XVI-6b and
XVI-6e). The mode of this action of Methylene Blue is not known.
6. Microelectrode Studies
By using the Methylene Blue tech-nique, a microculture chamber, and the microscope stage incubator (see Fig. XVI-7) neurons have been visualized in explants of 14-day chick embryo tel-encephalon and penetrated with glass
(a)
micropipettes (tip diameter, 0. 2 .). Witha Medistor A35 negative resistance elec-trometer amplifier, membrane potentials (DC shifts) of 50 my were observed on penetrating these cells. Spikelike spon-taneous potentials of 20 my, lasting
1-3 msec were obtained subsequently;
work is in progress to ascertain if these were intracellular in origin. Some of these spikes were synchronous with those from the gross electrodes (occurring in
(
b)
the typical sequences). Others seemed to bear no time relation to the activity Fig. XVI-8. Five milliseconds of activity recorded with the gross electrodes.showing extracellular spikes
of approximately 2 mvolts. These potentials were similar to those The lower illustration shows obtained by Stanley Crain - after stimu-several superimposed
extra-cellular spikes. lation.
Extracellular potentials of 2-3 my (Fig. XVI-8) were obtained during microelectrode penetrations (when the microelectrode tip was close to neurons). Many of these were in sequences similar in form,
(XVI. COMMUNICATIONS BIOPHYSICS) T-... F
J._4
60 1,1: 4f (b)Fig. XVI-9. Simultaneous recordings from a gross 40-gauge platinum electrode with a Grass P511 R amplifier in (a) and extracellular microelectrode (0. 2- tip diameter and -50 M2 resistance); a Medistor A-35 negative resistance electrometer amplifier and a differential DC Oscilloriter were used in (b).
duration, number of constituent signals, and intersequence intervals to those recorded with gross electrodes from the same explant (Fig. XVI-9). Each sequence recorded with microelectrodes was associated with a DC shift. "Group A" and "Group B" types of
activity were recognizable, and when "Group A" type of activity occurred alone, it was associated with a small DC shift. This DC shift seems to be an integral part of the sequence and is more marked during the "Group B" type of activity than during the "Group A" activity. Thus there are functional neurons in the explant and, although much more work remains to be done, it seems likely from the similarities between the pat-terns of potentials obtained with gross electrodes and with microelectrodes placed close to visually identifiable neurons, that these neurons participate in the phenomenon that we are investigating (see Fig. XVI-10).
7. Computer Processing of Data
During experiments, the activity from explants is recorded on analog tape with Grass P511 R amplifiers (or for DC recordings, the Medistor amplifier described above). These analog tapes are processed by using programs written for the PDP 4 computer and accessory equipment that is available in our laboratory. Figures XVI-Z, XVI-3, and XVI-4 are the product of this computer processing of data.
In summary, the signals and the signal groups occurring spontaneously in explants of chick embryo telencephalon and cerebellum in vitro have been described. Each has its own characteristic features and we conclude that in telencephalon at least two types of
functional brain cells must be involved. Evidence has been given for the presence of living neurons in the explants and for their participation in the formation of the
QPR No. 79
Si : , ::~i~~ly~i ii :i _7i:llli: : : !i erp-ru
DRUM
( ON SHAFT)
Fig. XVI-10.
STOP MICROSWITCHES
(TOP VIEW) SHAFT
( APPLIES BRAKE )
PRESSURE PLATE
RAZOR BLADE BRAKE ASSEMBLY
( ONE SHOE ON EACH SIDE, LEFT NOT SHOWN)
, MOTOR
( REVERSABLE )
HORIZONTAL CUTTER BRAKE ASSEMBLY
RAZOR BLADE
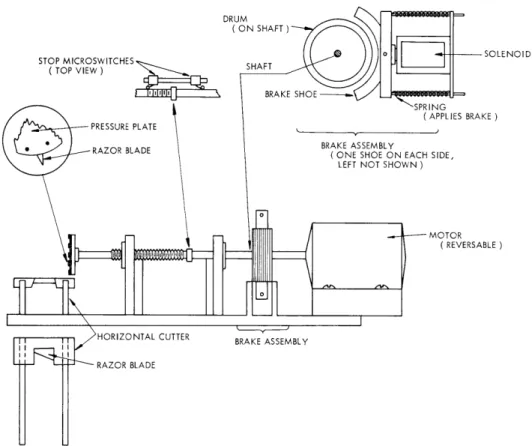
Automatic Explant Cutter: This provides uniformly thick slices of brain tissue rapidly and with a minimum of distortion. It is now used with chick embryo brain tissue. The chick with its brain exposed and cooled in a stream of cold nutrient fluid is placed between the guide channels for the horizontal blade of the cutter and under the rotatory blade. It is positioned precisely with the aid of a simple optical system that aligns the upper surface of the area of brain to be cut with the upper portion of the razor blade inserted in the rotatory wheel. Thus the depth of cut is controlled and the wheel itself cannot injure the brain. A reversible electric motor drives a threaded shaft by means of a sliding keyway, thereby allowing the threaded shaft to advance while the motor remains stationary. The cutting blade is a piece of razor blade held in a wheel at the end of the threaded shaft. This blade advances through the brain as it rotates and cuts nearly vertical slices. The thickness of the cut can be varied by using different threaded shafts or by placing two or three blades in the cutting wheel. The blade cannot over-run its course because it is stopped by a safety microswitch that is tripped automati-cally as the end of the thread approaches the front bushing. The blade can be stopped either by pressing a push-button manually or depressing a floor switch. The blade is stopped rapidly even at high speeds by the solenoid activation of the clamping of 2 spring-loaded brake shoes onto a 3-inch aluminum drum mounted on the drive shaft directly ahead of the motor. In this way, the blade can be halted within one revolution. Once the vertical cuts have been made, the horizontal blade is slid rapidly
across the section of the brain that has already been cut vertically, and the slices of brain are carried forward with the horizontal blade and can be washed from its upper surface into a Petri dish.
(XVI. COMMUNICATIONS BIOPHYSICS)
spontaneous potentials. Techniques have been described which offer an almost two-dimensional display of functional brain cells in an active living network, where each cell can be directly visualized.
A. W. B. Cunningham, R. R. Rojas Corona, J. A. Freeman, P. H. Levine References
1. A. W. B. Cunningham, "Spontaneous Potentials from Explants of Human Adult Cere-bellum in Culture," Nature 190, 918 (1961).
2. A. W. B. Cunningham, "Qualitative Behavior of Spontaneous Potentials from Explants of 15-Day Chick Embryo Telencephalon in Vitro," J. Gen. Physiol. 45, 1074 (1962). 3. R. W. Gerard and J. Z. Young in Proc. Roy. Soc. (London) 122B, 343 (1937). 4. E. D. Adrian and F. J. J. Burtendijk, J. Physiol. 71, 121 (1931).
5. E. D. Arian, J. Physiol. 72, 132 (1931).
6. A. W. B. Cunningham and B. J. Rylander, "Behavior of Spontaneous Potentials from Chick Cerebellar Explant During 120 Hours in Culture," J. Neurophysiol. 24, 141 (1961).