HAL Id: hal-00304186
https://hal.archives-ouvertes.fr/hal-00304186
Submitted on 26 May 2008HAL is a multi-disciplinary open access
archive for the deposit and dissemination of sci-entific research documents, whether they are pub-lished or not. The documents may come from teaching and research institutions in France or abroad, or from public or private research centers.
L’archive ouverte pluridisciplinaire HAL, est destinée au dépôt et à la diffusion de documents scientifiques de niveau recherche, publiés ou non, émanant des établissements d’enseignement et de recherche français ou étrangers, des laboratoires publics ou privés.
Nitric acid in the stratosphere based on Odin
observations from 2001 to 2007 ? Part 1: A global
climatology
Joanna Urban, M. Pommier, D. P. Murtagh, M. L. Santee, Y. J. Orsolini
To cite this version:
Joanna Urban, M. Pommier, D. P. Murtagh, M. L. Santee, Y. J. Orsolini. Nitric acid in the strato-sphere based on Odin observations from 2001 to 2007 ? Part 1: A global climatology. Atmospheric Chemistry and Physics Discussions, European Geosciences Union, 2008, 8 (3), pp.9569-9590. �hal-00304186�
ACPD
8, 9569–9590, 2008 Stratospheric HNO3 climatology J. Urban et al. Title Page Abstract Introduction Conclusions References Tables Figures ◭ ◮ ◭ ◮ Back Close Full Screen / EscPrinter-friendly Version Interactive Discussion Atmos. Chem. Phys. Discuss., 8, 9569–9590, 2008
www.atmos-chem-phys-discuss.net/8/9569/2008/ © Author(s) 2008. This work is distributed under the Creative Commons Attribution 3.0 License.
Atmospheric Chemistry and Physics Discussions
Nitric acid in the stratosphere based on
Odin observations from 2001 to 2007 –
Part 1: A global climatology
J. Urban1, M. Pommier1,*, D. P. Murtagh1, M. L. Santee2, and Y. J. Orsolini3
1
Chalmers University of Technology, Department of Radio and Space Science, G ¨oteborg, Sweden
2
NASA Jet Propulsion Laboratory, California Institute of Technology, Pasadena, USA
3
Norwegian Institute for Air Research, Kjeller, Norway
*
now at: Service d’A ´eronomie/Institut Pierre-Simon Laplace, CNRS, Universit ´e Pierre et Marie Curie, Paris 6, France
Received: 22 January 2008 – Accepted: 7 April 2008 – Published: 26 May 2008 Correspondence to: J. Urban ([email protected])
Published by Copernicus Publications on behalf of the European Geosciences Union.
ACPD
8, 9569–9590, 2008 Stratospheric HNO3 climatology J. Urban et al. Title Page Abstract Introduction Conclusions References Tables Figures ◭ ◮ ◭ ◮ Back Close Full Screen / EscPrinter-friendly Version Interactive Discussion
Abstract
The Sub-Millimetre Radiometer (SMR) on board the Odin satellite, launched in Febru-ary 2001, observes thermal emissions of stratospheric nitric acid (HNO3) originating from the Earth limb in a band centred at 544.6 GHz. Height-resolved measurements of the global distribution of nitric acid in the stratosphere between ∼18–45 km (∼1.5–
5
60 hPa) were performed approximately on two observation days per week. An HNO3 climatology based on roughly 6 years of observations from August 2001 to December 2007 was created. The study highlights the spatial and seasonal variation of nitric acid in the stratosphere, characterised by a pronounced seasonal cycle at middle and high latitudes with maxima during late fall and minima during spring, strong denitrification
10
in the lower stratosphere of the Antarctic polar vortex during winter (the irreversible removal of NOy by the sedimentation of cloud particles containing HNO3), as well as high quantities of HNO3 formed every winter at high-latitudes in the middle and upper stratosphere. A strong inter-annual variability is observed in particular at high latitudes. A comparison with a stratospheric HNO3 climatology based on UARS/MLS
measure-15
ments from the 1990s shows a good consistency and agreement of the main mor-phological features in the potential temperature range ∼465 to ∼960 K, if the different characteristics of the data sets such as altitude range and resolution are considered.
1 Introduction
Nitric acid (HNO3) is an important chemical constituent in the stratosphere. It is
20
one of the most abundant species of the NOy family (NOy=HNO3, NO2, NO, N2O5, ClONO2, . . . ) and thus a major reservoir of active odd nitrogen (NOx=NO+NO2) which is responsible for the main catalytic ozone loss cycle in the middle stratosphere. The main chemical source of nitric acid is the three-body gas-phase reaction
OH + NO2+ M −→ HNO3+ M , (R1)
ACPD
8, 9569–9590, 2008 Stratospheric HNO3 climatology J. Urban et al. Title Page Abstract Introduction Conclusions References Tables Figures ◭ ◮ ◭ ◮ Back Close Full Screen / EscPrinter-friendly Version Interactive Discussion major sinks are photolysis
HNO3+ hν −→ OH + NO2 (R2)
and the reaction
HNO3+ OH −→ H2O + NO3 (R3)
(e.g. Austin et al., 1986; Brasseur et al., 1999). The molecule can additionally be
5
formed during midwinter in the polar middle and upper stratosphere from the down-ward flux of mesospheric NOx(e.g. Sepp ¨al ¨a et al.,2004;Rinsland et al.,2005;Funke et al.,2005;Randall et al.,2006;Hauchecorne et al.,2007) through a height-dependent combination of water-ion cluster chemistry and heterogeneous conversion on sulfate aerosols involving the night-time reservoir N2O5(e.g.de Zafra and Smyshlyaev,2001;
10
Orsolini et al.,2005;Stiller et al.,2005). Nitric acid is also known to play an important role for processes related to ozone depletion in the polar lower stratosphere. Hetero-geneous chemical processes involving HNO3 on the surfaces of polar stratospheric cloud (PSC) particles lead to the activation of chlorine (ClOx=Cl+ClO) from its reser-voir gases in the cold polar vortices during winter and to ozone loss when sunlight
15
returns in late winter and spring. Denitrification, the irreversible removal of NOy by sedimentation of PSC particles containing HNO3, delays chlorine deactivation through reformation of the chlorine reservoir ClONO2during spring and may therefore lead to prolonged ozone loss (e.g.Tabazadeh et al.,2000,2001).
Stratospheric nitric acid has been measured from the ground and from space by
20
a variety of passive sensors operating at infrared and millimetre wavelengths. The longest data set so far is based on measurements made between 1991 and 1998 by the Microwave Limb Sounder (MLS) on the Upper Atmosphere Research Satellite (UARS) (Santee et al.,2004).
Here we present a global climatology of stratospheric nitric acid retrieved from recent
25
observations of the Sub-Millimetre Radiometer (SMR) on the Odin satellite spanning the 6-year period from August 2001 to December 2007. In Sect.2we describe the char-acteristics of the Odin/SMR measurements and provide an overview of the observed
ACPD
8, 9569–9590, 2008 Stratospheric HNO3 climatology J. Urban et al. Title Page Abstract Introduction Conclusions References Tables Figures ◭ ◮ ◭ ◮ Back Close Full Screen / EscPrinter-friendly Version Interactive Discussion global distribution and the spatial and temporal variability of HNO3in the stratosphere.
In Sect.3, the climatological data sets obtained with Odin/SMR and UARS/MLS are compared and differences are discussed.
2 Odin HNO3climatology
2.1 Measurements
5
The Odin Sub-Millimetre Radiometer (SMR) (Frisk et al., 2003), launched in 2001, measures thermal emissions of nitric acid in a band centred at 544.6 GHz. Global fields of HNO3 were measured between ∼83◦N and ∼83◦S on roughly one day out of three until April 2007 and on every second day since May 2007, based on 14–15 orbits per observation day and about 60 limb scans per orbit.
10
HNO3 volume mixing ratios are retrieved in the stratosphere above 17–18 km (at high latitudes) with a single profile precision of about 1 ppbv (10–15 % below 30 km) and a resolution in altitude of 1.5–2 km, degrading with increasing altitude (e.g. ∼3 km at 35 km) (e.g.Urban et al.,2007b). On four orbits per day, when the ground station is not available for data down-link, limitations of the spectrometer read-out data rate
15
apply, constrained by the satellite’s on-board memory, and the vertical resolution is limited to 3 km. The horizontal resolution of the limb measurements is of the order of 300 km, determined by the limb path in the tangent-layer. The satellite motion of 7 km/s leads to an additional uncertainty of the mean profile position of similar magnitude.
The systematical error derived from known instrumental and spectroscopic
uncer-20
tainties has been estimated to be better than 0.7 ppbv (Urban et al., 2005c). Com-parisons with measurements of other space-borne sensors such as the Michelson In-terferometer for Passive Atmospheric Sounding (MIPAS) on the Envisat satellite, the Microwave Limb Sounder (MLS) on Aura, as well as the Atmospheric Chemistry Ex-periment Fourier Transform Spectrometer (ACE-FTS) on SCISAT-1 however indicate
25
ACPD
8, 9569–9590, 2008 Stratospheric HNO3 climatology J. Urban et al. Title Page Abstract Introduction Conclusions References Tables Figures ◭ ◮ ◭ ◮ Back Close Full Screen / EscPrinter-friendly Version Interactive Discussion current Chalmers version-2.0 retrievals and a small negative bias of roughly 0.5 ppbv
in the range 35–45 km (Urban et al.,2006;Wang et al.,2007a,b;Santee et al.,2007a; Wolff et al.,2008). Different approaches to correct for the evident bias in the Chalmers-v2.0 HNO3 retrievals have been explored: Wang et al. (2007a) suggested to simply correct for an average altitude offset of 1.5 km in order to improve agreement with
5
MIPAS HNO3 retrievals,Urban et al.(2006) published a linear fit to operational MIPAS and Odin retrievals (VMRMIPAS=0.77039×VMROdin+0.48e-9) andBrohede et al.(2008) used a quadratic fit to HNO3measurements from ACE and Odin after applying a shift of 1 km for deriving a correction term (VMRACE=1.11×VMROdin–0.026e9×VMR2Odin). In this study, we decided to shift the profiles upward by 1 km to eliminate the altitude offset
10
and to apply the simple linear correction suggested byUrban et al. (2006). This cor-rection leads globally to an excellent agreement with ACE-FTS measurements within 0.5 ppbv in the 19–35 km range or better 10% between 19 and 30 km, comparable with the results obtained byBrohede et al.(2008) (not shown).
Only Odin/SMR level-2 profiles with good quality (assigned quality flag: QUALITY=0)
15
were used. The measurement response, provided in the level-2 files for each retrieval level, was required to be larger than 0.67 in order to exclude altitude ranges where a priori information, used by the “Optimal Estimation” type retrieval algorithm for sta-bilisation, dominates the retrieved mixing ratios (seeUrban et al., 2005c, 2007b, for details).
20
2.2 Global distribution
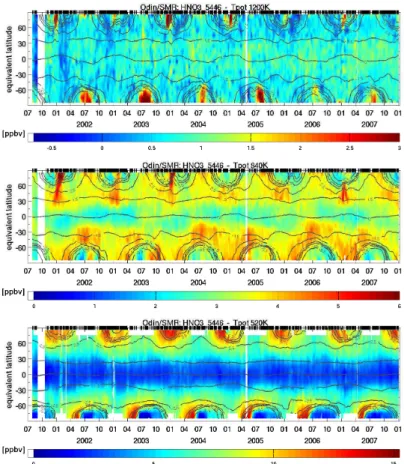
The seasonal evolution of the global distribution of HNO3 observed by Odin/SMR is shown in Fig.1for 6 years of observations between 2001 and 2007 and selected levels of potential temperature in the stratosphere. Individual profile measurements were linearly interpolated on potential temperature levels before being averaged in 10◦ wide
25
equivalent latitude bands on each observation day. Equivalent latitude is the latitude of a given potential vorticity contour if it was centred around the pole enclosing the same area as the original contour. Equivalent latitudes thus provide a coordinate system
ACPD
8, 9569–9590, 2008 Stratospheric HNO3 climatology J. Urban et al. Title Page Abstract Introduction Conclusions References Tables Figures ◭ ◮ ◭ ◮ Back Close Full Screen / EscPrinter-friendly Version Interactive Discussion relative to the polar vortices, the latter being characterised by high values of potential
vorticity and consequently high equivalent latitudes. We used potential vorticity data obtained from the European Centre for Medium-range Weather Forecast (ECMWF), scaled according toLait(1994), to derive equivalent latitudes.
In the lower stratosphere at the potential temperature level of 520 K (just above
5
∼20 km or 50 hPa), the measurements show an increase of the mixing ratios from low to high equivalent latitudes and a strong seasonal cycle at high latitudes with build-up of HNO3during fall and decrease during late winter and spring, as expected from gas-phase chemistry (e.g.Austin et al., 1986; Santee et al.,2004). In the Southern hemisphere, the cycle is interrupted inside the Antarctic vortex by a strong depletion of
10
HNO3during June which is completed in July and can be associated with cold temper-atures and the formation of polar stratospheric clouds implying removal of HNO3 from the gas-phase. At the same time, a collar of HNO3rich air is observed at and around the vortex edge. Whilst relatively low values of HNO3inside the Antarctic vortex persist until the vortex break-up, thus indicating denitrification, this effect is not observed in the
15
Northern hemisphere where notably low values of HNO3 were only measured at this level on a few occasions and during relatively short periods, e.g. in December 2002, December 2004–January 2005 (see alsoUrban et al.,2006), and February 2007 dur-ing relatively cold Arctic winters.
In the middle stratosphere on the 1200 K level (∼36–38 km), the observed global
20
HNO3 field is characterised by maxima occurring with considerable inter-annual vari-ability inside the winter polar vortices mainly during July–August in the Southern hemi-sphere and during December–January in the Northern hemihemi-sphere, and elsewhere by low mixing ratios below the noise level of about ±0.5 ppbv in the daily averages at this level.
25
Further down, on the 840 K level of potential temperature corresponding to approx-imately 30 km, the HNO3 fields inside the polar vortices show first minima during late fall and early winter, caused by subsidence of HNO3 poor air from higher levels, and then maxima similar to those seen on the 1200 K level, but slightly delayed in time. In
ACPD
8, 9569–9590, 2008 Stratospheric HNO3 climatology J. Urban et al. Title Page Abstract Introduction Conclusions References Tables Figures ◭ ◮ ◭ ◮ Back Close Full Screen / EscPrinter-friendly Version Interactive Discussion the northern hemisphere the enhancements are not necessarily confined to the polar
vortex and high latitudes. Mixing ratios outside the vortices are higher at mid-latitudes than in the tropics. At middle and low latitudes the HNO3 field shows a time-varying asymmetry with respect to the equator which might be attributed to a modulation due to tropical oscillations such as the semi-annual (SAO) and quasi-biennal oscillations
5
(QBO), as suggested earlier byKumer et al. (1996) who noted a hemispheric asym-metry in measurements of the Cryogenic Limb Array Etalon Spectrometer (CLAES) onboard the UARS satellite.
2.3 High equivalent latitudes
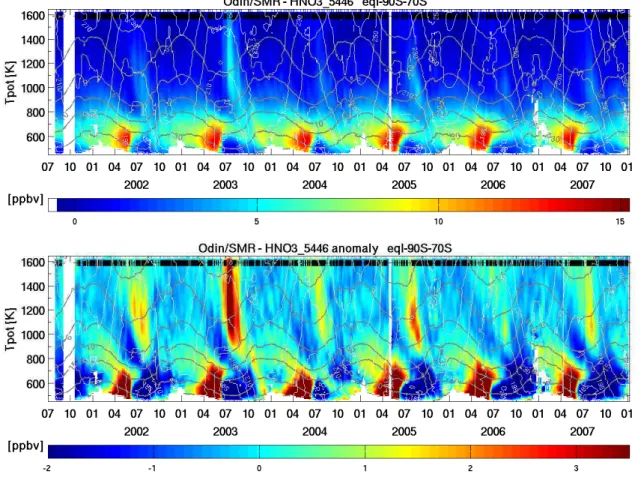
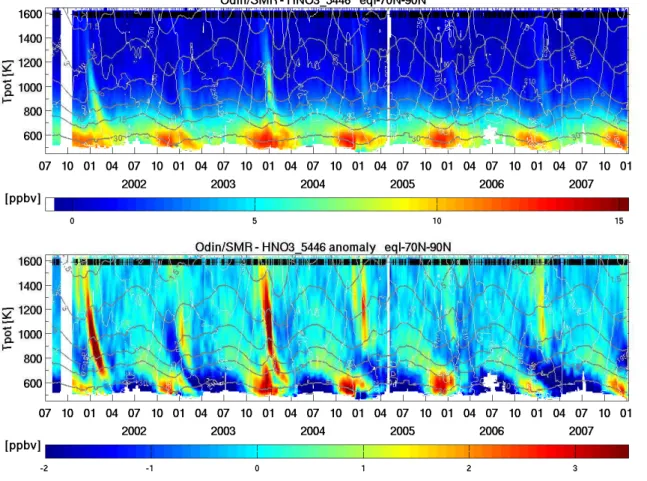
The vertical structure and seasonal evolution of the observed nitric acid fields at high
10
equivalent latitudes (larger than 70◦) is presented in Fig.2for the Southern hemisphere and in Fig. 3 for the Northern hemisphere. The measurements show clearly: (1) a main layer of HNO3 between roughly 10–15 and 50 hPa (∼20–30 km or ∼500–800 K) with a maximum around 25–30 hPa (23–25 km or ∼600 K); (2) a strong seasonal cy-cle with maxima during late fall/early winter, with the southern maximum in May being
15
slightly larger than the northern maximum in December; (3) a considerable depletion of HNO3 in the Antarctic from June to October–November in the lower stratosphere below ∼15 hPa (or 650–700 K); (4) middle and upper stratospheric HNO3 enhance-ments forming above ∼10 hPa (∼30 km or ∼800 K) typically in July–August (SH) and December–January (NH), characterised by a considerable inter-annual variability; and
20
(5) a gradual descent of the high altitude HNO3 enhancements during winter, joining the main layer in the periods August–October (SH) and February–March (NH). The bot-tom plots in Figs.2and3, representing the differences from the average profile, nicely show the alternation of downward transport of HNO3poor air through the middle strato-sphere in the beginning of the winter and of HNO3rich air after chemical formation: a
25
“reversed tape-recorder effect”, with downward transported air carrying the signature of middle stratospheric HNO3 formed above 10 hPa during a short mid-winter period, thus contributing to the NOy budget of the lower stratosphere with a delay determined
ACPD
8, 9569–9590, 2008 Stratospheric HNO3 climatology J. Urban et al. Title Page Abstract Introduction Conclusions References Tables Figures ◭ ◮ ◭ ◮ Back Close Full Screen / EscPrinter-friendly Version Interactive Discussion by the vertical transport rates. For a more detailed discussion of the Odin
observa-tions of enhanced HNO3 in the middle and upper stratosphere and the connection to the variability of solar activity and meteorological conditions, the reader is referred to Orsolini et al.(2008).
3 Inter-annual variability and comparison with UARS/MLS climatology
5
The seasonal cycle and inter-annual variability of the Odin measurements of nitric acid in the Northern and Southern hemisphere are presented for potential tempera-ture levels in the lower stratosphere (520 K), and in the middle stratosphere (960 K) in Figs.4and5.
The Odin climatology is compared to a global climatology of nitric acid inferred from
10
measurements of the UARS/MLS experiment between 1991 and 1998. The MLS ver-sion 6 HNO3 profiles, retrieved from limb observations of a small spectral feature at 205 GHz, are characterised by a horizontal resolution typical for limb sounding of the order of 400 km, a vertical resolution ranging from 4.5 to 10.5 km within the pressure range 100–4.6 hPa (∼16–36 km), a single-profile precision between 1 and 1.5 ppbv,
15
and an estimated accuracy around 2–3 ppbv. Frequent 180◦ yaw manoeuvres of the UARS satellite, about 10 times per year, allowed to alternately cover high latitudes of both hemispheres (∼80◦S to ∼80◦N) despite the inclination of 57◦ of the UARS orbit (Livesey et al.,2003;Santee et al.,2004).
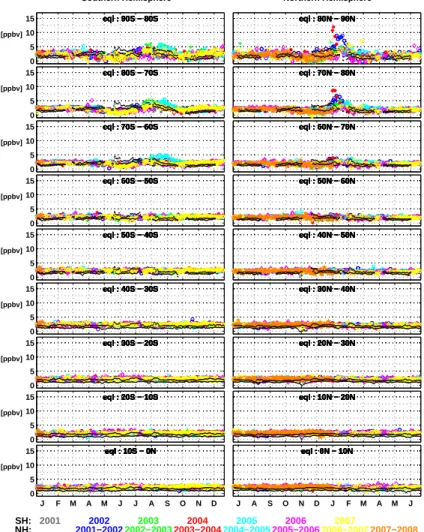
Figure 4 shows the seasonal cycle of HNO3 in the lower stratosphere (520 K) for
20
the different years of Odin observations compared to the 7-year record from MLS, represented by its ±1σ standard deviation. In the tropics (equivalent latitudes lower than 20◦), mixing ratios are low (<5 ppbv) with the corrected Odin measurements be-ing slightly higher than MLS measurements by 1–2 ppbv. At mid-latitudes between ∼20–60◦the agreement between the two data sets is excellent. The amplitude of the
25
seasonal cycle increases towards high latitudes with the southern high latitude max-imum in May being slightly higher than the northern maxmax-imum in December. At high
ACPD
8, 9569–9590, 2008 Stratospheric HNO3 climatology J. Urban et al. Title Page Abstract Introduction Conclusions References Tables Figures ◭ ◮ ◭ ◮ Back Close Full Screen / EscPrinter-friendly Version Interactive Discussion equivalent latitudes (>60◦), a considerable inter-annual variability is found in the Odin
measurements in both hemispheres during winter and spring (SH: June–November; NH: December–March). In the Southern hemisphere, the inter-annual variability ob-served by Odin is more pronounced than in the MLS observations during the periods when HNO3 mixing ratios are particularly low, both in the onset phase of
denitrifica-5
tion during June and in the recovery phase from August to November. Moreover, Odin data show slightly larger minimum values of HNO3during July than MLS. The seasonal HNO3maximum in April–May observed by Odin is on the other hand slightly lower than the MLS maximum. In the Northern hemisphere, mid-winter values observed by Odin are systematically slightly lower by 2–3 ppbv than the range indicated by the MLS
cli-10
matology. In the vortex edge regions (equivalent latitudes of 60◦–70◦), the agreement between the climatologies in terms of variability is very good in both hemispheres, with Odin values being slightly lower in the Northern hemisphere. Besides consider-ing the estimated overall accuracy of the MLS and (bias-corrected) Odin climatological data sets of 2–3 ppbv and 0.5–1 ppbv, respectively, the observed differences might also
15
partly be attributed to the better vertical resolution of the Odin/SMR measurement of 1.5–2 km compared to the coarser ∼6 km for UARS/MLS at 520 K, which might lead to inclusion of nitric acid rich or poor air from lower or higher levels into the retrieved mix-ing ratios. This effect is most critical in the presence of strong vertical profile gradients, namely for the pronounced HNO3main layer at high latitudes.
20
At 960 K, the highest level of the MLS climatology, the Odin measurements agree generally well with the MLS climatology showing no or only a very small positive bias, except for the highest equivalent latitudes where Odin data seem to be slightly lower than MLS data during early winter. Particular enhancements in the Odin HNO3 data at this level were frequently observed, namely during July–August 2003 and 2005 in
25
the Southern hemisphere and during December–January in the Northern hemisphere with the winters 2001–2002 and 2003–2004 being most significant. In contrast, the MLS 7-year climatology from the 1990s does not show a significant enhancement or increase of variability during these periods on the 960 K level, which might be attributed
ACPD
8, 9569–9590, 2008 Stratospheric HNO3 climatology J. Urban et al. Title Page Abstract Introduction Conclusions References Tables Figures ◭ ◮ ◭ ◮ Back Close Full Screen / EscPrinter-friendly Version Interactive Discussion to the degrading vertical resolution and sensitivity of the UARS/MLS measurements in
the middle stratosphere.
The annual variability of stratospheric HNO3at high equivalent latitudes (70–90◦) in both hemispheres is shown for various levels between 420 and 1600 K in Fig.6.
On the lowest levels (420 and 465 K) Odin data are relatively sparse, since these
5
levels are very close to the instruments lower measurement limit for HNO3, with most data obtained inside the Antarctic polar vortex. The agreement between Odin and MLS is here fairly good during June/July to September with very low mixing ratios below 5 ppbv every year, compared to up to ∼13 ppbv measured by MLS during May on the 465 K level. Odin mixing ratios in the lower stratosphere are larger than MLS values
10
during October with the agreement becoming better in November due to increasing MLS mixing ratios. At northern high equivalent latitudes, low values of nitric acid are mainly found in the winters 2004–2005 and 2006–2007, whilst the available data do not indicate a significant depletion of HNO3in the other years.
The depletion of HNO3 in the Antarctic vortex during winter and spring (June–
15
November) can also be seen on the 520 and 585 K levels. Above, on the 655 K and 740 K levels, Odin measurements show a less pronounced seasonal cycle compared to MLS measurements, which is most likely caused by the limited altitude resolution of the MLS measurements. The latter show the signature of denitrification up to 740–840 K, whilst Odin observations contain this signal up to maximal 655 K. In the Northern
hemi-20
sphere, mid-winter maxima between 465 and 655 K are systematically lower than the range indicated by the MLS climatology, whilst the agreement appears to be generally excellent during summer (April–October).
Finally, at the highest levels, shown here between 960 and 1600 K, particular en-hancements in the Odin HNO3 data were frequently observed during July–August in
25
the Southern hemisphere and during December–January in the Northern hemisphere. The signal might be followed down to the 655 to 740 K levels (before it joins the main HNO3layer) and contributes there to the observed range of variability.
ACPD
8, 9569–9590, 2008 Stratospheric HNO3 climatology J. Urban et al. Title Page Abstract Introduction Conclusions References Tables Figures ◭ ◮ ◭ ◮ Back Close Full Screen / EscPrinter-friendly Version Interactive Discussion
4 Summary and conclusions
Measurements of the Odin satellite provide a quasi-continuous 6-year climatological data set of nitric acid in the stratosphere from August 2001 to December 2007. Obser-vations are still ongoing at the time of writing. We have presented an overview of the global distribution and temporal evolution of stratospheric HNO3, based on corrected
5
version 2.0 level-2 data.
HNO3 increases from the tropics towards the poles, where it shows a pronounced seasonal cycle with maxima in late fall/early winter. Particular morphological features of the spatio-temporal distribution are the strong depletion from June to October– November in the lower stratosphere of the Antarctic polar vortex as well as the high
10
nitric acid mixing ratios found in the middle and upper stratosphere during mid-winter due to downward transport and heterogeneous conversion of NOxrich mesospheric air (de Zafra and Smyshlyaev,2001).
A comparison with a climatology derived from UARS/MLS measurements in the 1990s (Santee et al.,2004) results in a fairly good agreement if systematic differences
15
of the measurements are considered, in particular the considerably better altitude res-olution of Odin/SMR as well as the slightly different altitude ranges of both instruments, with Odin reaching higher up and MLS lower down in the stratosphere.
Acknowledgements. Odin is a Swedish-led satellite project funded jointly by Sweden (SNSB),
Canada (CSA), Finland (TEKES), France (CNES), and supported since 2007 by the third party
20
mission programme of the European Space Agency (ESA). Work at the Jet Propulsion Labo-ratory, California Institute of Technology, was done under contract with the National Aeronau-tics and Space Administration (NASA). We like to acknowledge the contributions of J. M ¨oller, P. Eriksson, M. Olberg, and G. Persson to the Odin/SMR level-1b and level-2 processing sys-tem. Odin/SMR version 2.0 level-2 data can be obtained fromhttp://www.rss.chalmers.se/gem/.
25
ACPD
8, 9569–9590, 2008 Stratospheric HNO3 climatology J. Urban et al. Title Page Abstract Introduction Conclusions References Tables Figures ◭ ◮ ◭ ◮ Back Close Full Screen / EscPrinter-friendly Version Interactive Discussion
References
Austin, J., Garcia, R., Russel-III, J., Solomon, S., and Tuck, A.: On the atmospheric photo-chemistry of nitric acid, J. Geophys. Res., 91, 5477–5484, 1986.9571,9574
Brasseur, G., Orlando, J., and Tyndall, G.: Atmospheric Chemistry and Global Change, Oxford University Press, New York, Oxford, 2nd edn., ISBN-0-19-510521-4, 1999. 9571
5
Brohede, S., McLinden, C., Urban, J., Haley, C., Jonsson, A., and Murtagh, D.: Odin strato-spheric proxy NOy measurements and climatology, Atmos. Chem. Phys. Discuss., 8, 5847–
5899, 2008,
http://www.atmos-chem-phys-discuss.net/8/5847/2008/. 9573
de Zafra, R. and Smyshlyaev, S.: On the formation of HNO3 in the Antarctic mid to upper
10
stratosphere in winter, J. Geophys. Res., 106, 23 115–23 125, 2001. 9571,9579
Frisk, U., Hagstr ¨om, M., Ala-Laurinaho, J., Andersson, S., Berges, J.-C., Chabaud, J.-P., Dahlgren, M., Emrich, A., Flor ´en, H.-G., Florin, G., Fredrixon, M., Gaier, T., Haas, R., Hir-vonen, T., Hjalmarsson, ˚A., Jakobsson, B., Jukkala, P., Kildal, P., Kollberg, E., Lassing, J., Lecacheux, A., Lehikoinen, P., Lehto, A., Mallat, J., Marty, C., Michet, D., Narbonne, J.,
15
Nexon, M., Olberg, M., Olofsson, O., Olofsson, G., Orign ´e, A., Petersson, M., Piironen, P., Pons, R., Pouliquen, D., Ristocelli, I., Rosolen, C., Rouaix, G., R ¨ais ¨anen, A., Serra, G., Sj ¨oberg, F., Stenmark, L., Torchinsky, S., Tuovinen, J., Ullberg, C., Vinterhav, E., Wadefalk, N., Zirath, H., Zimmermann, P., and Zimmermann, R.: The Odin satellite: I. Radiometer design and test, Astron. Astrophys., 402, L27–34, 2003. 9572
20
Funke, B., L ´opez-Puertas, M., Gil-L ´opez, S., von Clarmann, T., Stiller, G. P., Fischer, H., and Kellmann, S.: Downward transport of upper atmospheric NOx into the polar stratosphere
and lower mesosphere during the Antarctic 2003 and Arctic 2002/2003 winters, J. Geophys. Res., 110, D24308, doi:10.1029/2005JD006463, 2005. 9571
Hauchecorne, A., Bertaux, J.-L., Dalaudier, F., Russell, J. M., Mlynczak, M. G., Kyr ¨ol ¨a, E., and
25
Fussen, D.: Large increase of NO2in the north polar mesosphere in January–February 2004:
Evidence of a dynamical origin from GOMOS/ENVISAT and SABER/TIMED data, Geophys. Res. Lett., 34, 3810–3813, L03810, doi:10.1029/2006GL027628, 2007. 9571
Kumer, J., Mergenthaler, J., Roche, A., Nightingale, R., Ely, G. A., Uplinger, W. G., Gille, J. C., Massie, S., Bailey, P., Gunson, M. R., Abrams, M. C., Toon, G., Sen, B., Blavier,
J.-30
F., Stachnik, R. A., Webster, C. R., May, R., Murcray, D., Murcray, F., Goldman, A., Traub, W. A., Jucks, K., and Johnson, D.: Comparison of correlative data with HNO3 version 7
ACPD
8, 9569–9590, 2008 Stratospheric HNO3 climatology J. Urban et al. Title Page Abstract Introduction Conclusions References Tables Figures ◭ ◮ ◭ ◮ Back Close Full Screen / EscPrinter-friendly Version Interactive Discussion
from the CLAES instrument deployed on the NASA Upper Atmosphere Research Satellite, J. Geophys. Res., 101, 9621–9656, 1996. 9575
Lait, L.: An Alternative Form for Potential Vorticity, J. Atmos. Sci., 51, 1754–1759, 1994. 9574
Livesey, N. J., Read, W. G., Froidevaux, L., Waters, J. W., Santee, M. L., Pumphrey, H. C., Wu, D. L., Shippony, Z., and Jarnot, R. F.: The UARS Microwave Limb Sounder version
5
5 data set: Theory, characterization, and validation, J. Geophys. Res., D13, 4378, doi:10. 1029/2002JD002273, 2003.9576
Orsolini, Y., Manney, G., Santee, M., and Randall, C.: An upper stratospheric layer of enhanced HNO3 following exceptional solar storms, Geophys. Res. Lett., 32, L12S01, doi:10.1029/2004GL021588, 2005. 9571
10
Orsolini, Y., Urban, J., and Murtagh, D.: Nitric acid in the stratosphere based on Odin obser-vations from 2001 to 2007 – Part 2: High-altitude polar enhancements, Atmos. Chem. Phys. Discuss., 8, 9591–9605, 2008,
http://www.atmos-chem-phys-discuss.net/8/9591/2008/. 9576
Randall, C., Harvey, V., Singleton, C., Bernath, P., Boone, C., and Kozyra, J.: Enhanced NOx
15
in 2006 linked to strong upper stratospheric Arctic vortex, Geophys. Res. Lett., 33, L18811, doi:10.1029/2006GL027160, 2006. 9571
Rinsland, C., Boone, C., Nassar, R., Walker, K., Bernath, P., McConnell, J., and Chiou, L.: Atmospheric Chnistry Experiment (ACE) Arctic stratospheric measurements of NOx during
February and March 2004: Impact of intense solar flares, Geophys. Res. Lett., 32, L16S05,
20
doi:10.1029/2005GL022425, 2005. 9571
Santee, M., Manney, G., Livesey, N., and Read, W.: Three-dimensional structure and evolution of HNO3based on UARS Microwave Limb Sounder measurements, J. Geophys. Res., 109, D15306, doi:10.1029/2004JD004578, 2004. 9571,9574,9576,9579,9588
Santee, M., Lambert, A., Read, W., Livesey, N., Coeld, R., Cuddy, D., Daffer, W., Drouin, B.,
25
Froidevaux, L., Fuller, R., Jarnot, R., Knosp, B., Manney, G., Perun, V., Snyder, W., Stek, P., Thurstans, R., Wagner, P., Waters, J., Muscari, G., de Zafra, R., Dibb, J., Fahey, D., Popp, P., Marcy, T., Jucks, K., Toon, G., Stachnik, R., Bernath, P., Boone, C., Walker, K., Urban, J., and Murtagh, D.: Validation of the Aura Microwave Limb Sounder HNO3Measurements, J.
Geophys. Res., 112, D24S40, doi:10.1029/2007JD008721, 2007a.9573
30
Sepp ¨al ¨a, A., Verronen, T., Kyr ¨ol ¨a, E., Hassinen, S., Backman, L., Hauchecorne, A., Bertaix, J., and Fussen, D.: Solar proton events of October–November 2003: Ozone depletion in the Northern hemishpere polar winter as seen by GOMOS/ENVISAT, Geophys. Res. Lett., 31,
ACPD
8, 9569–9590, 2008 Stratospheric HNO3 climatology J. Urban et al. Title Page Abstract Introduction Conclusions References Tables Figures ◭ ◮ ◭ ◮ Back Close Full Screen / EscPrinter-friendly Version Interactive Discussion
L19107, doi:10.1029/2004GL021042, 2004. 9571
Stiller, G., Mengistu-Tsidu, G., von Clarmann, T., Gatthor, N., H ¨opfner, M., Kellmann, S., Lin-den, A., Ruhnke, R., Fischer, H., L ´opez-Puertas, M., Funke, B., and Gil-L ´opez, S.: An enhanced HNO3 second maximum in the Antarctic midwinter upper stratosphere 2003, J.
Geophys. Res., 110, D20303, doi:10.1029/2005JD006011, 2005.9571
5
Tabazadeh, A., Santee, M., Danilin, M., Pumphrey, H., Newman, P., Hamill, P., and Mergen-thaler, J.: Quantifying denitrification and its effect on ozone recovery, Science, 288, 1407– 1411, 2000. 9571
Tabazadeh, A., Jensen, E., Toon, O., Drdla, K., and Schoeberl, M.: Role of the stratospheric freezing belt in denitrification, Science, 291, 2591–2594, 2001. 9571
10
Urban, J., Lauti ´e, N., Le Flochmo ¨en, E., Jim ´enez, C., Eriksson, P., Dupuy, E., El Amraoui, L., Ekstr ¨om, M., Frisk, U., Murtagh, D., de La No ¨e, J., Olberg, M., and Ricaud, P.: Odin/SMR Limb Observations of Stratospheric Trace Gases: Level 2 Processing of ClO, N2O, O3, and
HNO3, J. Geophys. Res., 110, D14307, doi:10.1029/2004JD005741, 2005c.9572,9573
Urban, J., Murtagh, D., Lauti ´e, N., Barret, B., Dupuy, E., de La No ¨e, J., Eriksson, P., Frisk, U.,
15
Jones, A., Le Flochmo ¨en, E., Olberg, M., Piccolo, C., Ricaud, P., and R ¨osevall, J.: Odin/SMR Limb Observations of Trace Gases in the Polar Lower Stratosphere during 2004–2005, in: Proc. ESA First Atmospheric Science Conference, 8–12 May 2006, Frascati, Italy, edited by: Lacoste, H., vol. ESA-SP-628 of European Space Agency publications, European Space Agency, ISBN-92-9092-939-1, ISSN-1609-042X, 2006. 9573,9574
20
Urban, J., Pommier, M., Murtagh, D., Eriksson, P., and Ricaud, P.: Odin/SMR Limb Obser-vations of Nitric Acid in the Stratosphere, in: Proc. ESA Envisat Symposium, 23–27 April 2007, Montreux, Switzerland, edited by: Lacoste, H. and Ouwehand, L., vol. ESA-SP-636 of European Space Agency publications, European Space Agency, ISBN-92-9291-200-1, ISSN-1609-042X, 2007b. 9572,9573
25
Wang, D., H ¨opfner, M., Mengistu Tsidu, G., Stiller, G., von Clarmann, T., Fischer, H., Blumen-stock, T., Glatthor, N., Grabowski, U., Hase, F., Kellmann, S., Linden, A., Milz, M., Oelhaf, H., Schneider, M., Steck, T., Wetzel, G., Lopez-Puertas, M., Funke, B., Koukouli, M., Nakajima, H., Sugita, T., Irie, H., Urban, J., Murtagh, D., Santee, M., Toon, G., Gunson, M., Irion, F., Boone, C., Walker, K., and Bernath, P.: Validation of nitric acid retrieved by the IMK-IAA
30
processor from MIPAS/ENVISAT measurements, Atmos. Chem. Phys., 6, 721–738, 2007a,
http://www.atmos-chem-phys.net/6/721/2007/. 9573
ACPD
8, 9569–9590, 2008 Stratospheric HNO3 climatology J. Urban et al. Title Page Abstract Introduction Conclusions References Tables Figures ◭ ◮ ◭ ◮ Back Close Full Screen / EscPrinter-friendly Version Interactive Discussion
C., Liu, G. Y., Mikuteit, S., Oelhaf, H., Wetzel, G., Cortesi, U., Mencaraglia, F., Bianchini, G., Redaelli, G., Pirre, M., Catoire, V., Huret, N., Vigouroux, C., De Mazi `ere, M., Mahieu, E., Demoulin, P., Wood, S., Smale, D., Jones, N., Nakajima, H., Sugita, T., Urban, J., Murtagh, D., Boone, C. D., Bernath, P. F., Walker, K. A., Kuttippurath, J., Kleinb ¨ohl, A., Toon, G., and Piccolo, C.: Validation of MIPAS HNO3operational data, Atmos. Chem. Phys., 7, 4905–4934,
5
2007,
http://www.atmos-chem-phys.net/7/4905/2007/. 9573
Wolff, M., Kerzenmacher, T., Strong, K., Walker, K., Toohey, M., Dupuy, E., Bernath, P., Boone, C., Brohede, S., Catoire, V., von Clarmann, T., Coffey, M., Daffer, W., Mazi `ere, M. D., Duchatelet, P., Glatthor, N., Griffith, D., Hannigan, J., Hase, F., H ¨opfner, M., Huret, N., Jones,
10
N., Jucks, K., Kagawa, A., Kasai, Y., Kramer, I., K ¨ullmann, H., Kuttippurath, J., Mahieu, E., Manney, G., McLinden, C., M `ebarki, Y., Mikuteit, S., Murtagh, D., Piccolo, C., Ruhnke, R., Santee, M., Senten, C., Smale, D., T `etard, C., Urban, J., and Wood, S.: Validation of HNO3,
ClONO2 and N2O5 from the Atmospheric Chemistry Experiment Fourier Transform
Spec-trometer (ACE-FTS), Atmos. Chem. Phys. Discuss., 8, 2429–2512, 2008,
15
http://www.atmos-chem-phys-discuss.net/8/2429/2008/. 9573
ACPD
8, 9569–9590, 2008 Stratospheric HNO3 climatology J. Urban et al. Title Page Abstract Introduction Conclusions References Tables Figures ◭ ◮ ◭ ◮ Back Close Full Screen / EscPrinter-friendly Version Interactive Discussion
Fig. 1. Seasonal evolution of the global distribution of Odin/SMR daily zonal mean HNO3
on the 1200 K (top), 840 K (middle) and 520 K (bottom) levels of potential temperature as a function of equivalent latitude. Grey lines indicate contours of scaled potential vorticity. Data, averaged in 10◦ wide equivalent latitude bands, have been slightly smoothed in time (using a
7-day moving average filter) in order to fill the gaps between individual Odin/SMR stratospheric mode observation days, indicated by crosses at the top.
ACPD
8, 9569–9590, 2008 Stratospheric HNO3 climatology J. Urban et al. Title Page Abstract Introduction Conclusions References Tables Figures ◭ ◮ ◭ ◮ Back Close Full Screen / EscPrinter-friendly Version Interactive Discussion
Fig. 2. Seasonal evolution of Odin/SMR daily mean HNO3at high equivalent latitudes south of 70◦S as a function of potential temperature. Top: HNO
3 volume mixing ratio. Bottom:
Absolute deviation from the mean profile. Crosses at the top of the plots indicate observation days. Pressure and temperature (from ECMWF), averaged corresponding to the Odin/SMR measurements, are superimposed using grey and white contour lines.
ACPD
8, 9569–9590, 2008 Stratospheric HNO3 climatology J. Urban et al. Title Page Abstract Introduction Conclusions References Tables Figures ◭ ◮ ◭ ◮ Back Close Full Screen / EscPrinter-friendly Version Interactive Discussion
Fig. 3. Same as Fig.2, but for Northern hemisphere high equivalent latitudes north of 70◦N.
ACPD
8, 9569–9590, 2008 Stratospheric HNO3 climatology J. Urban et al. Title Page Abstract Introduction Conclusions References Tables Figures ◭ ◮ ◭ ◮ Back Close Full Screen / EscPrinter-friendly Version Interactive Discussion 0 5 10 15 eql : 90S − 80S [ppbv] eql : 90S − 80S eql : 90S − 80S eql : 90S − 80S eql : 90S − 80S eql : 90S − 80S eql : 90S − 80S
eql : 90S − 80S eql : 80N − 90Neql : 80N − 90Neql : 80N − 90Neql : 80N − 90Neql : 80N − 90Neql : 80N − 90Neql : 80N − 90N
0 5 10 15 eql : 80S − 70S [ppbv] eql : 80S − 70S eql : 80S − 70S eql : 80S − 70S eql : 80S − 70S eql : 80S − 70S eql : 80S − 70S
eql : 80S − 70S eql : 70N − 80Neql : 70N − 80Neql : 70N − 80Neql : 70N − 80Neql : 70N − 80Neql : 70N − 80Neql : 70N − 80N
0 5 10 15 eql : 70S − 60S [ppbv] eql : 70S − 60S eql : 70S − 60S eql : 70S − 60S eql : 70S − 60S eql : 70S − 60S eql : 70S − 60S
eql : 70S − 60S eql : 60N − 70Neql : 60N − 70Neql : 60N − 70Neql : 60N − 70Neql : 60N − 70Neql : 60N − 70Neql : 60N − 70N
0 5 10 15 eql : 60S − 50S [ppbv] eql : 60S − 50S eql : 60S − 50S eql : 60S − 50S eql : 60S − 50S eql : 60S − 50S eql : 60S − 50S
eql : 60S − 50S eql : 50N − 60Neql : 50N − 60Neql : 50N − 60Neql : 50N − 60Neql : 50N − 60Neql : 50N − 60Neql : 50N − 60N
0 5 10 15 eql : 50S − 40S [ppbv] eql : 50S − 40S eql : 50S − 40S eql : 50S − 40S eql : 50S − 40S eql : 50S − 40S eql : 50S − 40S
eql : 50S − 40S eql : 40N − 50Neql : 40N − 50Neql : 40N − 50Neql : 40N − 50Neql : 40N − 50Neql : 40N − 50Neql : 40N − 50N
0 5 10 15 eql : 40S − 30S [ppbv] eql : 40S − 30S eql : 40S − 30S eql : 40S − 30S eql : 40S − 30S eql : 40S − 30S eql : 40S − 30S
eql : 40S − 30S eql : 30N − 40Neql : 30N − 40Neql : 30N − 40Neql : 30N − 40Neql : 30N − 40Neql : 30N − 40Neql : 30N − 40N
0 5 10 15 eql : 30S − 20S [ppbv] eql : 30S − 20S eql : 30S − 20S eql : 30S − 20S eql : 30S − 20S eql : 30S − 20S eql : 30S − 20S
eql : 30S − 20S eql : 20N − 30Neql : 20N − 30Neql : 20N − 30Neql : 20N − 30Neql : 20N − 30Neql : 20N − 30Neql : 20N − 30N
0 5 10 15 eql : 20S − 10S [ppbv] eql : 20S − 10S eql : 20S − 10S eql : 20S − 10S eql : 20S − 10S eql : 20S − 10S eql : 20S − 10S
eql : 20S − 10S eql : 10N − 20Neql : 10N − 20Neql : 10N − 20Neql : 10N − 20Neql : 10N − 20Neql : 10N − 20Neql : 10N − 20N
J F M A M J J A S O N D 0 5 10 15 eql : 10S − 0N [ppbv] eql : 10S − 0N eql : 10S − 0N eql : 10S − 0N eql : 10S − 0N eql : 10S − 0N eql : 10S − 0N eql : 10S − 0N J A S O N D J F M A M J eql : 0N − 10N eql : 0N − 10N eql : 0N − 10N eql : 0N − 10N eql : 0N − 10N eql : 0N − 10N eql : 0N − 10N
Odin/SMR: HNO3_5446 − Tpot 520K
− Southern Hemisphere − − Northern Hemisphere −
SH:
NH: 2001 2001−20022002 2002−20032003 2003−20042004 2004−20052005 2005−20062006 2006−20072007 2007−2008
ACPD
8, 9569–9590, 2008 Stratospheric HNO3 climatology J. Urban et al. Title Page Abstract Introduction Conclusions References Tables Figures ◭ ◮ ◭ ◮ Back Close Full Screen / EscPrinter-friendly Version Interactive Discussion
Fig. 4. Inter-annual variability of Odin/SMR daily zonal mean HNO3interpolated on the 520 K level, compared to a climatology based on measurements by the MLS instrument on UARS in the 1990s. The different years of Odin measurements are colour coded (see legend). The black lines represent the ±1σ standard deviation of the UARS climatology and gaps at high equivalent latitudes are due to frequent 180◦ yaw manoeuvres of UARS (Santee et al.,2004).
Note that the x-axis range was chosen that the winter solstices are in the centre of the plots for both hemispheres.
ACPD
8, 9569–9590, 2008 Stratospheric HNO3 climatology J. Urban et al. Title Page Abstract Introduction Conclusions References Tables Figures ◭ ◮ ◭ ◮ Back Close Full Screen / EscPrinter-friendly Version Interactive Discussion 0 5 10 15 eql : 90S − 80S [ppbv] eql : 90S − 80S eql : 90S − 80S eql : 90S − 80S eql : 90S − 80S eql : 90S − 80S eql : 90S − 80S
eql : 90S − 80S eql : 80N − 90Neql : 80N − 90Neql : 80N − 90Neql : 80N − 90Neql : 80N − 90Neql : 80N − 90Neql : 80N − 90N
0 5 10 15 eql : 80S − 70S [ppbv] eql : 80S − 70S eql : 80S − 70S eql : 80S − 70S eql : 80S − 70S eql : 80S − 70S eql : 80S − 70S
eql : 80S − 70S eql : 70N − 80Neql : 70N − 80Neql : 70N − 80Neql : 70N − 80Neql : 70N − 80Neql : 70N − 80Neql : 70N − 80N
0 5 10 15 eql : 70S − 60S [ppbv] eql : 70S − 60S eql : 70S − 60S eql : 70S − 60S eql : 70S − 60S eql : 70S − 60S eql : 70S − 60S
eql : 70S − 60S eql : 60N − 70Neql : 60N − 70Neql : 60N − 70Neql : 60N − 70Neql : 60N − 70Neql : 60N − 70Neql : 60N − 70N
0 5 10 15 eql : 60S − 50S [ppbv] eql : 60S − 50S eql : 60S − 50S eql : 60S − 50S eql : 60S − 50S eql : 60S − 50S eql : 60S − 50S
eql : 60S − 50S eql : 50N − 60Neql : 50N − 60Neql : 50N − 60Neql : 50N − 60Neql : 50N − 60Neql : 50N − 60Neql : 50N − 60N
0 5 10 15 eql : 50S − 40S [ppbv] eql : 50S − 40S eql : 50S − 40S eql : 50S − 40S eql : 50S − 40S eql : 50S − 40S eql : 50S − 40S
eql : 50S − 40S eql : 40N − 50Neql : 40N − 50Neql : 40N − 50Neql : 40N − 50Neql : 40N − 50Neql : 40N − 50Neql : 40N − 50N
0 5 10 15 eql : 40S − 30S [ppbv] eql : 40S − 30S eql : 40S − 30S eql : 40S − 30S eql : 40S − 30S eql : 40S − 30S eql : 40S − 30S
eql : 40S − 30S eql : 30N − 40Neql : 30N − 40Neql : 30N − 40Neql : 30N − 40Neql : 30N − 40Neql : 30N − 40Neql : 30N − 40N
0 5 10 15 eql : 30S − 20S [ppbv] eql : 30S − 20S eql : 30S − 20S eql : 30S − 20S eql : 30S − 20S eql : 30S − 20S eql : 30S − 20S
eql : 30S − 20S eql : 20N − 30Neql : 20N − 30Neql : 20N − 30Neql : 20N − 30Neql : 20N − 30Neql : 20N − 30Neql : 20N − 30N
0 5 10 15 eql : 20S − 10S [ppbv] eql : 20S − 10S eql : 20S − 10S eql : 20S − 10S eql : 20S − 10S eql : 20S − 10S eql : 20S − 10S
eql : 20S − 10S eql : 10N − 20Neql : 10N − 20Neql : 10N − 20Neql : 10N − 20Neql : 10N − 20Neql : 10N − 20Neql : 10N − 20N
J F M A M J J A S O N D 0 5 10 15 eql : 10S − 0N [ppbv] eql : 10S − 0N eql : 10S − 0N eql : 10S − 0N eql : 10S − 0N eql : 10S − 0N eql : 10S − 0N eql : 10S − 0N J A S O N D J F M A M J eql : 0N − 10N eql : 0N − 10N eql : 0N − 10N eql : 0N − 10N eql : 0N − 10N eql : 0N − 10N eql : 0N − 10N Odin/SMR: HNO3_5446 − Tpot 960K
− Southern Hemisphere − − Northern Hemisphere −
SH:
NH: 2001 2001−20022002 2002−20032003 2003−20042004 2004−20052005 2005−20062006 2006−20072007 2007−2008
Fig. 5.Same as Fig.4, but for the 960 K level in the middle stratosphere.
ACPD
8, 9569–9590, 2008 Stratospheric HNO3 climatology J. Urban et al. Title Page Abstract Introduction Conclusions References Tables Figures ◭ ◮ ◭ ◮ Back Close Full Screen / EscPrinter-friendly Version Interactive Discussion 0 5 10 15 eql : 90S − 70S [ppbv] eql : 90S − 70S eql : 90S − 70Seql : 90S − 70S eql : 90S − 70S eql : 90S − 70S
eql : 90S − 70Seql : 90S − 70S eql : 70N − 90Neql : 70N − 90Neql : 70N − 90Neql : 70N − 90Neql : 70N − 90Neql : 70N − 90Neql : 70N − 90N
− Southern Hemisphere − − Northern Hemisphere −
0 5 10 15 eql : 90S − 70S [ppbv] eql : 90S − 70S eql : 90S − 70Seql : 90S − 70S eql : 90S − 70S eql : 90S − 70S
eql : 90S − 70Seql : 90S − 70S eql : 70N − 90Neql : 70N − 90Neql : 70N − 90Neql : 70N − 90Neql : 70N − 90Neql : 70N − 90Neql : 70N − 90N
0 5 10 15 eql : 90S − 70S [ppbv] eql : 90S − 70S eql : 90S − 70Seql : 90S − 70S eql : 90S − 70S eql : 90S − 70S
eql : 90S − 70Seql : 90S − 70S eql : 70N − 90Neql : 70N − 90Neql : 70N − 90Neql : 70N − 90Neql : 70N − 90Neql : 70N − 90Neql : 70N − 90N
0 5 10 15 eql : 90S − 70S [ppbv] eql : 90S − 70S eql : 90S − 70Seql : 90S − 70S eql : 90S − 70S eql : 90S − 70S
eql : 90S − 70Seql : 90S − 70S eql : 70N − 90Neql : 70N − 90Neql : 70N − 90Neql : 70N − 90Neql : 70N − 90Neql : 70N − 90Neql : 70N − 90N
0 5 10 15 eql : 90S − 70S [ppbv] eql : 90S − 70S eql : 90S − 70Seql : 90S − 70S eql : 90S − 70S eql : 90S − 70S
eql : 90S − 70Seql : 90S − 70S eql : 70N − 90Neql : 70N − 90Neql : 70N − 90Neql : 70N − 90Neql : 70N − 90Neql : 70N − 90Neql : 70N − 90N
0 5 10 15 eql : 90S − 70S [ppbv] eql : 90S − 70S eql : 90S − 70Seql : 90S − 70S eql : 90S − 70S eql : 90S − 70S
eql : 90S − 70Seql : 90S − 70S eql : 70N − 90Neql : 70N − 90Neql : 70N − 90Neql : 70N − 90Neql : 70N − 90Neql : 70N − 90Neql : 70N − 90N
0 5 10 15 eql : 90S − 70S [ppbv] eql : 90S − 70S eql : 90S − 70Seql : 90S − 70S eql : 90S − 70S eql : 90S − 70S
eql : 90S − 70Seql : 90S − 70S eql : 70N − 90Neql : 70N − 90Neql : 70N − 90Neql : 70N − 90Neql : 70N − 90Neql : 70N − 90Neql : 70N − 90N
0 5 10 15 eql : 90S − 70S [ppbv] eql : 90S − 70S eql : 90S − 70Seql : 90S − 70S eql : 90S − 70S eql : 90S − 70S
eql : 90S − 70Seql : 90S − 70S eql : 70N − 90Neql : 70N − 90Neql : 70N − 90Neql : 70N − 90Neql : 70N − 90Neql : 70N − 90Neql : 70N − 90N
0 5 10 15 eql : 90S − 70S [ppbv] eql : 90S − 70S eql : 90S − 70Seql : 90S − 70S eql : 90S − 70S eql : 90S − 70S
eql : 90S − 70Seql : 90S − 70S eql : 70N − 90Neql : 70N − 90Neql : 70N − 90Neql : 70N − 90Neql : 70N − 90Neql : 70N − 90Neql : 70N − 90N
0 5 10 15 eql : 90S − 70S [ppbv] eql : 90S − 70S eql : 90S − 70Seql : 90S − 70S eql : 90S − 70S eql : 90S − 70S
eql : 90S − 70Seql : 90S − 70S eql : 70N − 90Neql : 70N − 90Neql : 70N − 90Neql : 70N − 90Neql : 70N − 90Neql : 70N − 90Neql : 70N − 90N
0 5 10 15 eql : 90S − 70S [ppbv] eql : 90S − 70S eql : 90S − 70Seql : 90S − 70S eql : 90S − 70S eql : 90S − 70S
eql : 90S − 70Seql : 90S − 70S eql : 70N − 90Neql : 70N − 90Neql : 70N − 90Neql : 70N − 90Neql : 70N − 90Neql : 70N − 90Neql : 70N − 90N
J F M A M J J A S O N D J A S O N D J F M A M J SH: NH: 2001 2001−20022002 2002−20032003 2003−20042004 2004−20052005 2005−20062006 2006−20072007 2007−2008 1600 K 1400 K 1200 K 960 K 840 K 740 K 655 K 585 K 520 K 465 K 420 K
Fig. 6.As Fig.4, but for various levels in the 420–1600 K range at high equivalent latitudes (70– 90◦). Whilst UARS/MLS data
are available up to 960 K only, Odin/SMR covers higher levels but provides only limited infor-mation below ∼500 K.