HAL Id: hal-02563051
https://hal.archives-ouvertes.fr/hal-02563051
Submitted on 14 Jan 2021
HAL is a multi-disciplinary open access
archive for the deposit and dissemination of sci-entific research documents, whether they are pub-lished or not. The documents may come from teaching and research institutions in France or
L’archive ouverte pluridisciplinaire HAL, est destinée au dépôt et à la diffusion de documents scientifiques de niveau recherche, publiés ou non, émanant des établissements d’enseignement et de recherche français ou étrangers, des laboratoires
Monte Carlo Aggregation Code (MCAC) Part 2:
Application to soot agglomeration, highlighting the
importance of primary particles
J. Morán, J. Yon, A. Poux, F. Corbin, F.-X. Ouf, A. Siméon
To cite this version:
J. Morán, J. Yon, A. Poux, F. Corbin, F.-X. Ouf, et al.. Monte Carlo Aggregation Code (MCAC) Part 2: Application to soot agglomeration, highlighting the importance of primary particles. Journal of Colloid and Interface Science, Elsevier, 2020, 575, pp.274-285. �10.1016/j.jcis.2020.04.085�. �hal-02563051�
Monte Carlo Aggregation Code (MCAC) Part 2:
Application to soot agglomération, highlighting the
importance of primary particles
J. Morana, J. Yona’*, A. Pouxa, F. Corbina, F.-X. Oufb, A. Siméonc aNormandie Université, INSA Rouen, UNIROUEN, CNRS, CORIA, 76000, Rouen,
France.
bInstitut de Radioprotection et de Sûreté Nucléaire (IRSN), PSN-RES, SCA, Gif-Sur-Yvette, 91192, France.
c Université de Lille, CNRS, UMR 8518 -LOA -Laboratoire d’Optique Atmosphérique, 59000 Lille, France.
Abstract
During the agglomération of nanoparticles, notably soot, a change in both the flow régime (from free molecular to near continuum) as well as the change of agglomeration regime (from ballistic to diffusive) is expected. However, these effects are rarely taken into account in numerical simulations of particles agglomeration and yet, they are suspected to have an important impact on the agglomeration kinetics, particle morphologies and size distributions. This work intends to study these properties by using the MCAC presented in the preceding work (part 1) by focusing on the physical impact of varying the particle volume fraction and monomers size and polydispersity. The results show an important sensitivity of the kinetics of agglomeration, coagulation homogeneity and agglomerates morphology to the size of monomers. First, for smaller monomers diameters the agglomeration kinetic is enhanced and agglomerates are found to be more compact, characterized by larger fractal dimensions. Secondly, for large monomer diameters, fractal dimensions down to 1.67 can be found being therefore, smaller than the classical 1.78 for DLCA mechanism. One important conclusion is that variation in time of both the agglomeration and flow regimes has to be considered for a more accurate simulation of the agglomerates size distribution and morphology.
*Corresponding author.
Keywords: Diffusive and Ballistic Agglomération; Primary particles; Flow
1. Introduction
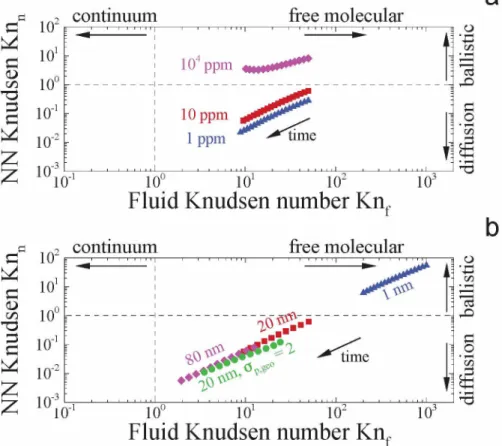
The agglomération of suspended nanoparticles is a phenomenon of great complexity but, also great common interest in both aerosol and colloid Sys tems. In this process of agglomeration, particles naturally evolve into com- plex fractal-like morphology of polydisperse size consisting also of polydis- perse primary particles. Eventually, depending on the physical conditions, particles may change the way they interact between each others and also the way they interact with the surrounding fluid. In other words, parti cles may undergo a change of flow regime and/or agglomeration regime, re- spectively. The flow regime is characterized by the classical fluid Knudsen number Knf = Xf /rm, where Xf and rm are the fluid mean free path and the particles mobility radius, respectively. When Knf tends toward 0, the relevent hydro/aerodynamic forces result from a continuous process (contin uum regime) whereas, at large Knf it is related to discret collisions with molecules (free molecular regime). As introduced by Pierce et al. [1], the ag glomeration regime can be quantified by the nearest-neighbor Knudsen num- ber Knn = Xp/rn, where Xp is the particle persistent distance and rn is the average nearest-neighbor distance. When Knn is high, the clusters agglomer ation tends to become ballistically limited (i.e. BLCA) whereas when tending toward 0, it is diffusion limited (i.e. DLCA). Fig. 1 summarizes most of the
continuum free molecular (Stokes drag) (Epstein drag)
Fluid Knudsen number Knf
Figure 1: Different régimes of agglomeration and fluid flow studied in the literature. The nearest-neighbor Knudsen number is Knn = Xp/rn, where \p = 18Dt is the particle persistent distance [2] and rn is the nearest-neighbor distance. The fluid Knudsen number is Knf = Xf /rm, where Xf and rm are the fluid mean free path and the particles mobility radius, respectively.
current simulations found in the literature as classified based on the above mentioned Knudsen numbers. Agglomeration has been commonly studied in the continuum flow regime for diffusion limited agglomeration (DLCA + Stokes drag) [3, 4]. Pierce et al. [1] studied the DLCA with an Epstein drag. Transition in the flow regimes (abscissa in Fig. 1) are complex due to the lack of models to calculate the friction coefficient of fractal agglomerates. In this context, some studies have treated both continuum and free molecular flow regimes separately [5]. Similarily, the ballistic limited (BLCA) and diffusion limited agglomeration (DLCA) are generally treated separately [3]. Only a few remarkable works considered a transition between both agglomeration regimes (vertical axis in Fig. 1) but, commonly in the free molecular flow regime, i.e. with an Epstein drag [6, 7].
To the author’s knowledge, simultaneous transitions between both ag- glomeration and flow regimes have not been considered in the past except the remarkable attempt of Thajudeen et al. [8]. This work is based on Langevin Dynamics simulations by considering the agglomerate morphology, which is very accurate but computationally expensive. Also, in this study the influ ence of the nearest-neighbor distance was not systematically studied. In fact, they quantified the change of agglomeration regime (ballistic-diffusive) based on a diffusive Knudsen number to be discussed later. The Monte Carlo Ag- gregation Code, i.e. MCAC, developped and validated in the previous work (Part 1 [2]) enables to cover this gap with a reduced computational cost.
The present work aims to illustrate that caution has to be taken re- garding the change in both regimes, because they impact the kinetics of agglomeration, size distribution and agglomerates morphology. On the one hand, when increasing the particles volume fraction (fv) the rn decreases and therefore Knn increases thus, the agglomeration becomes more ballistic and therefore an increase in the fractal dimension of agglomerates has been ob- served [9]. This is consistent with classical DLCA and BLCA regimes [3] but, in the present study, the transition between both regimes is continuous. On the other hand, when the primary particles diameter increases (for example during surface growth process), the flow regime evolves. In the context of soot simulation, agglomeration process is often restricted to the Epstein flow regime because of the large flame temperatures. Nevertheless, from nascent soot typically around 2-3 nm at flame temperatures to the mature primary particles around 30-40 nm eventually released to the atmosphere, the flow regime strongly evolves [10].
evolu-tion of the coagulaevolu-tion kernels during the aggloméraevolu-tion process. Indeed, the Smoluchowski equation has been proved to be a powerful tool for modeling soot aggregation [11]. This equation follows the evolution of the particle num- ber concentration as a function of time. To this end, k(i,j) has to be known, 1. e. the coagulation kernels determining the rate of collisions between parti- cles i and j. In certain cases, especially for fractal agglomerates, this kernel is a homogeneous function, i.e. k(ai, aj) = axk(i,j) where A is the agglomera- tion kernel homogeneity parameter. This A parameter is very important for the kinetics of agglomeration and the resulting self-preserving particles size distribution [12]. It has been proposed A to be dependent on both the fluid Knudsen number and the nearest-neighbor Knudsen number [1, 6], however, these relations are not well understood especially in the transition regime. Considering its simplicity, the scaling hypothesis is widely used to obtain A [3, 13, 14, 15] however, its accuracy is rarely discussed [16]. In the present work, a robust and more direct method for determining A is proposed.
2. Numerical simulations
The algorithm used here has been introduced in the preceding work [2] and therefore, it is briefly described here. Agglomeration of initially monodis perse or polydisperse spherical primary particles is simulated by using a model inspired in the classical DLCA mechanism [3]. It starts with a total of N0 = 3200 randomly placed monomers in a cubic box, ending when the aver age number of monomers per agglomerate is 100 [17]. Particles are displaced by following the individual positions in time, periodic boundary conditions are applied to avoid artificial effects due to the interaction between particles and the containing box. At each time iteration, particles are displaced in- dividually in a random direction along the persistent distance Ap = \/Î8Dr (here D stands for the diffusion coefficient and t = m/f is the momentum
relaxation time, i.e. the ratio between the particle mass and friction coeffi cient). The corresponding physical time step is At = 3t. As discussed in [2],
this time step ensures an accurate modeling of agglomeration by Monte Carlo simulations. If the displaced particle collides with a neighbor one, they irre- versibly stick together otherwise, a new particle is randomly selected in an iterative fashion. The probabilities pi for selecting and displacing a particle
i are based on the individual time steps Atj of all the particles based on the
relation pi = At-1 ^2 ■ At-1. This ensures the whole population of particles evolving with a statistically equivalent residence time [2]. Both, the
proba-bilities of particles displacements and the persistent distances of individual particles depend on the friction coefficient. In order to take into account the possible change in flow regime due to agglomeration, the method proposed by Yon et al. [18] is used, consisting in a power law between the agglomerate fric tion coefficient and the number of constituting primary particles. This model gives a physical importance to the primary particle diameter and the number of monomers in the evaluation of the friction coefficient. Also, this model enables the determination of a mobility radius rm of the agglomerates by
considering their size, morphology and change in flow regime. Finally, when the initial number of monomers N0 decreases by a factor of 8 then, each side of the box is duplicated and the number of agglomerates is increased 8 times by introducing periodic images of the existing ones [19].
In the present study, a constant primary particle bulk density pp =
1.8 g/cm3 is considered, corresponding to soot particles with low organic content [20]. Three different monomers diameters are simulated, i.e. 1, 20 and 80 nm. Unless indicated, they all consist of monodisperse monomers
{&geo,p = 1). For the case of polydisperse monomers a lognormal distribution
is considered (ogeo,v = 2). They are suspended in air at the temperature of
1700 K and the pressure of 101.3 kPa, corresponding to flame conditions [21]. Three different volumes fractions are simulated, i.e. 1, 10 and 104 ppm. All the results are averaged over 10 different simulations and error bars reported in figures correspond to the 95% of confidence intervals.
3. Results and discussion
3.1. Agglomeration and fluid flow régimes
First, recalling that one of the main advantages of MCAC is to consider the time evolving agglomeration regime (nearest-neighbor Knudsen num ber Knn) and time evolving fluid flow regime (fluid Knudsen number Knf).
Knn = Xp/rn corresponds to the ratio between the average persistent dis
tance and the average nearest-neighbor distance rn [1]. It is calculated as
rn = n-1/3 — 2rmax where n is the particle number concentration and rmax is
the average maximum radius describing the agglomerate. The Knnrepresents
the regime of agglomeration, i.e. diffusive or ballistic [1] indicated in the ver tical axis of Fig. 2. Knf = Xf /rm is evaluated as the ratio between the fluid
mean free path and the average particle mobility radius corresponding to the horizontal axis in Fig. 2. Initially, particles consist of isolated primary parti cles (top right position for each individual case). The initial primary particle
a
a 2 continuum free molecular
- 104ppm «a****** :
r 10ppm 1
1 ppm ,
10"3
1U10'1 100 1 01 102 1 03
Fluid Knudsen number Knf
b
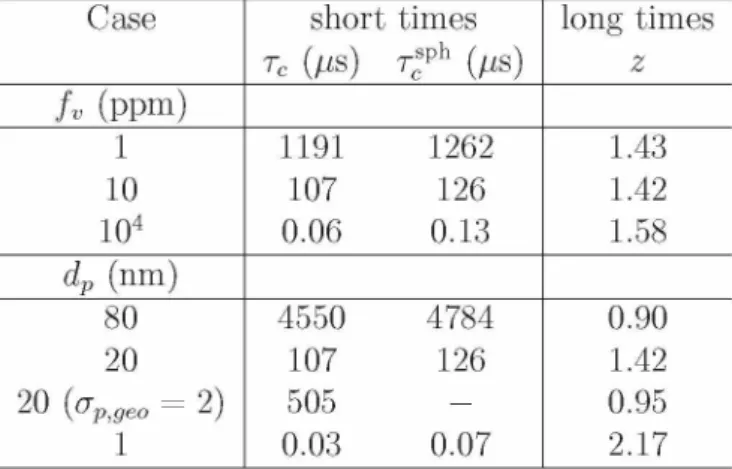
Figure 2: Different régimes of agglomération and fluid flow for (a) different particles vol ume fraction and (b) different monomers diameters. The nearest-neighbor (NN) Knudsen number is Knn = Xp/rn, where \p = 18Dr is the particle persistent distance [2] and rn is the average nearest-neighbor distance. The fluid Knudsen number is Knf = Xf /rm, where
Xf and rm are the fluid mean free path and the particles mobility radius, respectively.
diameter and fluid thermodynamic properties determine the horizontal po sition of this starting point whereas, volume fraction and primary particle diameter determine the initial vertical position. As time progresses and ag- glomerates are growing, both Knn and Kn/ are decreasing. Fig. 2 clearly illustrates the ability of MCAC to consider the evolution of both Knudsen numbers and thus the transition from ballistic to diffusive and from free molecular to near continuum regimes. By comparing Fig. 2(a) and (b), it is observed that an acceptable variation of the monomers diameters (dealing with soot particles) seems to have a stronger influence on both regimes than
a large variation of the volume fraction. Except for the largest partiales vol ume fraction, i.e. 104 ppm, the trends are generally related in a power law with a constant exponent. In the particular case of fv = 104 ppm, the system never reaches the diffusive regime since the nearest neighbor distance is in competition with the fast increase of agglomerates size. This is interpreted as a trend towards gelation process [14], being out of the scope of this work.
Figure 3: Inverse number concentration as a function of the normalized residence time. The Tc stands for the characteristic time of coagulation.
3.2. Kinetics of agglomération
Fig. 3(a-b) show the time evolution of the inverse number concentration n(t) consisting in the number of particles divided by the volume of the con- taining box. Due to agglomeration, 1/n(t) — 1/n(0) is increasing in time. At
short times, when particles are small enough to be treated as spheres, the behavior is linear as predicted by coalescing spheres theory [22] (represented by black dash-dotted lines, i.e 1/n(t) — 1/n(0) = (t/rc)z with z = 1). Also, Fig. 3(a-b) show a change of amplitude of the linear behavior at short times depending on fv and dp. This is related to a change of the characteristic time of coagulation tc. On the one hand, tc is calculated as the exponential of the
intercept from the log-log plot of 1/n(t) — 1/n(0) as a function of time for very short times (where z = 1). The calculated values are reported in Table 1 and compared with the theoretical ones (Tcsph). The latter is determined as
TSph = 2/(k0n0) where, n0 = n(0) is the initial number concentration and k0 is the coagulation kernel of coalescing spheres taking into account the change in flow regime [23], calculated based on initial monomers diameters. Both,
T®ph and tc are in the same order of magnitude except for the largest volume
fraction (i.e. 104 ppm or 1%). Indeed, for that case, k0 is no longer accurate to predict real coagulation efficiency and therefore the coagulation kernel is normally corrected by an enhancement factor not considered here [5, 24, 25]. The accordance of z ^ 1 and tc ~ Tcsph ensures a reliable simulation of the agglomeration kinetics by MCAC, at least for short times. For larger times
Table 1: Parameters for the analysis of agglomération kinetics (kinetics exponent z). Also,
the calculated and theoretical characteristics times of coagulation (for coalescing spheres), i.e. Tc and r®ph, respectively are indicated.
Case short times
Tc M TScP M long times z fv (ppm) 1 1191 1262 1.43 10 107 126 1.42 104 0.06 0.13 1.58 dp (nm) 80 4550 4784 0.90 20 107 126 1.42 20 (apgeo = 2) 505 — 0.95 1 0.03 0.07 2.17
corresponding to larger particles, due to the agglomerates morphology, the behavior tends to a power law 1/n(t) — 1/n(0) = (t/Tc)z, where z is the kinetic exponent that may be different of 1, and its value depends on the ag- glomeration and flow regimes [1, 5]. These values are displayed in Fig. 3(a-b)
and reported in Table 1. Kinetics of agglomération is enhanced (z increases) when increasing the volume fraction or decreasing the monomers diameters. The largest value is found for dp = 1 nm, which corresponds to a ballistic agglomeration (the largest Knn in Fig. 3(b)). This is in very good agreement with Pierce et al. [1] who reported an asymptotic value of z = 2.2 in this regime compared to 2.17 found in the present study. When decreasing Knn in Fig. 3, it corresponds to a general decrease of z, which appears to be more sensitive to the change of agglomeration regime.
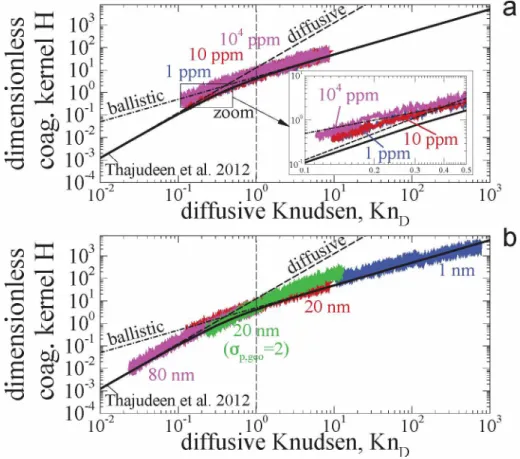
Figure 4: Dimensionless coagulation kernel H as a function of the diffusive Knudsen num- ber for (a) different particles volume fraction and (b) different monomers diameters. H are obtained from eq. (1) by numerical differentiation of kn = 2dn-1 /dt as a function of the diffusive Knudsen number compared with the results of Thajudeen et al. 2012 [26].
3.3. Coagulation kernels
As explained in the introduction, an important input parameter for Pop ulation Balance Equation in order to evaluate the evolution of the particles size distribution is the coagulation kernel ), i.e. the rate of collisions between particles consisting of i and j monomers). Fig. 4(a-b) report the dimensionless coagulation kernel H for monodisperse particles as formulated by Thajudeen et al. [26],
H kiiqmin Rs,ii
fiPA 2 (1)
where kii, mi and fi are the coagulation kernel, mass and friction coefficient respectively. The symbols in the figure correspond to the kii obtained from the present simulation based on the local slopes of Fig. 3(a-b) (kii = 2dn-1 /dt as proposed by Heine et al. [24]). Mass and friction coefficients are evaluated from the MCAC simulations. Also, RS)ii and PAii are the Smoluchowski radius and projected area, respectively, both are calculated based on the fractal dimensions reported later in this work (see Fig. 7) and the expressions proposed by [26]. All the above mentioned properties are evaluated based on population average values. In order to compare the current results (symbols) with the empirical relation proposed by [26] (continuous solid curves), the results are ploted as a function of the diffusive Knudsen number as introduced by the same authors and calculated as follows,
KnD (2mjkBT )1/2nRs,ü
fiPA ü (2)
where kB is the Boltzman constant. This Knudsen number has the same physical meaning than Knn used in the present study but, it is limited to a diluted system. As can be seen in Fig. 4(a-b) for all the simulated cases, a very good accordance is found between the present results and those by Thajudeen et al. [26] even if the considered range of primary particle diam- eters and volume fraction is huge. Nevertheless, a departure is observed for the high volume fraction case (104 ppm, Fig. 4(a)) explained by the devia- tion from the diluted assumption made by [26]. This illustrates that MCAC is able to reproduce reliable kernels from ballistic to diffusive regimes since Thajudeen et al. [26] obtained their results based on Langevin Dynamics simulations. But, MCAC is able to explore larger volume fractions and also
to take into account the primary particle polydispersity with a reduced com- putational cost. Also, contrarily to Thajudeen et al. [26], the agglomerate’s morphology is not imposed in MCAC simulations. It is interesting to note in Fig. 4(b) that monomers polydispersity tends to increase the dimensionless coagulation kernels, especially for larger KnD.
3-4- Self preserving size distributions
It has been suggested in the literature that agglomerates attain a self- preserving size distribution (SPSD) in both free molecular and continuum flow regimes [27, 7]. This means that, after a given time, the dimension- less representation of the density of particles having a certain number of primary particles converges toward an asymptotic form [28]. This can be shown when agglomerate size parameter is normalized by its average value. Under this condition, the coagulation kernel k(i,j) is a self-similar function, i.e. k(ai,aj) = axk(i,j) where A is the homogeneity coefficient and a is an arbitrary constant value [12]. Thus, A can be used to monitor the SPSD. Therefore, it is very interesting to study how this parameter is sensitive to a change in agglomeration or flow regimes. Usually, A is determined by fit- ting the SPSD [12, 1] or, as proposed by Dongen and Ernst [29], relying on the scaling hypothesis (A =1 — 1/z) based on the above mentioned kinetic exponent z. However, these approaches may be inaccurate and non robust. For these reasons, here an original and more robust method for determining A and thus the agglomerate size distribution is proposed. Indeed, it is found that self preserving limit corresponds to a generalized Gamma distribution (please refer to Appendix A),
f (x) {p/ad) vd_i X
xT(d/p) exp (3)
where f (x) is the probability density function. Here, x corresponds to one of the four size parameters considered in the present study as indicated in Table 2. In this equation, r(z) = J0° tz-1e-t dt is the Gamma function, p is a dimension parameter, a = (1 — A)-1/p, d = p(1 — A), and X = x/x is a dimensionless size where x = (xp)1/p. In addition to this generalized analyti- cal expression of the SPSD, an analytical expression of the g-moment of the generalized SPSD is provided in Appendix B. In Eq. (4), it is particularly reported the g-moment of the volume equivalent diameter dv = (6v/n)1/3
Table 2: Parameters for the generalized SPSD given by eq. (3). Size descriptor x p
number monomers Np 1
volume eq. diameter dv 3
gyration diameter dg Df a
mobility diameter dm Dfrnb
a Gyration diameter based or mass fractal dimension.
b Mobility diameter based fractal dimension (scaling exponent).
distribution,
dq = dq r(l ~ A + q/3)
dv dv (1 - A)q/3r(i - A) ’ (4)
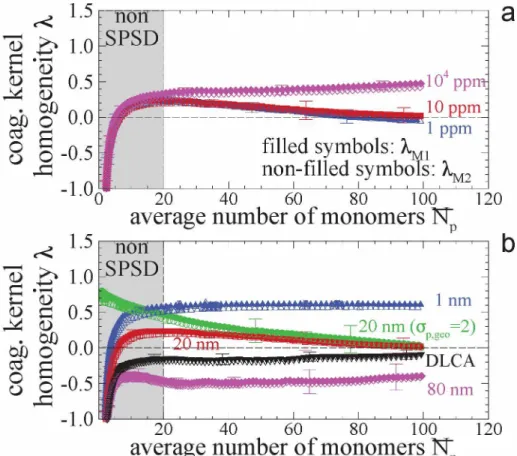
In the present work, it is proposed to evaluate the homogeneity coefficient A based on a new and robust method. It consists in solving Eq. (4), for the first (q = 1) and second (q = 2) moments of the volume equivalent diameters distribution, to obtain the corresponding homogeneity coefficients. They are denoted as Ami and AM2, respectively, and results are presented in Fig. 5 with respective filled and empty symbols. For initially monodisperse monomers and for times lower than the time-lag for SPSD (found to be in average 5rc or equivalent Np = 20, and represented by the gray zone in this figure), both, AMi and AM2 are very different showing that SPSD cannot be used to model the actual particle size distribution. However, for larger times (or larger Np) both parameters generally converge well toward a common value evolving in time suggesting that particles size distributions are quasi self-preserving all along the agglomeration process. The range of observed values of A for larger agglomerates is between -0.5 and 0.5, in the acceptable physical range discussed by Pierce et al. [1].
In order to evaluate the impact of the flow regime, the case of dp = 80 nm and fv = 10 ppm is again simulated, for which A = -0.5 (pink symbols) by forcing the drag force to stay in the Epstein regime all along the agglomeration process to serve as a reference “classical” DLCA-Epstein scheme (black symbols, labeled DLCA in the figure). Note that the reference DLCA case is much more stable in term of A than when the flow regimes is naturally evolving. Also, an asymptotic and different value is quickly reached. This highlights the importance of considering the natural evolution
of the flow regime. This is confirmed by the observed important role played by dp as shown in Fig. 5(b), which is a key parameter for evaluating the friction coefficient and its dependence on the fluid regime. In comparison, the role played by fv seems to have less relative impact.
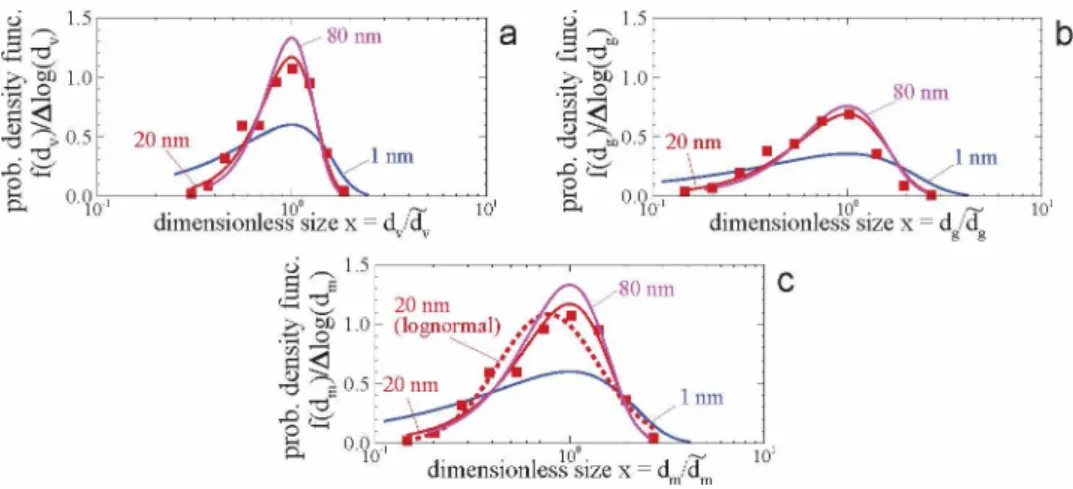
The case of initially polydisperse monomers is represented by green cir- cles symbols in Fig. 5(b). For short times both, ÀM1 and ÀM2 do not differ considerably. As discussed later and as proposed in the literature, the SPSD is not very different than a lognormal distribution [30, 31]. These parame- ters, attain the same value than the corresponding monodisperse case (with the same monomers geometric mean) but, the convergence is reached for larger agglomerate size (Np ~ 70). This is consistent with the results of Goudeli et al. [32] who showed by DEM simulations that agglomeration ker nels become independent on the initial monomers polydispersity for large enough residence times. It is also consistent with Friedlander [22] who found the attained SPSD, characterized here by À, to be independent on the ini tial particle size distribution. Because the SPSD is found to be relatively more influenced by the monomers diameters than particles volume fraction, Fig. 6(a-c) report the corresponding asymptotic SPSD obtained as a fonc tion of the dimensionless volume equivalent diameter, gyration and mobility diameters, respectively. To avoid overloading the figure, direct evaluation of the size distribution is reported in symbols only for the reference case (i.e.
dp = 20 nm) whereas, continuous curves correspond to the theoretical self-
preserving functions (Eq. 3) evaluated with the final ÀM1 found in Fig. 5, i.e. when Np = 100. First, a good agreement with the theoretical expres sion for the reference case is observed. This confirms the size distribution corresponds well to a SPSD. Secondly, the smaller the primary particle di- ameter, the wider becomes the distribution. This is also found with larger fv (not presented here) indicating that ballistic and free molecular flow regimes are characterized by wider agglomerate size distributions. This result is in agreement with coalescing spheres for all regimes [27] and with agglomer- ates in the asymptotic regimes [7]. It is worth to highlight the ability of MCAC to simulate the quasi-SPSD in the transition regime. Finally, it can be seen the ability of MCAC to simulate the quasi-SPSD as a function of different size parameters. Modal diameters and standard deviations seem more different for gyration diameters than mobility or volume equivalent di- ameters. However, the size distribution expressed in mobility diameter does not converge exactly towards a lognormal size distribution (dashed red line in Fig. 6(c)) as experimental measurements usually report. This discrepancy
average number of monomers
N-average number of monomers N"p
Figure 5: Coagulation kernel homogeneity coefficients for (a) different particles volume fraction and (b) different monomers diameters. Calculated from the first (Ami, filled symbols) and second (Am2, non-filled symbols) moments of the volume equivalent diameter
distributions.
may be related to some physical phenomena not considered in the présent Monte Carlo approach (for example, interaction potentials, surface growth or thermophoretic forces). Noting also that the simulated agglomerates are simplified in terms of morphology (one point contact spheres) compared to real soot particles as experimentally seen in TEM images [33, 34].
Figure 6: Asymptotic particles size distribution expressed in terms of (a) the volume équivalent diameter, (b) the diameter of gyration and (c) the mobility diameter.
3.5. Agglomérâtes morphology
The morphology of agglomérâtes is described by the population based fractal dimension Df and prefactor kf obtained based on the fractal law,
b = kft
v. dp
(5)
where va/vp is the ratio between the agglomerate volume and the average
monomers volume (corresponding to the number of primary particles Np), dg
is the diameter of gyration and dp is defined here as the numerical average
monomers diameter. Note that, there is no strict rule for using the fractal law when dealing with polydisperse primary particles [35, 36]. Defining dif- ferently the representative primary particle radius affects the so determined fractal prefactor but, not the fractal dimension. Also, the fractal law has been considered to be valid only for agglomerates large enough (typically
Np > 20). When ploting in log-log plot Np as a function of dg/dp, a linear fit
easily provides Df and kf. This procedure is repeated in the present study
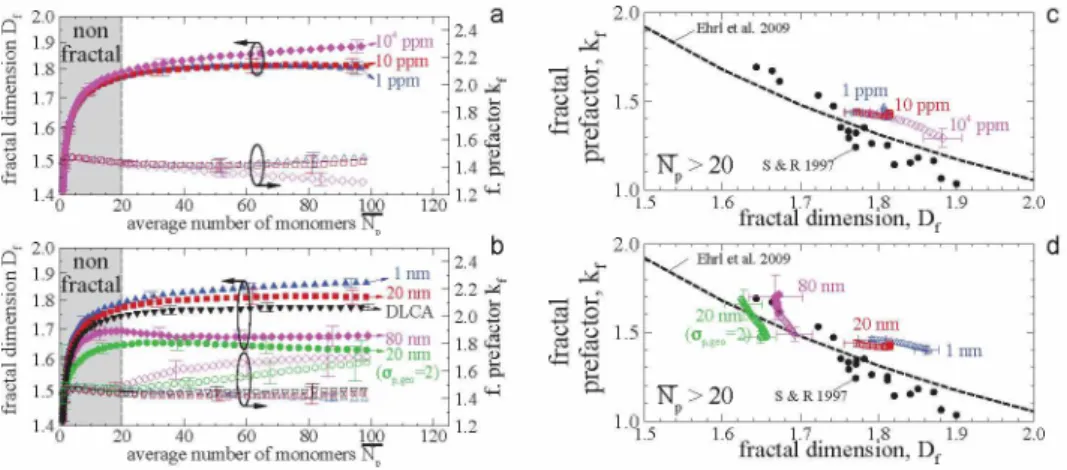
at each time iteration during the agglomeration process. The results are reported in Fig. 7(a-b) as a function of the mean number of primary parti cles per agglomerate. The filled symbols represent the fractal dimension (left vertical axis) whereas, empty symbols refer to the fractal prefactor (right ver tical axis). The practical use of the fractal law is limited to constant kf and
in agreement with the results obtained by Lazzari et al. [37]. Please note this limit is qualitative and values between 15 to 30 can be found in the litera- ture [38, 39]. In this context, smaller particles are considered as non-fractals. Note, this method for determining kf and Df does not enable to converge
to Df ^ 3 when Np ^ 1. Additionally, the current fractal dimension is
different from the average one reported in the literature [7, 40, 39], this is inherent to the fitting method and to the definition of the fractal law.
In Fig. 7(a), an increase in the asymptotic fractal dimension as a function of particles volume fraction is observed, this is in agreement with previous studies [41, 42, 9, 37]. This is because agglomeration becomes more ballistic. Nevertheless, for soot agglomeration processes, such high volume fractions may be not common. Furthermore, the observed variation of Df is not large
(between 1.80 and 1.88). Thus, it is unlikely that this parameter alone can explain the variability of the fractal dimensions found in the literature [33]. Fig. 7(b) shows the more influencing effect of the primary particles diameter
(Df between 1.62 to 1.86). First, it is very remarkable that this value de-
creases when increasing the monomer diameters. The present results seems to indicate that primary particle diameter, that plays an important role in the evaluation of the drag force (see Eq. (2) in the preceding work [2]) and therefore, due to the change in flow regime, has a significant impact on soot morphology. This dependence has been previously observed experimentally for agglomerates formed by DLCA mechanism however, not clear explanation has been given [43] before this work. Thus, small fractal dimension (down to 1.62) can result of the agglomeration of large monodisperse primary particles or containing at least a few large primary particles as seen in Fig. 7(a) for the polydisperse case opgeo = 2 reported in green. The observed impact of
polydispersity is in accordance with Eggersdorfer and Pratsinis [44] who re ported a fractal dimension of 1.68 when ap,geo = 2 for particles generated by a
DLCA mechanism in the free molecular flow regime (with an Epstein drag). As discussed before, the change in flow regime is evaluated by comparing the results with the reference DLCA-Epstein case (black inverted triangle symbols in Fig. 7(b)). In this case, an asymptotic fractal dimension of 1.77 is found. Therefore, taking into account the change in the flow regime may have a strong impact in the agglomerates morphology.
On the other hand, the evolution of kf as a function of Np can be inter-
preted as a morphological signature different than the fractal dimension [46]. Particles volume fraction does not strongly affect the prefactor meanwhile, primary particles diameter and polydispersity seems to have a stronger
ef-Figure 7: (a-b) Population based fractal dimension Df and prefactor kf as a function of the average number of monomers per agglomerate Np. (c-d) Fractal prefactor dependence
on the fractal dimension for Np > 20 compared with Ehrl et al. [38] and Sorensen & Roberts [45].
fect. Fig. 7(a-b) seems to indicate an opposite trend in the relative variation of Df and kf. This is shown in Fig. 7(c-d) and compared with the liter- ature [38, 45]. Only the parameters for Np > 20 are shown. The overall trend is that both parameters are inversely related, which is in accordance with the cited references. It is interesting to note that for both dp = 80 nm
(aP,geo = 1) and dp = 20 nm (op>geo = 2) the relative variation observed dur-
ing the agglomeration process show a very different Df compared with other simulated cases.
4. Conclusions
Monte Carlo Aggregation Code, MCAC, is used to simulate the agglom- eration of soot particles by taking into account the change of both, flow and agglomeration regimes during agglomeration process. Monitoring both the nearest-neighbor (Knn) and fluid Knudsen number (Knf ) is suggested to characterize the regimes of agglomeration and flow, respectively. This com- plements the suggestion of Thajudeen et al. [8] who proposed to monitor the diffusive Knudsen number instead of Knn.
On the one hand, when increasing the particles volume fraction, the ki- netics of agglomeration is enhanced, which is consistent with previous results in the literature [15, 14]. In this context, an increase in the coagulation ker
nel is also observed in accordance with previous studies [5, 24, 25]. Except in the case of fV = 104 ppm, the dimensionless coagulation kernel is found to be in very good agreement with Thajudeen et al. [26]. Particles are also found to be more compact with a maximum Df = 1.86 when fV = 104 ppm.
On the other hand, when increasing the primary particles diameter, ag- glomeration kinetics is slower, particles size distribution is considerably dif ferent but always quasi self-preserving. Fractal dimension is found to be decreasing with primary particles diameter dp. In particular, at flames con ditions (1700 K of temperature and 1 atm of pressure), for monodisperse large monomers of size dp = 80 nm, an asymptotic value of Df = 1.67 is found when both agglomeration and flow regimes simultaneously evolve. This is lower than the typical 1.78 for agglomerates generated by purely DLCA mechanism [3]. In fact, for the same condition a Df = 1.77 is attained when the agglomeration is simulated considering a classical DLCA-Epstein scheme, i.e. the drag force is imposed to be always in the Epstein regime.
The current numerical simulations suggest a decrease in the asymptotic fractal dimension as a function of the monomers diameters. This dependence has been suggested by reviewing experimental data by Wu et al. [43, 37], who highlighted the lack of explanation for this trend. Here, just considering the change of regime suffered by primary particles a possible explanation is proposed however, at this point, more complex phenomena (not considered here) such as, dipolar interactions, etc. cannot be discarded [37].
A new and robust method to determine the kernel homogeneity A is in- troduced and discussed. It is based on the first and second moments of the analytical self-preserving particle size distribution [1, 6, 12]. This distribution is found to be a generalized gamma distribution. The homogeneity coefficient is also found to be very sensitive to the primary particle diameter and less sensible to the volume fraction for the cases studied here. It is commonly an evolving value as agglomeration progresses however, when Np > 20 its variation is not very large suggesting a quasi SPSD.
MCAC has been implemented in c++, and it will be publicly available in the following link https://gitlab.coria-cfd.fr/MCAC/MCAC.
Acknowledgments
This work is financed by ANR ASTORIA (N° ANR-18-CE05-0015) and the Region of Normandy (project RIN Gaspropres).
Appendix A. The generalized self preserving size distribution Oh and Sorensen [12] introduced the following Self-preserving particles size distribution as expressed in terms of the volume of aggregates,
n(v) = M1sl)2^(x), x = v/sb (A.1)
where n(v)dv represents the number concentration of particles whose vol ume is between v and v + dv, and where sb = Mb/Mb-1, considering Mb as
the b-moment of the volume-based particles size distribution,
Mb = vbn(v)dv (A.2)
0
Additionally, ^(x) corresponds to the time-invariant shape of the SPSD,
4>(X) = AX-xexp [—(b — X)X], (A.3)
where A = (b — X)b x/T(b—X). Therefore, they finally arrived to the following expression by rewriting Eq. (A.1) considering b =1,
n(v) 1(1 — X)b X—
v r(1 — X) exp [—(1 — X)X], X = v/v (A.4)
This expression can be converted to a probability density function f (v) by calculating,
f (v)dv n(v)dv
r n(v)dv (A.5)
1 (1 _ \)1-A
f (v) = = r(1 — X) X-A exp[—(1 — X)X] ’ X = v/v (A.6)
For any equivalent diameter x related to the volume of the aggregate according to the following expression,
v = axp (A.7)
where a and p correspond to a prefactor and exponent, respectively. Now, considering the probability to find a particle with a volume between v and
v + dv is the same as the probability to find a particle with an équivalent
diameter between x and x + dx, i.e. f (v)dv = f (x)dx therefore,
f (x) = f (v)apxp-1, v = axp (A.8)
Based on Eq. (A.6) and introducing x = (xp)1/p,
f (x) =
X r
(l X-\) Xp{1-X)-1 exP [-(! - A)X ] ’ X = (x/x)p (A.9)Note that Eq. (A.9) is independent on the prefactor a. Finally, by intro ducing the following parameters a = (1 — X)-1/p and d = p(l — A) it is shown that Eq. (A.9) corresponds to a generalized Gamma distribution,
f (x) = (p/c
xT(d/p)Xd-1exp
^ p
a
X = (x/x)p (A.10)
Appendix B. q-moment of the generalized SPSD
The moment of order q of a distribution of a general probability density function f (x) is,
TO
x = xq f (x)dx, (B.l)
0
considering the f (x) given by Eq. (A.10) the following expression is obtained,
r
xq = xq
aq-r(d/p) ’
by replacing the previously defined parameters a and d, __ r(1 — A + p/q) xq — xq (i — A)«/pr(i — A) (B.2) (B.3) d
References
[1] F. Pierce, C. Sorensen, A. Chakrabarti, Computer simulation of diffusion-limited cluster-cluster aggregation with an epstein drag force, Physical Review E 74 (2) (2006) 021411. doi:https://doi.org/10.
1103/PhysRevE.74.021411.
[2] J. Moran, J. Yon, A. Poux, Monte carlo aggregation code (mcac) part 1: Fundamentals, Journal of Colloid and Interface Sciencedoi:https: //doi.org/10.1016/j.jcis.2020.02.039.
[3] P. Meakin, A historical introduction to computer models for fractal ag- gregates, Journal of Sol-Gel Science and Technology 15 (2) (1999) 97 117. doi:https://doi.org/10.1023/A:1008731904082.
[4] S. Lazzari, M. Lattuada, Growth and aggregation regulate clusters structural properties and gel time, The Journal of Physical Chemistry B 121 (11) (2017) 2511-2524. doi:https://doi.org/10.1021/acs. jpcb.6b12682.
[5] R. D. Mountain, G. W. Mulholland, H. Baum, Simulation of aerosol agglomeration in the free molecular and continuum flow regimes, Journal of Colloid and Interface Science 114 (1) (1986) 67-81. doi:https:// doi.org/10.1016/0021-9797(86)90241-9.
[6] W. R. Heinson, F. Pierce, C. M. Sorensen, A. Chakrabarti, Crossover from ballistic to epstein diffusion in the free-molecular regime, Aerosol Science and Technology 48 (7) (2014) 738-746. doi:https://doi.org/ 10.1080/02786826.2014.922677.
[7] E. Goudeli, M. L. Eggersdorfer, S. E. Pratsinis, Coagulation- agglomeration of fractal-like particles: Structure and self-preserving size distribution, Langmuir 31 (4) (2015) 1320-1327. doi:https: //doi.org/10.1021/la504296z.
[8] T. Thajudeen, S. Deshmukh, C. J. Hogan Jr, Langevin simulation of ag- gregate formation in the transition regime, Aerosol Science and Technol- ogy 49 (2) (2015) 115-125. doi:https://doi.org/10.1080/02786826. 2015.1008971.
[9] R. Zahaf, S.-K. Kim, J. Shin, K. Park, T.-Y. Choi, D. Lee, Effect of volume fraction on transient structural behavior of aerosol particles using off-lattice kinetic monte carlo simulation, Aerosol Science and Technology 49 (12) (2015) 1242-1255. doi:https://doi.org/10.1080/ 02786826.2015.1116681.
[10] M. L. Botero, N. Eaves, J. A. Dreyer, Y. Sheng, J. Akroyd, W. Yang, M. Kraft, Experimental and numerical study of the evolution of soot primary particles in a diffusion flame, Proceedings of the Combustion Institute 37 (2) (2019) 2047-2055. doi:https://doi.org/10.1016/j. proci.2018.06.185.
[11] A. Jerez, J.-L. Consalvi, A. Fuentes, F. Liu, R. Demarco, Soot produc tion modeling in a laminar coflow ethylene diffusion flame at different oxygen indices using a pah-based sectional model, Fuel 231 (2018) 404 416. doi:https://doi.org/10.1016/j.fuel.2018.05.103.
[12] C. Oh, C. Sorensen, Light scattering study of fractal cluster aggregation near the free molecular regime, Journal of Aerosol Science 28 (6) (1997) 937-957. doi:https://doi.org/10.1016/S0021-8502(96)00488-0.
[13] G. Wang, C. Sorensen, Aggregation kernel homogeneity for fractal ag- gregate aerosols in the slip regime, Aerosol Science & Technology 34 (3) (2001) 297-306. doi:https://doi.org/10.1080/02786820118313.
[14] P. Liu, W. R. Heinson, C. M. Sorensen, R. K. Chakrabarty, Kinet- ics of sol-to-gel transition in irreversible particulate systems, Jour nal of colloid and interface science 550 (2019) 57-63. doi:https: //doi.org/10.1016/j.jcis.2019.04.067.
[15] R. H. Ebini, C. M. Sorensen, Light scattering studies of the sol-to- gel transition in particulate systems, Journal of colloid and interface science 556 (2019) 577-583. doi:https://doi.org/10.1016/j.jcis. 2019.08.075.
[16] F. Leyvraz, Scaling theory and exactly solved models in the kinetics of irreversible aggregation, Physics Reports 383 (2-3) (2003) 95-212.