HAL Id: hal-02436346
https://hal.archives-ouvertes.fr/hal-02436346
Submitted on 13 Jan 2020
HAL is a multi-disciplinary open access
archive for the deposit and dissemination of
sci-entific research documents, whether they are
pub-lished or not. The documents may come from
teaching and research institutions in France or
abroad, or from public or private research centers.
L’archive ouverte pluridisciplinaire HAL, est
destinée au dépôt et à la diffusion de documents
scientifiques de niveau recherche, publiés ou non,
émanant des établissements d’enseignement et de
recherche français ou étrangers, des laboratoires
publics ou privés.
Nutrient budgets in the Saigon-Dongnai River basin:
Past to future inputs from the developing Ho Chi Minh
megacity (Vietnam)
Tuyet Nguyen, Julien Nemery, Nicolas Gratiot, Josette Garnier, Emilie
Strady, Dan Nguyen, Viet Tran, An Nguyen, Son Cao, Trang Huynh
To cite this version:
Tuyet Nguyen, Julien Nemery, Nicolas Gratiot, Josette Garnier, Emilie Strady, et al.. Nutrient budgets
in the Saigon-Dongnai River basin: Past to future inputs from the developing Ho Chi Minh megacity
(Vietnam). River Research and Applications, Wiley, 2020. �hal-02436346�
Nutrient budgets in the Saigon–Dongnai River basin: Past to
future inputs from the developing Ho Chi Minh megacity
(Vietnam)
Tuyet T.N. Nguyen
1,2| Julien Némery
1,2| Nicolas Gratiot
1,2| Josette Garnier
3|
Emilie Strady
2,5| Dan P. Nguyen
2| Viet Q. Tran
2| An T. Nguyen
1,2|
Son Tung Cao
4| Trang P.T. Huynh
41Université Grenoble Alpes, CNRS, IRD,
Grenoble INP*, IGE, Grenoble, F-38000, France
2CARE, Ho Chi Minh City University of
Technology, Vietnam
3Sorbonne Université, CNRS, EPHE, UMR
7619 Metis, BP 123, Tour 56-55, Etage 4, 4 Place Jussieu, 7500, Paris, France
4Center for Natural Resources and
Environmental Monitoring (CEM), Department of Natural Resources and Environment (DONRE), HCMC, Vietnam
5Aix-Marseille University, Mediterranean
Institute of Oceanography (MIO), Université de Toulon, CNRS/IRD, Marseille, France Correspondence
T. T.N. Nguyen, IGE, Université Grenoble Alpes, CNRS, IRD, Grenoble INP, Grenoble, France.
Email: ngoctuyet1412@gmail.com; tuyet. nguyen@univ-grenoble-alpes.fr
Funding information
EC2CO structurant initaitive, Grant/Award Number: Bioheffect; Region Auvergne Rhone Alpes, Grant/Award Number: CMIRA “Saigon River: la ville et fleuve”; CMIRA
Abstract
Ho Chi Minh City (HCMC, Vietnam) is one of the fastest growing megacities in the world. In this paper, we attempt to analyse the dynamics of nutrients, suspended sed-iments, and water discharges in its aquatic systems today and in the future. The work is based on nine sampling sites along the Saigon River and one on the Dongnai River to identify the reference water status upstream from the urban area and the increase in fluxes that occur within the city and its surroundings. For the first time, the calculated fluxes allow drawing up sediment and nutrient budgets at the basin scale and the quantification of total nutrient loading to the estuarine and coastal zones (2012–2016 period). Based on both national Vietnamese and supplementary monitoring programs, we estimated the water, total suspended sediment, and nutrients (Total N, Total P, and dissolved silica: DSi) fluxes at 137 m3year−1,
tonSS year−1, 5,323 tonN year−1, 450 tonP year−1, and
m3
year−1 for the Saigon River and 1,693 year−1,
3,292 2,734 1,175
× 103
tonSi
× 103 tonSS year−1, 31,030 tonN year−1, 1,653 tonP year−1, and
31,138 tonSi year−1for the Dongnai River, respectively. Nutrient fluxes provide an
indicator of coastal eutrophication potential (indicator of coastal eutrophication potential), using nutrient stoichiometry ratios. Despite an excess of nitrogen and phosphorus over silica, estuarine waters downstream of the megacity are not heavily impacted by HCMC. Finally, we analysed scenarios of future trends (2025–2050) for the nutrient inputs on the basis of expected population growth in HCMC and improvement of wastewater treatment capacity. We observed that without the con-struction of a large number of additional wastewater treatment plants, the eutrophi-cation problem is likely to worsen. The results are discussed in the context of the wastewater management policy.
KE Y WO R DS
budgets, nutrients, past and future scenarios, sediment, wastewater management
1 | INTRODUCTION
In the 21st century, the impact of human activities on ecosystems has become a major concern. The application of fertilizers in agriculture and the discharge of untreated domestic and industrial wastewaters into aquatic systems is increasing significantly (Seitzinger et al., 2010; Turner, Rabalais, Justic, & Dortch, 2003). As a direct consequence, human activities have deeply changed the cycle of nitrogen (N) and phosphorus (P) at the global scale (Meybeck, 1982; Seitzinger et al., 2010; Seitzinger, Harrison, Dumont, Beusen, & Bouwman, 2005; Van Drecht, Bouwman, Knoop, Beusen, & Meinardi, 2003), as well as at the regional scale, with alarming consequences in various large rivers such as the Yangtze River (Liu et al., 2016), the Mississippi River (Turner & Rabalais, 1994), the Mekong River (Li & Bush, 2015), and numerous European rivers (Ludwig, Bouwman, Dumont, & Lespinas, 2010; Ludwig, Dumont, Meybeck, &Heussner, 2009).
An excess of nutrients leads to serious impacts on aquatic ecosys-tems, including eutrophication with hypoxia and fish mortality (Conley et al., 2009; Smith, 1998). Algal blooms can also cause water quality problems such as unpleasant odors and an increase in pH and dis-solved organic carbon (Carpenter et al., 1998; Shen et al., 2003; Smith, 1998). In addition, some algal species such as Cyanobacteria can release harmful toxins that may affect livestock and human health (Duong, Le, et al., 2010; Duong, Vu, et al., 2010; Duong etal., 2013).
Numerous studies have reported that the main cause of eutrophi-cation in aquatic systems is due to the increase of nutrient concentra-tions in both dissolved and particulate forms as well as the changes in the nutrient stoichiometry, that is, their molar ratios (Conley et al., 2009; Langenberg, Nyamushahu, Roijackers, & Koelmans, 2003; Smith, 1998; Turner et al., 2003; Winter et al., 2002). Examining the concentrations, forms, and ratios simultaneously is now recognized as a useful tool to predict the community component of undesirable algae production, both globally and regionally (Turner et al., 1998, 2003).
According to this view, an indicator of coastal eutrophication potential (ICEP) was proposed by Billen and Garnier (2007). This indi-cator is based on a riverine N, P, and Si inputs and can be used to determine the possible production of non-siliceous algae. Although the N:P ratio is used to identify the limiting factor, the ICEP gives information on N or P excess in regard to Si in terms of diatom growth (Conley, Kilham, & Theriot, 1989; Redfield, Ketchum, & Richards, 1963).
Vietnam, like many developing countries in the Southeast Asia, is experiencing rapid economic and demographic development, especially in urban areas, leading to water quality degradation. The nutrient sources and pathways are numerous and difficult to deter-mine when attempting to establish global budgets. Several studies in Vietnam have examined nutrient budgets in reservoir catchments (Le et al., 2014) or large catchments and deltas such as the Red River basin (Le et al., 2005; Luu et al., 2012). However, to date, nutrient budgets including emissions in urban areas are often incomplete and therefore do not satisfy recommendation for nutrients management. The main objective of this study was to collect data from a wide
variety of information sources (official statistical data, field data from a national monitoring program, complementary field data from our research group, and statistical questionnaires) in order to draw the most complete nutrient budgets possible in a densely populated urban area (including domestic and industrial treated and untreated waste-waters, atmospheric deposition, and river fluxes). To meet this objec-tive, we focus on the Ho Chi Minh City (HCMC) in the South of Vietnam.
H C M C is the largest city in Vietnam and one of the most dynamic in the world (World Economic Forum News, January 2017). Because of urban sprawl and the lack of wastewaters treatments, the quality of the water is deteriorating, which endangers the resource as well as the human activities that depend on it (Babut et al., 2019; Nguyen et al., 2019; Nguyen, Le, Bui, Phan, & Visvanathan, 2011; Strady et al., 2017).
To better understand the current nutrient inputs and their impacts on aquatic systems, we used a database provided by the Cen-ter of Environment Monitoring (CEM) of the Department of Natural Resources and Environment (DONRE) and compared it with data col-lected by our group from July 2015 to December 2017. In this paper, we attempt to (a) establish the annual budget of water, total suspended sediments (TSSs) and nutrients in the river system; (b) characterize the contribution of local sources (domestic discharge, industries, and atmospheric deposition) and upstream sources to the overall nutrient budget; (c) assess possible shift of nutrient stoichio-metric ratios to the downstream zone; and finally (d) explore the development of the region in 2025 and 2050 for realistic population growth and urban policy scenarios, with the establishment of new wastewater treatment plants (WWTPs).
2 | MATERIAL AND METHODS
2.1
| Description of the Saigon–Dongnai River
basin
The Saigon–Dongnai River basin is located in Southeast Asia, covering an area of 31,216 km2(Figure 1b). The Dongnai River (basin area of
26,449 km2) takes its source from Central Vietnam, more specifically
the Southwest Plateau, and flows southward through the Tri An reservoir (Figure 1c). This reservoir was built in 1986 for hydroelectric production and water supply for domestic, industrial, and agricultural uses in the downstream provinces (an area of 323 km2, 2,700 million
m3; Dao, Nimptsch, & Wiegand, 2016). In this basin, the Saigon River
(basin area of 4,717 km2) originates from Phum Daung in
Southeastern Cambodia and flows through to the Dau Tieng Reservoir (120–270 km2; 470–1,680 million m3). Land use in the
Saigon River basin is dominated by agricultural activities in the north (paddy rice and rubber tree farms), urban settlements in the centre of HCMC and Can Gio Mangrove forest to the south (data from Ho Chi Minh City Statistical Yearbook, 2016). The river crosses HCMC and connects with urban canals. It then confluences with the Dongnai River to form the Nha Be River, and then, it separates into two
branches (Soai Rap River and Long Tau River) that pass through the Can Gio Mangrove and reach the South China Sea, 20 km north of the Mekong Delta (Figure 1b). Regulation of Dau Tieng reservoir's water discharges aims at preventing the intrusion of saline water into the Saigon Water Supply Company's Hoa Phu Raw Pumping Station (or Hoa Phu Water Intake) and mitigating surface flood risks (Figure 1c). The Saigon River is highly influenced by coastal waters, in response to the tidal forcing that leads to the asymmetric flow current inversion twice a day. The basin is subjected to two distinct seasons: The rainy season usually begins in May and ends in November, whereas the dry season usually lasts from December to April.
Land use is very diverse from the north to the south of HCMC: Agricultural activities in the northwest and east (e.g., paddy rice and vegetables) and industrial parks dominate in the north, whereas the heart, the east, and the south of the inner city are dominated by urban settlement. The Can Gio Mangrove forest, which is located southeast of the city centre, has been recognized as a biosphere reserve by the United Nations Educational, Scientific and CulturalOrganization.
The population in HCMC was 8.4 million inhabitants in 2016, making it the most densely populated city in Vietnam (Ho Chi Minh City Statistical Yearbook, 2016). The population density varied from 2,000 inhabitants per square kilometre in rural districts up to 50,000 inhabitants per square kilometre in urban districts (Figure 1). In recent years, less than 10% of domestic wastewater was collected and treated before release to urban canals and rivers (Nguyen et al., 2019).
2.2
| Database from the Vietnamese water
monitoring survey
The Vietnamese monitoring program carries out monthly water discharge and bimonthly water quality parameter measurements at all locations within the Saigon–Dongnai River basin and urban canal network (Figure 1c). Since 2005, the CEM has been in charge of the bimonthly monitoring of the water quality at 26 sites in the Saigon and Dongnai Rivers and 16 sites in urban canals. Figure 1b,c presents the selection of sites used for this study. The CEM is also in charge of measuring the monthly river discharges at 15 sites along the Saigon and the Dongnai Rivers. Because of the asymmetric semidiurnal tides, the estimation of the residual river discharges requires hourly measurement of discharge over a minimum period of 24 hr (two tidal cycles). The mean water discharge is then deduced from the integra-tive flux between the tide inflow and outflow (Nguyen et al., 2019). The residual discharge corresponds to the net positive flow of the river from land to sea. Even with the low frequency measurement of the discharge (i.e., once per month), the hydrological seasonality is clearly observed (Nguyen et al., 2019). For water quality analysis, sur-face (20–30 cm deep) riverine and urban canal waters were collected manually during low and high tides, 4 m from the riverbank, and were filtered on preweighted filters. Temperature, pH, DO, TSS, salinity,
+ 3 −
turbidity, ammonium (NH4 ), and phosphates (PO4 ) were measured
according to the Vietnamese water quality standard (QCVN08, 2015). From this database, (a) 10 sites were selected along the Saigon River, FIG U RE 1 (a) Location of the Saigon–Dongnai River basin, (b) regional map of the Sai Saigon–Dongnai River basin and sampling sites, and (c) population distribution in Ho Chi Minh City and location of the sampling sites. Abbreviation: WWTP, wastewater treatment plant
the Thi Tinh River (a confluent), and the Dongnai River and six sites in urban canals and (b) the 2012–2016 period was selected based on the availability and reliability of data, thus providing a complete and
suit-4
able set comprising water discharge, TSS, NH4+, and PO3−.
2.3
| Supplementary monitoring program
To determine the N, P, and Si fluxes, a bimonthly monitoring program was carrying out in 2015–2017 at four sampling sites along the Saigon and Dongnai Rivers to analyse additional parameters: Total N, nitrate (NO3−), Total P, and dissolved silica (DSi). As fully described in
Nguyen et al. (2019), surface water was sampled with a Niskin bottle in the middle of the river, either from a bridge or a boat and stored in a cooler at 4○C before it was analysed in the laboratory. Surface water
samples were considered integrative of the whole vertical section, as previously observed by Nguyen etal. (2019).
All samples were filtered through Whatman GF/F filters (porosity 0.7 μm) to analyse dissolved nutrients. Dissolved nutrients were analysed usingstandard colorimetric methods (American Public Health
−
Association: APHA, 1995). NO3and DSi were analysed using the
cadmium reduction method and the silicomolybdate method, respec-tively. Unfiltered waters were used to measure Total N and Total P using the persulfate digestion process and the standard colorimetric method (APHA, 1995). Reproducibility for replicate measurements was better than 5 % for all total and dissolved nutrients.
2.4
| Suspended sediment and global nutrient
budget calculation
TSS and nutrient budgets included nutrient export by rivers and tribu-taries, industrial inputs, domestic inputs, and atmospheric depositions. We calculated fluxes of TSS, Total N, dissolved inorganic nitrogen (DINincluding N O3−and NH4+), Total P, dissolved inorganic
phospho-3 −
rus (DIP, i.e.,PO4)and dissolved silica(DSi).
2.4.1
| Nutrient export by rivers
We used nutrient and discharge data provided by CEM. We chose six monitoring sites (see Figure 1), four of which (Ben Suc, Phu Cuong, Binh Phuoc, and Phu An) are on the main course of the Saigon River. One sampling site (Hoa An) is used as the reference for Dongnai River inputs and the sixth site (Thi Tinh) is used as an indicator of input from river tributaries with agricultural and indus-trial activities. We built a dataset of mean discharge, TSS, and nutrient concentrations to calculate fluxes (Table A1). Due to miss-ing data, we considered the mean concentrations from our supple-mentary monitoring in 2015–2017 to calculate the net flux and specific flux for 2012–2014. Based on the method proposed by Walling and Webb (1985), we calculated the net fluxes and specific fluxes as follows:
Fluxannual
Xn i= 1
= Fluxmonthly, withFluxmonthly
106 = Cmonthly× Qmonthly × a × 24 × 3,600, ð1Þ Fluxspec A = Fluxmonthly , where
• Fluxannual is the annual flux of TSS, Total N, NO3−, NH4 , Total P,+
3 − − 1
PO4 , and DSi (ton year );
• Fluxmonthly is the monthly flux of TSS, Total N, NO3−, NH4 , +
3 − − 1
Total P, PO4 , and DSi (ton month );
• Cmonthly is the mean monthly concentrations (mgL−1);
• Qmonthly is the mean monthly discharge for the period recorded
(m3s−1);
• a is the number of day per month (a = 28–31), and n is the number of months (n = 12);
• Fluxspecis the specific flux of TSS, Total N, NO3−, NH4+,Total P,
3 − − 2 − 1
PO4 , and DSi (ton km month );
• A is the surface area of the river basin (4,717 km2 for the Saigon
River and 26,449 km2 for the DongnaiRiver).
2.4.2
| Domestic inputs
To estimate urban inputs, we assumed that untreated and treated domestic wastewaters from household and WWTPs were two main sources of TSS and nutrients. In HCMC, until recent years (before 2018), only 10% of the population had a direct connection to WWTPs, whereas 92% of the population released untreated waste-waters directly to urban canals through the sewer network (Marcotullio, 2007; Nguyen et al.,2019).
Gross nutrient inputs from urban areas
To account for Total N and Total P fluxes from untreated urban wastewater, we assumed that the per capita human N emission ranged from 10 to 12 gN capita−1 day−1 and from 0.8 to
4.0 gP capita−1 day−1 for P emissions (Triet, Hung, & Dan, 2008). We
considered the mean values for further calculation (i.e., 11 gN capita−1day−1and 2.4 gP capita−1day−1). These values are in good
agreement with the values proposed by Sung (1995) for Vietnamese (10.08 gN capita−1day−1for N and 1.7 gP capita−1day−1 for P) and
Meybeck, Chapman, and Helmer (1989) at a global scale (9.04 gN capita−1day−1for N and 1.1 gP capita−1day−1for P). The per capita
values in this study come from Vietnamese sources but in the literature, there were other close or lower values (e.g., 1.5–1.7 gP capita−1day−1, Naden et al., 2016). The difference in P per capita is
due to the use of polyphosphates in washing powders that can differ from one country to another. Gross nutrient inputs were calculated using the per capita human nutrient emissions and the population of H C M C that is not connected to WWTPs Equation (2).
Flux.tonyear−1Σ=E × Inhab × 365
100,000 , ð2Þ
where
• Flux is the annual flux of Total N and Total P (tons year−1);
• E is Total N and Total P in pollutant emissions (g capita−1day−1);
• Inhab is the total population of H C M C that is not connected to WWTPs (capita).
Net nutrient inputs from WWTPs
HCMC has only two WWTPs. Their treatment capacities are 141,000 m3 day−1 (426,000 inhabitants) for Binh Hung WWTP and
30,000 m3day−1(120,000 inhabitants) for Binh Hung Hoa WWTP
(see Figure 1c). WWTP inputs were calculated with the WWTPs' dis-charge capacity and mean output concentrations after treatment (see Table A2 and Equation(3).
Flux.tonyear−1Σ=C × Q × 3,600 × 24 × 365
106 , ð3Þ
where
− +
• Flux is the annual flux of TSS, Total N, N O3 ,NH4 ,Total P, or
PO43 − (ton year−1);
• C is the mean annual concentrations in wastewater (mg L−1);
• Q is the mean annual wastewater discharge(m3 s−1). Net flux from urban canals to rivers
Two main urban canals (Tham Luong canal in the north and Ben Nghe canal in the south of HCMC) receive untreated wastewaters (Figure 1c). The large Nhieu Loc–Thi Nghe canal in the centre of HCMC was recently protected from most direct untreated discharges when a large sewerage system was built in 2012 (World Bank Sanita-tion project, 2012). Influent loading was estimated using the annual domestic water discharges and the mean annual TSS and nutrient con-centrations within the canals, which were calculated from the data supported by CEM-DONRE (2012–2016). The untreated wastewater discharge was estimated from the number of people living near these three canals (Ho Chi Minh City Statistical Yearbook, 2016) and the per capita water consumption of ~150 L inhab−1day−1proposed by
Triet et al. (2008; Table A2). Annual flux was the product of annual water discharges and annual mean concentrations at low tide in urban canals (see Table A2).
2.4.3
| Industrial inputs
Several large industrial zones exist in the Saigon–Dongnai River with different activities. To estimate industrial inputs, we gathered infor-mation on companies within HCMC concerning their production, dis-charge effluents, and water quality variables (e.g., TSS and nutrients). Our approach comprised (a) selection of the companies with organic
and nutrient emissions (paper, chemical/fertilizer, food processing, textile, pharmaceutical chemistry and cosmetic, detergent, and per-sonal hygiene products) and (b) elaboration of a questionnaire sent to all the companies selected. This questionnaire was sent to 183 compa-nies, requesting them to provide information on (a) wastewater efflu-ent discharge and production and (b) quality of wastewater (TSS and nutrient concentrations) and (c) how effluents were discharged (directly to the rivers, into canals or stored in basins). We received 41 answers, only 11 of which could be used for the calculations.
We assumed that industrial inputs can be estimated using two approaches: (a) based on data from questionnaires to calculate nutri-ent input from sectors such as the paper industry, chemical/fertilizer industry, food processing industry, and pharmaceutical chemistry industry (first group) and (b) based on HCMC Export Processing and Industrial Zones Authority data and the Vietnamese industrial water quality regulation (QCVN40, 2011) to calculate input from the textile, cosmetic, detergent, and personal hygiene product industries (second group).
For the first group, annual nutrient fluxes were the product of mean wastewater discharge and mean TSS and nutrient concentra-tions for each sector (see Table A3 and Equation (3)). For the second group, we hypothesized that daily water discharges can be estimated based on the discharge of each industrial zone and the percentage from the textile company or the cosmetic, detergent, and personal hygiene products companies (see Equation (4)). TSS and nutrient fluxes were calculated from daily discharges and concentrations (see Equation (3)), in which TSS and nutrient concentrations were extracted from QCVN40 (2011; see Table A4).
IZ Nsector
NIZ
Q = Q × , ð4Þ
where
• Q and QIZare the daily discharge of professional and industrial
zones (m3day−1), repsectively;
• Nsectorand NIZare the numbers of textile companies or cosmetic,
detergent, and personal hygiene product companies and the total number of companies in each industrial zone, respectively.
2.4.4
| Atmospheric depositions
Atmospheric depositions were evaluated through the collection of rainwater during the 2017 rainy season on the roof of the CARE labo-ratory in an urban area of HCMC (Figure 1). These deposition were monitored from May 2017 to December 2017 (rain during this period accounts for more than 90% of yearly precipitation). The volume of rainwater was collected using an oven-type gauge (AFNOR NF X 43-014) and measured after each rain event. The samples from Monday to Sunday were combined to provide one composite sample per week. These samples were analysed for TSS, Total N, NO3−,
surface of HCMC was 27,142 ha in 2016 (Nguyen, Chi-Farn, Cheng-Ru, Bui-Xuan, & Tran-Hau, 2017). The annual flux was calculated as the product of weekly cumulative rain and weekly concentrations (see Table 1 and Equation(5).
Fluxannual= Pn i = 1 27142× Fluxweekly 1000 C
, with Fluxweekly = weekly× Q × 10 4 weekly 106 , ð5Þ where − +
• Fluxannual is the annual flux of TSS, Total N, N O3 , NH4 , Total P,
PO43−, or DSi (ton year−1);
− +
• Fluxweekly is the specific flux of TSS, Total N, N O3 , NH4 , Total P,
PO43−, or DSi (kg ha−1);
• Cweekly is the weekly concentration in rainfall (mgL−1);
• Qweekly is the weekly cumulative rainfall for the period recorded
(mm);
• n = 35 and 27,142 (ha) is the impervious surface of H CMC in 2016 (Nguyen et al.,2017).
2.4.5
| Assumption on TSS and nutrient budgets
The TSS and nutrient budgets were built based on industrial and domestic inputs (treated and untreated nutrient inputs) and atmo-spheric deposition, as described above. The estimations were based on many data source, as well as on several hypotheses. Data from questionnaires may be partial because all answers from companies were not always correctly registered. Moreover, due to the lack of data, Total N and Total P fluxes in domestic inputs were estimated from data reported in theliterature.
Another important type of data needed to establish a complete budget is the N O3−flux in WWTPs and industrial discharges, and
Total N and Total P fluxes in canals. The estimation of these fluxes was based on two assumptions. Generally, N exists in organic and inorganic forms; the Total N concentration is the sum of dissolved inorganic nitrogen (NO3− and NH4+), dissolved organic nitrogen,
particulate organic nitrogen, and particulate inorganic nitrogen (e.g., NH4+ adsorbed onto particles). However, according to QCVN14
(2008) and QCVN40 (2011), level of organic nitrogen in domestic and industrial wastewater after treatment is rather low, close to
0.003 mgN L−1. We can therefore ignore organic nitrogen in treated
wastewater. We assumed that N in wastewater only comprises N O3−
and N H +. The difference between Total N and N H + input was
con-4 4
3
sidered as N O −input from WWTPs and industrial discharges.
2.4.6
| Expected nutrient inputs in 2025, 2040,
and 2050
To estimate nutrient fluxes in the future, we assumed that HCMC's population would increase 3 % per year (according to ADB (Asian Devel-opment Bank), 2010, and Ho Chi Minh City Statistical Yearbook, 2016) and inhabitant's water consumption could reach approximately 200 L inhab−1day−1in 2025 (Nguyen et al., 2011). By 2020–2025, the total
capacity of wastewater to be treated will be 1.3 million m3day−1
(DONRE, pers. comm.). All the current sewage treatment plants in HCMC use the conventional activated sludge technique without spe-cific biological or chemical nutrient removal (QCVN 14, 2008). The average Total N and Total P removal is therefore about 40–50% and 10–15%, respectively (Metcalf and Eddy/AECOM, 2014).
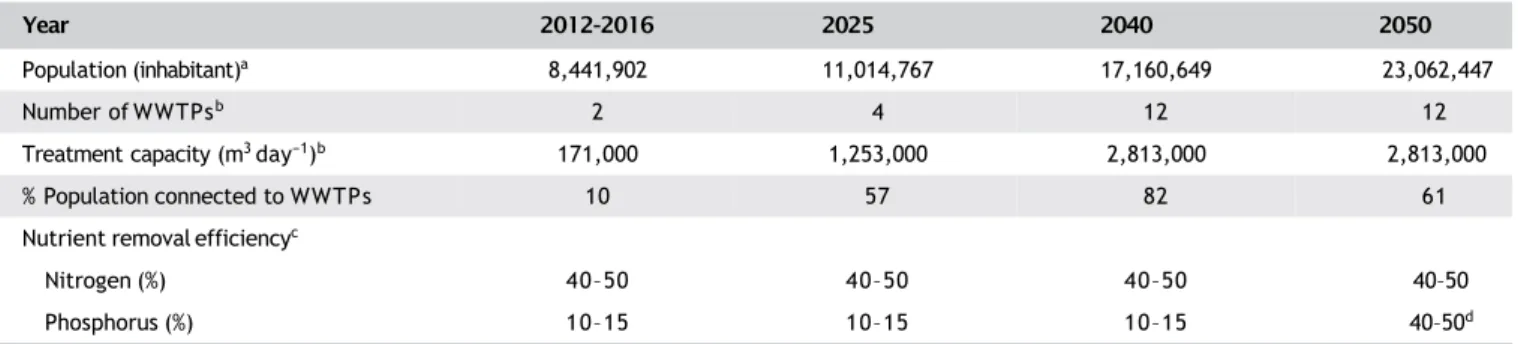
With the nutrient concentration and nutrient removal efficiency dataset, the population as well as the number and treatment capacity of WWTPs and gross nutrient inputs were calculated based on per capita human nutrient emissions and the population of HCMC (Equation (2)). Net nutrient inputs by WWTPs were calculated based on the expected population connected to WWTPs per capita human nutrient emissions and nutrient removal efficiency (Equation (6) and Table 2).
−1
. Σ
Flux tonyear =E × InhabWWTP× 365 × C
100,000 , ð6Þ
where
• Flux is the annual flux of Total N and Total P (ton year−1);
• E is Total N and Total P in domestic emissions (g capita−1day−1);
• InhabWWTP is the population of H C M C that is connected to
WWTPs (capita);
• C is the nutrient removal efficiency(%).
3 | RESULTS
3.1
| Seasonal variation of TSS and nutrient
concentrations
The spatial variation of TSS and nutrients was averaged at each site for the dry and wet seasons of the 2012–2016 period (Figure 2a).For
3
Concentration Specific flux
Parameters (mg L−1 ±SD) (kg ha−1)a TSS 7.94 ± 8.43 4.19 N–NH4+ 0.21 ± 0.16 0.13 N – N O − 0.30 ± 0.13 0.24 Total N 1.66 ± 0.71 1.17 P–PO43 − 0.01 ± 0.004 0.007 Total P 0.03 ± 0.015 0.018 DSi 0.12 ± 0.07 0.08
TA BL E 1 Meanannual concentrations and specific fluxes of TSS and nutrients from atmospheric depositionsin 2017
Abbreviation: TSS, total suspended sediment.
the river sites, no difference was, on average, observed for the dry and wet seasons. However, the standard deviation revealed high vari-ability for both seasons at all sites. The spatial variation of the TSS concentration clearly showed an increase in the H CMC sector. The highest averaged TSS concentration was approximately 215 mg L− 1at
3 −
the city centre. NH4+and PO4 concentrations only slightly varied
from upstream to downstream along the Saigon River. However, NH4+ values appeared slightly higher in the residential sector of
HCMC (0.48 ± 0.67 mgN L−1); elsewhere lower values (0.2 ± 0.1
mgN L−1) were observed. PO
43 −concentrations fluctuated slightly,
around 0.07 ± 0.02 mgP L− 1from upstream to downstream (Figure
2a).
3 − +
High concentrations of PO4 and NH4 were found in urban
canals (Figure 2b) with value 10 and 20 times higher than in the Sai-gon and Dongnai Rivers (Figure 2a). This undoubtedly indicates inputs of untreated domestic wastewaters. With such high concentrations,
Tham Luong canal (2,494,983 inhabitants) and Ben Nghe canal (2,409,606 inhabitants) can be considered as wastewater collectors draining HCMC. A decrease in TSS, NH4+, and PO43 −concentrations
was observed, from upstream to downstream, which indicates a possi-ble accumulation of the domestic pollution emitted into the canals (Figure 2b).
2.|
Seasonal and interannual variations of river
fluxes and the effect of hydrological conditions
1.
| Seasonal variation of river fluxes
Seasonal fluctuations of TSS and nutrient fluxes distinguish two dis-tinct hydrological phases, with a wet season that lasted 7 months, from May to November, and a dry season characterized by low flow
Year 2012–2016 2025 2040 2050
Population (inhabitant)a 8,441,902 11,014,767 17,160,649 23,062,447
Number of WWTPsb 2 4 12 12
Treatment capacity (m3day−1)b 171,000 1,253,000 2,813,000 2,813,000
% Population connected to WWTPs 10 57 82 61
Nutrient removal efficiencyc
Nitrogen (%) 40–50 40–50 40–50 40–50
Phosphorus (%) 10–15 10–15 10–15 40–50d
TA BL E 2 Treatment capacity and nutrient removal efficiency of WWTPs from past to future
Abbreviation: WWTPs, wastewater treatment plants.
aPopulation growth, 3% per year from ADB (Asian Development Bank), 2010, Ho Chi Minh City Statistical Yearbook, 2016.
bPlanning of the building of new WWTPs from Tran Ngoc et al., 2016.
cNutrient removal efficiency in conventional active sludge treatment process from Metcalf and Eddy/AECOM, 2014.
dExpected improvement of P retention through precipitation process.
FIG U RE 2 Mean totalsuspended
+ 3 −
sediment (TSS), NH4 , and PO4
concentrations over the 2012–2016 period: (a) along the Saigon River (SG)and the Dongnai River (DN) during the wet and dry seasons and(b) in urban canals of Ho Chi Minh City (HCMC); BC, BS, PC, RT, BP, SG, BD, PM, NB, and HA are 10 sampling sites within the Saigon– Dongnai River basin (Ben Cui, Ben Suc, Phu Cuong, Rach Tra, Saigon, Bach Dang, Phu My, Nha Be, and Hoa An,
respectively). In Figure 2a, bold legends represent sampling sites chosen for the budget calculation
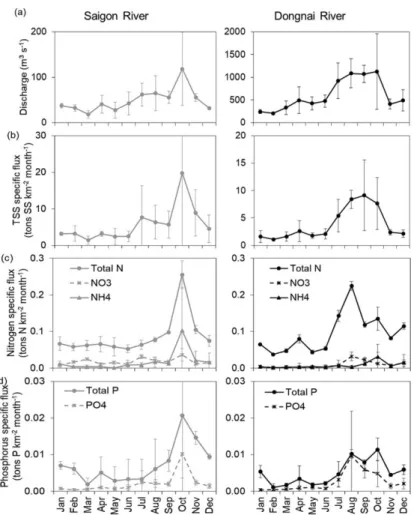
conditions from December to April (5 months). Seasonality is much more pronounced for the Dongnai River than for the Saigon River (Figure 3).
Whereas net water discharge in the Saigon River ranged from 4.18 to 222 m3s−1, in the Dongnai River, net water discharge
fluctu-ated from 85.4 to 2,524 m3 s− 1 (Figure 3a). The mean discharge is
thus 12 times lower in the Saigon River (50 m3s−1) than in the
Dong-nai River (632 m3s−1).
During the monitoring period considered (2012–2016), TSS spe-cific flux in the Saigon River ranged from 1.5 to 20 tonSS km−2
month−1; in the Dongnai River, lower values were observed (from 1.1
to 9.2 tonSS km−2month−1; Figure 3b). De facto, similar to the
monthly water discharges for both rivers, the maximum TSS specific flux also extended from May to November (Figure 3b). The peak of TSS specific flux accounted for 77% of the annual TSS specific flux in the Saigon River and 80% of the annual TSS specific flux in the DongnaiRiver during this period.
The high values of Total N, N O3− and NH4+ specific fluxes
similarly extended during the May to November period for the two rivers (Figure 3c). During the wet season, the Saigon River
deliv-−
ered 0.71 tonN of Total N, 0.14 tonN of N O3, and 0.17 tonN of
NH4+, which was 68%, 66%, and 82% of total annual specific fluxes,
respectively. These specific fluxes were 0.8 tonN of Total N, 0.09 tonN of NO3−, and 0.07 tonN of NH4+ exported by the
Dongnai River. Based on the monthly specific fluxes of Total P and PO43 −in the two rivers, it appears that most of the annual specific
flux was again exported during the wet season, that is, 67% and 83% of total annual Total P and PO43 −specific fluxes for the Saigon River
and 71% and 86% for the Dongnai River, respec- tively (Figure 3d).
3.2.2
| Interannual variations of river fluxes
Whatever year is considered, the difference between Saigon and Dongnai tributaries predominated over interannual variations (Figure 4). During the 2012–2016 period, the mean fluxes of TSS, NH4+, and
PO43 −in the Dongnai River were 5, 6, and 3 times higher than those
in the Saigon River, respectively, with a factor of 10 for discharge. The lowest TSS fluxes (19×103tonSS year−1), NH
4 +
(23 tonN year−1), and PO 3 − (32 tonP year−1) were observed at Ben 4
Suc in 2012, when the minimal water discharge was recorded. Con-versely, the maximum yearly fluxes occurred at higher discharge, that is, 1.43 × 10⁶ tonSS year−1 (in 2013) for TSS, 4.65 × 10³ tonN year−1
for N H +, and 1.44 × 10³ tonP year−1 for PO 3 − (in 2016; Figure 4).
4 4
The Saigon River transported about 60% DIN and 20% DIP of the total N and total P, whereas the Dongnai River transported only 24% DIN and 63% DIP, respectively.
FIG U RE 3 Seasonal variations of (a)discharges (b) total suspended sediment (TSS) and (c–g) nutrient fluxes in the Saigon (Bach Dang station) and Dongnai (Hoa An station) River system(2012–2016)
3.
| TSS and nutrient budgets in the Saigon River
1.
| Water budget
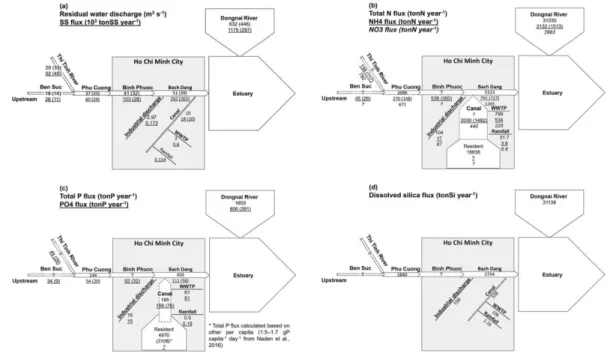
The discharge contribution was calculated independently for each site (and tributaries) and appeared balanced (Figure 5a). Urban waters accounted for 20% of the Saigon River discharge on average over the 2012–2016 period, indicating a potential impact of untreated waste-waters. Knowing that the Saigon River is around 200 m wide and 10 m deep in the city, the mean residual water discharge of the Saigon River was rather small (51 m3s−1).
3.3.2
| TSS budget
The mean annual TSS flux delivered by the Dongnai River was around 1.18 × 10⁶ tonSS year−1, about 4 times higher than the amount
exported by the Saigon River. Crossing of HCMC, the TSS flux in the Saigon River increased over tenfold to reach 290 × 103 tonSS year−1
watershed's upstream value in comparison with the
(26× 103tonSS year−1; Figure 5a).
3.3.3
| Nitrogen budget
The Saigon River delivered 5,323 ± 378, 1,928 ± 59, and 791 ± 727 tonN year−1for Total N, N O
3,and NH4 ,respectively,
− +
during the 2012–2016 period, whereas the Dongnai River exported 31,030, 2,963, and 2,132 tonN year−1, respectively. The urban canals
contributed to a maximum of about 2,200 tonN year−1, which means
that 90% of Total N emitted through untreated wastewaters was retained or lost in urban canals (mostly for the N H + form [see
4 −
Figure 5b] nitrified in N O3 and subsequently denitrified in N2).
3.3.4 |Phosphorusbudget
The Saigon–Dongnai river system delivered 2,103 and 917 tonP year−1
for Total P and PO43−, in which the Saigon River exported 21% and
13% of total annual flux of Total P and PO43−, respectively.
Interest-ingly, total P input from domestic waste was 25 times higher than the outflow from the canal. Total P outflow was mainly as PO43 − (Figure
5c). In this study, to increase confidence on per capita P load- ing, we calculated a new scenario based on other per capita (1.5–-1.7 gP capita−1day−1from Naden et al., 2016; see Figure 5c, value in
italics). We observed that our budget was unbalanced for Total P flux, whatever the per capita considered.
3.3.5
| Silica budget
The Saigon–Dongnai river system delivered 66,500 tonSi year−1, in
which the Dongnai River exported 94% of the total annual flux of DSi (Figure 5d). Taking into account the wastewater discharge (industrial, WWTPs, and canal inputs), we estimated DSi input by taking the aver-age DSi concentration of the river upstream. Indeed, DSi input by industrial zones, WWTPs, and urban canals accounted for about 30% of the DSi flux in the Saigon River.
3.4
| Future nutrient inputs
The higher population will also affect net nutrient inputs from canals to rivers, which are expected to fluctuate substantially. We observed a decrease from about 18 × 103 tonN year−1 in 2016 to
10× 103tonN year−1in 2040 prior to an increase to 30× 103tonN
year−1in 2050 and from about 5× 10³tonP year−1in 2016 to 3 ×
103 tonP year−1 in 2040 prior to an increase to
8× 10³tonP year−1in 2050 (see Table 3). Over four different
investi-gation periods, the proportion of N and P retention in the urban area decreased from 30% to 26% for N and from 32% to 19% for P. These N and P retention percentages reached the highest value in 2040, FIG URE 4 Interannual discharges and fluxes of totalsuspended
sediments (TSS), N H +, and PO 3 − in the Saigon–Dongnai River
4 4
accounting for 37% for N and 66% for P, and decreased to 27% for N and 40% for P in 2050.
4 | DISCUSSION
4.1
| TSS and nutrient budgets in HCMC for the
2012–2016 period
Water discharge during the wet season accounted for 73% of the annual discharge at the Saigon River and 73% for the Dongnai River.
Since the Dau Tieng and Tri An reservoirs were built in the Saigon and Dongnai Rivers, the discharge in each river has been regulated for water demand and use (Trieu, Hiramatsu, & Harada, 2014). The dis-charge by Dau Tieng reservoir is up to 30 m3s− 1during the dry
sea-son to prevent saline intrusion in the Saigon River (Trieu et al., 2014). In contrast, TSS and nutrient concentrations were similar in dry and wet seasons and fluxes increased with increasing water discharge, in almost similar proportions.
4.1.1
| TSS budget
TSS urban inputs from canals cannot totally explain the global TSS increase, even when considering industrial discharge, WWTPs, and rainfall rather negligible (Figure 5a). Thus, local bank erosion is likely to be responsible for the difference, considering that sediment trap-ping probably occurring in the Dau Tieng reservoirs could be compen-sated downstream by river bank erosion (Kondolf, 1997).
It appeared that the specific TSS flux in the Saigon–Dongnai river system was around 47.1 tonSS km−2year−1and was over 4 times
sediment retention within the two reservoirs as well as by the storage within this low land elevation basin (knowing that the river is around 100–200 m wide and 8–12 m deep), as previously observed in the Red River basin in Vietnam (Luu et al., 2012). In a recent study, Marchesiello et al. (2019) demonstrated high coastal erosion
Net nutrient inputs fromWWTPs lower than that of the Mekong River (Wolanski, Huan, Dao, Nhan, &
Total N flux 799 11,319 25,412 25,412 Thuy, 1996), the Red River (Le et al., 2005, 2007), and theChangjiang
(tonN year−1) River (Liu et al., 2016; see Table 4). The TSS specific flux in the Saigon
Total P flux 61 3,641 2,373 4,335 and Dongnai Rivers thus appeared to be within the low range of those
(tonP year−1) observed worldwide. This can be explained by the high potential for
FIG U RE 5 (a) Mean annual water discharge (±SD) and annual suspendedsediment (±SD) budget (underlined values), (b) annual nitrogen (±SD) budget, (c) annual phosphorus (±SD) budget, and (d) annual dissolved silica (±SD) budget within the Saigon–Dongnai River system (2012–2016). Abbreviation: WWTP, wastewater treatmentplant
TA BL E 3 Gross nutrient inputs and net nutrients inputs from urban canals to river (past andfuture)
Year 2012–2016 2025 2040 2050
27,732 36,184 56,373 75,760
Gross nutrient inputs Total N flux
(tonN year−1) Total P flux
(tonPyear−1)
7,395 9,649 15,033 20,203
Net nutrient fluxes from canals to rivers
18,638 15,603 10,169 29,557 Total N flux (tonN year−1) Total P flux (tonP year−1) 4,970 4,161 2,712 7,882
downstream of the Saigon River estuary and also assumed that ero-sion was a consequence of sediment trapping by dams in the Saigon and Dongnai Rivers (Marchesiello et al.,2019).
4.1.2
| Nitrogen budget
The specific Total N flux was 1,164 kgN km−2year−1, 1 to 5 times
higher than for the Red River (Le et al., 2005, 2007), the Changjiang River (Liu et al., 2016; Zhang, 1996), and the Mekong River (Li & Bush, 2015; see Table 4). This indicates the high impact of the megacity of HCMC on the total N flux. Figure 5b clearly shows that untreated domestic wastewaters were responsible for the high level of N input.
−
Untreated domestic wastewaters dominated the fluxes of NO3and
NH4+, accounting for 77% and 58% of total N urban fluxes,
respec-tively, whereas industrial discharge and rainfall were negligible. The fluxes in urban canals were extremely high, about 10 times higher than the fluxes from other inputs. The results showed that the resi-dents living near urban canals released 18,638 tonN year−1. This
means that a large proportion of Total N was stored in urban canals or in individual septic tanks that are common in the old urban centre (Marcotullio, 2007). Consequently, a large amount of N may be lost in the septic tank and removed through cleaning. According to urban policy building in HCMC, septic tanks are widely used for most habita-tions, for a total storage capacity of 250–350 wet tons per day (Nguyen, Tran, & Nguyen, 2013). Septic tanks sludge presents high TSS and organic compounds (55–80% of dry weight) including N (Total N = 1,500–1,800 mg L− 1according to Nguyen et al., 2013).
Septic tanks are dredged every 1–10 years using small vehicles, and sludge is used as organic fertilizer after treatment. Moreover, the HCMC Urban Drainage Company and the Office of Waterway Man-agement are in charge of dredging canals in the inner city for naviga-tion, tourism purposes, and improving drainage (JICA, 2001). The total amount of dredged sediment is estimated at 1,750 m3day−1along 57
km of canals used as the drainage network (Nguyen et al., 2013). The surface layer (30–50 cm) is highly polluted, whereas the bottom
layer is mainly sand and coarse particles. Urban rivers and canals play an important role in N sink through sediment–water exchange, as mentioned in the Nhue and Day River systems in Hanoi in the north of Vietnam, similar to the Saigon River system (Trinh, Meysman, Rochelle-Newall, & Bonnet, 2012). Dredged sludge from canals is transported to the Solid Waste Treatment Company of HCMC for composting for the most part, but within the limits of treatment capacity, or even “open dumping” without treatment (Nguyen et al., 2013; Urban Drainage Company, pers. comm.). Overall, canal and sep-tic tank sludge collection likely explains the high removal rate evidenced in our N budget.
In addition, once N enters the river system, in-stream N
transfor-+ −
mations, such as NH4 nitrification followed by NO3 denitrification
continue as the result of both physicochemical and biogeochemical processes (Van Drecht et al., 2003). The corresponding N removal within the aquatic system accounts for approximately 70% of all the
+
inputs of NH4 . Nitrification, denitrification, and algal uptake are
suspected to occur at a high rate, with the warm weather conditions in this tropical environment favouring biological activities (Luu et al.,
+
2012; Nguyen, Nguyen, Bui, & Khoa, 2007). The low level of NH4 in
rivers compared with urban canals and further compared with the
+
total N inputs largely as NH4 , confirm the role played by
thenitrifica-tion process, followed by denitrificathenitrifica-tion (Nguyen etal., 2019).
4.1.3
| Phosphorus budget
The specific Total P flux was 67.4 kgP km−2year−1and was 2 to 5
times lower than in the Red River Delta (Le et al., 2005, 2007) and the Changjiang River (Zhang, 1996; Liu, Zhang, Chen, & Zhang, 2005; Liu et al., 2016. High retention of particulate P within the river sys-tems can explain this finding. P is known to adsorb easily onto suspended sediment and the fate of particulate P is closely related to the TSS flux. As an illustration, the Red River Delta retained 50% of the incoming flux of P from upstream (Luu et al., 2012). Figure 5c shows that Total P and PO3 − fluxes from untreated wastewaters
4
Area Specific discharge TSS specific flux Specific TN flux Specific TP flux
River (km−2) (103 m3 km−2year−1) (tonSS km−2year−1) (kgN km−2 year−1) (kgP km−2year−1) References
Saigon River 4,717 335 62 1,129 95 This study
Dongnai River 26,499 751 45 1,171 62
Saigon– 31,216 689 47 1,165 67
Dongnai River basin
Mekong River 790,000 595 215 238 24 Wolanski et al.,1996;
Li & Bush, 2015
Red River basin 156,451 1,104 280 855 325 Le et al., 2005, 2007
Changjiang River (China)
1,808,500 9,285 4819 346 145 Zhang, 1996; Liuet al.,
2016
TA BL E 4 Specific fluxes of TSS and nutrients in the Saigon–Dongnai River system and in some rivers in the world
accounted for 71% and 69% of the total annual fluxes of urban area into river. We observed that residents annually released 4,970 tonP into canals. Again, a low percentage (3.7%) of Total P flux was transferred into the Saigon River, indicating that about 96% of Total P may be stored in the canals. This Total P storage also concerned
3 −
PO4,which may strongly adsorb onto sediment. This
sedimentaccu-mulation was evidenced in the urban canals of Bangkok, which pre-sents a similar geography, demography, and wastewater management as H CMC (Færge, Magid, & Penning de Vries Frits, 2001). As men-tioned above, dredging of the urban canals can explain the high removal of P from the system, sediment being much richer in P in canals (Strady et al., 2017). This conclusion is in line with the observa-tions made by Babut et al. (2019) on the disappearance of organic pol-lutants in the Saigon River.
4.2
| Nutrient flux ratios as an indicator of
potential eutrophication
The ICEP proposed by Billen and Garnier (2007) is particularly rele-vant to evaluate the new production of non-siliceous biomass potentially sustained in the estuarine zone by either N or P deliv-ered in excess over Si (Garnier, Billen, Némery, & Sebilo, 2010). The ICEP was based on the Redfield molar C:N:P:Si = 106:16:1:20 (Redfield et al., 1963), with the equations described in Garnier et al. (2010). For the purposes of river-to-river comparison, it is scaled to the river basin area, expressed in specific flux in kgC km−2day−1.
Depending on the nutrient considered, either N-ICEP or P-ICEP can be defined, following relationships (6) or (7), respectively:
• If NFlux/PFlux < 16 (N limiting), where N:Si and C:N are the Red-field ratio,
N−ICEP = NFlux SiFlux N C 14 28 Si N
ΣΣ Σ Σ
− × × × 12 ; ð6Þ
• if NFlux/PFlux > 16 (P limiting), where P:Si and C:P are the Red-field ratio,
P−ICEP = PFlux SiFlux P C 31 28 Si P
ΣΣ Σ Σ
− × × × 12 ; ð7Þ
where NFlux, PFlux, and SiFlux are the mean specific fluxes of Total N, Total P, and DSi, delivered at the outlet of the river basin, expressed in kgN km− 2day−1, kgP km−2day−1, and kgSi km−2day−1,
respectively. A negative N-ICEP or P-ICEP value illustrates that N and P are not in excess over silica and thus characterize the limitation of the eutrophication phenomenon, with a possible dominance of desir-able diatoms well palatdesir-able for the higher trophic level. Positive values indicate an excess of either N or P over the requirements for diatom growth, a condition for potentially harmful non-siliceous algal devel-opment such as cyanobacteria or dinoflagellates, possibly producing toxins.
We observed that the Saigon River, under high human pressure, was characterized by N:P ratios above the Redfield ratio (N:P > 16, Nguyen et al., 2019), which indicated an excess of N over P with respect to algal growth requirements. Thus P becomes a potential lim-itation of primary production. Furthermore, both the P-ICEP and N-ICEP provided positive values for the Saigon–Dongnai Rivers (9.8 and 21.6 kgC km−2day−1, respectively; see Table 5), indicating that excess
in N and P could lead to a high potential for coastal eutrophication. Specifically examining the Saigon River, the P-ICEP and N-ICEP were also positive. This eutrophication risk is confirmed from our measure-ments, chlorophyll a often being higher than 25 μg L− 1and up to 150
μg L−1, far beyond a good trophic value (Nguyen et al., 2019).
Eutrophication has not yet occurred downstream of the Saigon River– Soai Rap estuary, probably because of the high nutrient metabolism potential of the Can Gio Mangrove, as recently demonstrated (David, Marchand, Thiney, Nhu-Trang, & Meziane,2019).
4.3
| Future nutrient emissions from HCMC by
2025–2050
During the 2012–2016 period, the proportion of urban households connected to the main sewage treatment system was low (only 10%). In addition, the population should increase by about 270% between 2016 and 2050 (Table 2). According to HCMC authorities, an ambi-tious environmental sanitation project aims at building a drainage basin inside the city and establishing 10 new WWTPs (Tran Ngoc
Saigon River basin Dongnai River basin Saigon–Dongnai River basin
Parameters (4,717 km2) (26,499 km2) (31,216 km2)
N:P (FluxN:FluxP) 29 27 27
P specific flux (kgP km−2day−1) 0.49 0.39 0.40
N specific flux (kgN km−2 day−1) 6.49 4.72 4.98
Si specific flux 1.59 3.22 2.97
(kgSi km−2day−1)
P-ICEP (kgC km−2day−1) 16.7 8.5 9.8
N-ICEP (kgC km−2day−1) 33.2 19.5 21.6
et al., 2016). Very recently in 2018, the treatment capacity increased by 21% of the population with the construction of two new WWTPs and the increase of the treatment capacity of the Binh Hung WWTP. We estimated that about 57% of the city's inhabitants will have access to wastewater treatment systems in 2025 versus approxi-mately 82% in 2040. With a stable water treatment capacity from 2040 to 2050, the population in HCMC connected to sewage treat-ment systems will decrease to 61%, because of the increase of the number of inhabitants. Moreover, wastewater collection by WWTPs would decrease the net nutrient fluxes from urban canals to the river at the 2040 horizon prior to an increase of these fluxes from 2040 to 2050, assuming that the collected volume will not exceed the WWTP capacity.
Gross nutrient inputs are expected to double in 2040 and triple in 2050, for both Total N and Total P fluxes. The expected construction and operation of 10 new WWTPs for the additional 6 million inhabi-tants should lead to a decrease in Total N and P inputs. With a rise of the H CMC population up to 23 million inhabitants in 2050 and no fur-ther wastewater treatments, the net nutrient fluxes from the canals to the river could increase to about 30 tonN year−1and 8 tonP year−1. It
seems that the increase in population from 17 to 23 million inhabi-tants, and hence the associated wastewater increase, has not been included to date in the sanitation managementplans.
To evaluate the effect of the construction of the ten WWTPs in the future in terms of eutrophication, we estimated nutrient ratios and the ICEP index based on nutrient fluxes in 2025, 2040. and 2050. Dissolved silica comes from rock weathering; without taking into account climate change possibly increasing this process, we can assume that silica fluxes will remain stable. As discussed above, urban canals were the main source in the HCMC area, where about 48% of Total N flux and 58% of total P flux in the Saigon River originate from urban canals (Figure 5b,c). Therefore, river fluxes in the future can be considered as a sum of the present river fluxes and nutrient inputs from urban canals to rivers for the 2050 horizon explored. On this basis, we would observe a change in the P limiting factor to the N lim-iting factor for algal development in the Saigon River. This is pres-ented by the N:P ratio below 16, indicating an excess of P over N with respect to algal growth requirements. Furthermore, the P-ICEP would increase from 16.7 to 369 kgC km−2day−1in 2050. This
indi-cates an extremely high potential eutrophication in the Saigon River with a potential increase in undesirable algae. Eutrophication would also occur downstream of the Saigon River and the coastal zone with the occurrence of harmfulalgae.
5 | CONCLUSIONS AND
RECOMMENDATIONS
Based on the water discharge, TSS, and nutrients (N and P) concentra-tion data collected, we assessed that the Saigon and Dongnai Rivers delivered 1.47 × 10⁶ tonSS year−1, 36.4 × 10³ tonN year−1, and
2.1× 10³tonP year−1, respectively, into the estuary. Seasonal and
spatial variations were closely linked to the hydrological patterns of
the Saigon and Dongnai watersheds. With much higher N and P con-centrations in the Saigon River, fluxes were much higher for the Dongnai River with a tenfold average discharge. The 5 years docu-mented, including wet and dry years, provide robust estimates, despite considerable variability. The newly established budgets high-light the worrying impact of untreated domestic wastewaters released by H CMC into the estuarine system. Urban canals in H CMC were shown to be responsible for the increasing TSS, P, and N fluxes in the Saigon River. However, they appeared to be efficient biological reac-tors for eliminating/retaining a large part of the domestic load, and dredging in these canals seems to be an important management tool that deserves further study. As a result, the positive ICEP values at the outlet of the Saigon–Dongnai River system indicates on the eutro-phication risk of the coastal zone. Even if the financing plan has not yet been consolidated, the local authorities have already started to build new WWTPs to reduce the direct release of untreated wastewa-ters and to recover good water quality, which is believed to be man-datory to secure the water resource. The scenarios tested, however, showed that an increasing population without appropriate treatment in WWTPs could worsen the water quality of the Saigon River in HCMC, calling for enlarging the current management plan.
For instance, a dredging plan and linked solid waste management are the major challenge for H CMC to prevent pollution emissions from urban canals to rivers. Without an awareness of the situation, the coastal zone could rapidly encounter an eutrophication problem with the occurrence of undesirable algae that may threaten aquacul-ture within the Can Gio mangrove area and fisheries in the coastal zone.
These results highlight the challenges that the megacity H C M C is now facing to ensure both good economic and ecological health. The estimation of future nutrient inputs clearly underlines the need to build the 10 WWTPs, as planned in the planning framework and already started, but an additional effort will be necessary with any fur-ther increase in population. HCMC is not unique and exemplifies the trajectory that many coastal megacities are experiencing, or will expe-rience, in Asia and Africa.
ACKNOWLEDGEMENTS
This study was conducted under the framework of CARE-RESCIF ini-tiative and collaboration between CEM-DONRE and CARE-HCMUT. The study was supported by the CMIRA “Saigon River: La ville et fleuve” Region Auvergne Rhone Alpes project and by the EC2CO Bioheffect Structurante Initiative.
DATA AVAILABILITY STATEMENT (DAS)
Data from scientific monitoring are available on request from the authors. The data that support the findings of this study are available from the corresponding author, Nguyen Tuyet, upon reasonable request. The data from the Vietnamese monitoring program that sup-port the findings of this study are available from DONRE. Restrictions apply to the availability of these data, which were used under licence for this study. Data are available from the authors with the permission of DONRE.
ORCID
Tuyet T.N. Nguyen https://orcid.org/0000-0003-1129-3577
REFERENCES
ADB (Asian Development Bank) (2010). Ho Chi Minh City—Adaptation to
climate change: Summary Report (p. 43). Mandaluyong City: Asian
Development Bank.
APHA (1995). Standard methods for the examination for water and
wastewa-ter (19th ed.).New York: American Public Health Association, Inc.
Babut, M., Mourier, B., Desmet, M., Simonnet-Laprade, C., Labadie, P., Budzinski, H., … Gratiot, N. (2019). Where has the pollution gone? A survey of organic contaminants in Ho-Chi-Minh City/Saigon River
(Vietnam) bed sediments. Chemosphere, 217, 261–269. https://doi.
org/10.1016/j.chemosphere.2018.11.008
Billen, G., & Garnier, J. (2007). River basin nutrient delivery to the coastal sea: Assessing its potential to sustain new production of non-siliceous
algae. Marine Chemistry, 106, 148–160. https://doi.org/10.1016/j.
marchem.2006.12.017
Carpenter, S. R., Caraco, N. F., Correll, D. L., Howarth, R. W., Sharpley, A. N., & Smith, V. H. (1998). Non-point pollution of surface waters with phosphorus and nitrogen. Ecological Applications, 8,
559– 568. https://doi.org/10.1890/1051-0761(1998)008[0559:
NPOSWW]2.0.CO;2
Conley, D. J., Kilham, S. S., & Theriot, E. (1989). Differences in silica con-tent between marine and freshwater diatoms. Limnology and
Oceanography, 34, 205–212.https://doi.org/10.4319/lo.1989.34.1. 0205
Conley, D. J., Paerl, H. W., Howarth, R. W., Boesch, D. F., Seitzinger, S. P., Havens, K. E., … Likens, G. E. (2009). Controlling eutrophication:
Nitro-gen and phosphorus. Science, 323, 1014–1015. https://doi.org/10.
1126/science.1167755
Dao, T. S., Nimptsch, J., & Wiegand, C. (2016). Dynamics of cyanobacteria and cyanobacterial toxins and their correlation with environmental parameters in Tri An Reservoir, Vietnam. Journal of Water and Health,
14(4), 699–712.https://doi.org/10.2166/wh.2016.257
David, F., Marchand, C., Thiney, N., Nhu-Trang, T. T., & Meziane, T. (2019). Short-term changes in the quality of suspended particulate matter in a human impacted and mangrove dominated tropical estuary (Can Gio,
Vietnam). Continental Shelf Research, 178, 59–67. https://doi.org/10.
1016/j.csr.2019.03.011
Duong, T. T., Le, T. P. Q., Dao, T. S., Pflugmacher, S., Rochelle-Newall, E., Hoang, T. K., … Dang, D. K. (2013). Seasonal variation of cyanobacteria and microcystins in the Nui Coc Reservoir, Northern Vietnam. Journal
of Applied Phycology, 25, 1065–1075. https://doi.org/10.1007/ s10811-012-9919-9
Duong, T. T.,Le, T. P. Q., Vu, T. N., Hoang, T. K., Dang, H. P. H.,
Nguyen, S. N., … Dang, D. K. (2010). Environmental factors associated with cyanobacteria occurrence in the Nui Coc reservoir (Thai Nguyen province). Vietnam J. Sci. Technol., 48(4A), 397–403.
Duong, T. T.,Vu, T. N., Hoang, T. K., Dang, H. P. H., Le, T. P. Q., & Tran, V. T. (2010). Variation of phytoplankton density and the cyano-bacteria occurrence and their toxins in the water environment of the Nui Coc reservoir (Thai Nguyen province). Vietnam J. Sci. Technol.,
48(4A), 391–396.
Færge, J., Magid, J., & Penning de Vries Frits, W. T. (2001). Urban nutrient
balance for Bangkok. Ecological Modelling, 139, 63–74.https://doi.org/
10.1016/S0304-3800(01)00233-2
Garnier, J., Billen, G., Némery, J., & Sebilo, M. (2010). Transformations of nutrients (N, P, Si) in the turbidity maximum zone of the Seine estuary and export to the sea. Estuarine, Coastal and Shelf Science, 90(3), 129– 141.https://doi.org/10.1016/j.ecss.2010.07.012
Ho Chi Minh City Statistical Yearbook (2016). HCMC Statistical Office. Vietnam: Thanh Nien Publisher.
JICA, 2001. The Detailed Design Study on HC M C Water Environment Improvement Project—Chapter 3 Tau Hu - Ben Nghe Canal Improvement
Kondolf, G. M. (1997). PROFILE: Hungry water: Effects of dams and gravel mining on riverchannels. Environmental Management, 21(4), 533–551. Langenberg, V. T., Nyamushahu, S., Roijackers, R., & Koelmans, A. A.
(2003). External nutrient sources for lake Tanganyika. Journal of Great
Lakes Research, 29(Suppl. 2), 169–180. https://doi.org/10.1016/ S0380-1330(03)70546-2
Le, T. P. Q., Billen, G., Garnier, J., Théry, S., Fézard, C., & Van Minh, C. (2005). Nutrient (N, P) budgets for the Red River basin (Vietnam and
China). Global Biogeochemical Cycles, 19, 1–16. https://doi.org/10.
1029/2004GB002405
Le, T. P. Q., Garnier, J., Gilles, B., Sylvain, T., & Van Minh, C. (2007). The changing flow regime and sediment load of the Red River, Viet Nam.
Journal of Hydrology, 334, 199–214.https://doi.org/10.1016/j.jhydrol. 2006.10.020
Le, T. P. Q., Ho, C. T., Duong, T. T., Rochelle-Newall, E., Dang, D. K., & Hoang, T. S. (2014). Nutrient budgets (N and P) for the Nui Coc reser-voir catchment (North Vietnam). Agricultural Water Management, 142,
152–161.https://doi.org/10.1016/j.agwat.2014.04.014
Li, S., & Bush, R. T. (2015). Rising flux of nutrients (C, N, P and Si) in the
lower Mekong River. Journal of Hydrology, 530, 447–461.https://doi.
org/10.1016/j.jhydrol.2015.10.005
Liu, S. M., Qi, X. H., Li, X., Ye, H. R., Wu, Y., Ren, J. L., … Xu, W. Y. (2016). Nutrient dynamics from the Changjiang (Yangtze River) estuary to the
East China Sea. Journal of Marine Systems, 154, 15–27.https://doi.
org/10.1016/j.jmarsys.2015.05.010
Liu, S. M., Zhang, J., Chen, H. T., & Zhang, G. S. (2005). Factors influencing nutrient dynamics in the eutrophic Jiaozhou Bay, North China.
Pro-gress in Oceanography, 66, 66–85.https://doi.org/10.1016/j.pocean. 2005.03.009
Ludwig, W., Bouwman, A. F., Dumont, E., & Lespinas, F. (2010). Water and nutrient fluxes from major Mediterranean and Black Sea rivers: Past and future trends and their implications for the basin-scale budgets.
Global Biogeochemical Cycles, 24, GB0A13. https://doi.org/10.1029/ 2009GB003594
Ludwig, W., Dumont, E., Meybeck, M., & Heussner, S. (2009). River dis-charges of water and nutrients to the Mediterranean and Black Sea: Major drivers for ecosystem changes during past and future decades?
Progress in Oceanography, 80, 199–217. https://doi.org/10.1016/j. pocean.2009.02.001
Luu, T. N. M., Garnier, J., Billen, G., Le, T. P. Q., Nemery, J., Orange, D., & Le, L. A. (2012). N, P, Si budgets for the Red River Delta (northern Vietnam): How the delta affects river nutrient delivery to the sea.
Bio-geochemistry, 107, 241–259. https://doi.org/10.1007/s10533-010-9549-8
Marchesiello, P., Nguyen, N. M., Gratiot, N., Loisel, H., Anthony, E. J., San Dinh, C., … Kestenare, E. (2019). Erosion of the coastal Mekong delta: Assessing natural against man induced processes. Continental Shelf
Research, 181, 72–89.https://doi.org/10.1016/j.csr.2019.05.004
Marcotullio, P. J. (2007). Urban water-related environmental transitions in
Southeast Asia. Sustainability Science, 2, 27–54. https://doi.org/10.
1007/s11625-006-0019-0
Metcalf and Eddy/AECOM (2014). Wastewater engineering: Treatment and
resource recovery (Fifth ed.).USA: Mc Graw Hill Education Book.
Meybeck, M. (1982). Carbon, nitrogen, and phosphorus transport by world
rivers. American Journal of Science, 282, 401–450.https://doi.org/10.
2475/ajs.282.4.401
Meybeck, M., Chapman, D., & Helmer, R. (1989). Global freshwater quality:
A first assessment. Malden, Mass: Blackwell.
Naden, P., Bell, V., Carnell, E., Tomlinson, S., Dragosits, U., Chaplow, J., … Tipping, E. (2016). Nutrient fluxes from domestic wastewater: A national-scale historical perspective for the UK 1800-2010. Science of