HAL Id: hal-00328016
https://hal.archives-ouvertes.fr/hal-00328016
Submitted on 11 Oct 2006HAL is a multi-disciplinary open access
archive for the deposit and dissemination of sci-entific research documents, whether they are pub-lished or not. The documents may come from teaching and research institutions in France or abroad, or from public or private research centers.
L’archive ouverte pluridisciplinaire HAL, est destinée au dépôt et à la diffusion de documents scientifiques de niveau recherche, publiés ou non, émanant des établissements d’enseignement et de recherche français ou étrangers, des laboratoires publics ou privés.
Evaluation of ozonesondes, HALOE, SAGE II and III,
Odin-OSIRIS and SMR, and ENVISAT-GOMOS,
-SCIAMACHY and -MIPAS ozone profiles in the tropics
from SAOZ long duration balloon measurements in 2003
and 2004
F. Borchi, Jean-Pierre Pommereau
To cite this version:
F. Borchi, Jean-Pierre Pommereau. Evaluation of ozonesondes, HALOE, SAGE II and III, Odin-OSIRIS and SMR, and ENVISAT-GOMOS, -SCIAMACHY and -MIPAS ozone profiles in the tropics from SAOZ long duration balloon measurements in 2003 and 2004. Atmospheric Chemistry and Physics Discussions, European Geosciences Union, 2006, 6 (5), pp.10087-10152. �hal-00328016�
ACPD
6, 10087–10152, 2006 Evaluation of satellite O3 measuring instruments F. Borchi and J.-P. Pommereau Title Page Abstract Introduction Conclusions References Tables Figures J I J I Back CloseFull Screen / Esc
Printer-friendly Version
Interactive Discussion
Atmos. Chem. Phys. Discuss., 6, 10087–10152, 2006 www.atmos-chem-phys-discuss.net/6/10087/2006/ © Author(s) 2006. This work is licensed
under a Creative Commons License.
Atmospheric Chemistry and Physics Discussions
Evaluation of ozonesondes, HALOE,
SAGE II and III, Odin-OSIRIS and SMR,
and ENVISAT-GOMOS, -SCIAMACHY and
-MIPAS ozone profiles in the tropics from
SAOZ long duration balloon
measurements in 2003 and 2004
F. Borchi and J.-P. Pommereau
CNRS, Service d’A ´eronomie, Verri `eres le Buisson, France
Received: 14 July 2006 – Accepted: 6 October 2006 – Published: 11 October 2006 Correspondence to: F. Borchi ([email protected])
ACPD
6, 10087–10152, 2006 Evaluation of satellite O3 measuring instruments F. Borchi and J.-P. Pommereau Title Page Abstract Introduction Conclusions References Tables Figures J I J I Back CloseFull Screen / Esc
Printer-friendly Version
Interactive Discussion Abstract
The performances of satellite and sondes ozone measuring instruments available in the tropics between 10 and 26 km during the southern hemisphere summer in 2003 and 2004, have been investigated by comparison with series of profiles obtained by solar occultation in the visible Chappuis bands using a SAOZ UV-Vis spectrometer
5
carried by circumnavigating long duration balloons. When compared to SAOZ, system-atic positive or negative altitude shifts could be observed in satellite profiles, varying from <50 m for the GOMOS stellar occultation instrument, followed by+100/200 m for solar occultation systems (SAGE II, HALOE above 22 km), but as large as –900 m or +2000 m for limb viewing systems (OSIRIS, SCIAMACHY). The ozone relative biases
10
are generally limited, between –4% and+4%, for measurements in the visible Chap-puis bands (SAGE II and III, GOMOS above 22 km and OSIRIS), the near IR (HALOE above 22 km) and the ozonesondes, but increase to –7% in the UV (SCIAMACHY), and +7% in the mid-IR (MIPAS) and the submillimetric range (SMR). Regarding precision, evaluated statistically from the zonal variability of ozone concentration, the best
mea-15
surements are found to be those of SAGE II (2%), followed by HALOE above 22 km (3–4%), then the ozonesondes, SAGE III moon and OSIRIS (4–5 %), GOMOS above 22 km and SCIAMACHY (∼6%), MIPAS (8.5%) and finally SMR (16%). Overall, all satellite ozone measurements appear little reliable in the tropical troposphere except those of SAGE II (and eventually SAGE III), though low biased by 50% and of limited
20
(50%) precision.
1 Introduction
Because of the many dynamical and chemical processes involved, i.e. quasi-horizontal transport from mid-latitude, convective uplift from the surface, photochemical pro-duction by precursors, and potential destruction by very short lived species such
25
ACPD
6, 10087–10152, 2006 Evaluation of satellite O3 measuring instruments F. Borchi and J.-P. Pommereau Title Page Abstract Introduction Conclusions References Tables Figures J I J I Back CloseFull Screen / Esc
Printer-friendly Version
Interactive Discussion
in the tropical upper troposphere/lower stratosphere (UT/LS) and particularly in the Tropopause Tropical Layer (TTL) is a prerequisite for understanding possible climatic and long term ozone changes in the future. However and although long series of ozone profile measurements are available for long from space-borne instruments such as SAGE II since 1984 (Mauldin et al., 1985), HALOE since 1992 (Russell et al., 1993),
5
complemented by the SHADOZ tropical ozonesonde network since 1998 involving now eleven stations (Thompson et al., 2003), the ozone distribution and its variations are still poorly characterised in the TTL. This is because of the many limitations of remote sensing observations from orbit in tropical areas such as increased Rayleigh atmo-spheric attenuation, high altitude clouds, low temperature, high humidity and dense
10
aerosols and for ozonesondes, their necessarily limited number. For example, a 8-year intercomparison between HALOE and SAGE II still shows an unexplained bias with HALOE ozone low relative to SAGE II by 5–20% below 22 km between 40◦S and 40◦N and a root-mean square difference between the two data sets of >15% (Morris et al., 2002). Another example is the 40–60% low bias of SAGE II ozone in the upper
trop-15
ical troposphere compared to ozonesondes reported by Kar et al. (2002) and Wang et al. (2002), attributed by these authors to the high sensitivity of the retrieved ozone abundance to the background (electronic offset) of the SAGE II channel.
More recently, the relative performances of SAGE II, HALOE and the SHADOZ ozonesondes in the tropics have been studied by comparison with accurate
measure-20
ments of a SAOZ UV-Visible spectrometer carried by long duration balloons flown in 2001 and 2003 at 20◦S (Borchi et al., 2005). The agreement with SAOZ was found excellent in the stratosphere (2% precision,+2–4% ozone bias, +150 m altitude bias for SAGE II; 4% precision, <1% ozone bias, <100 m altitude bias for HALOE; and 5 % precision, –4% bias and +300 m in altitude for the sondes), but degrading rapidly for
25
the two space-borne instruments, below 22 km (–40% at 18 km) for HALOE, and below 19 km for SAGE II, displaying a low bias of 50–60% compared to SAOZ in the upper tro-posphere. The comparison between SAOZ and the ozonesondes in the troposphere is less conclusive. Indeed, the SAOZ ozone concentrations were found comparable with
ACPD
6, 10087–10152, 2006 Evaluation of satellite O3 measuring instruments F. Borchi and J.-P. Pommereau Title Page Abstract Introduction Conclusions References Tables Figures J I J I Back CloseFull Screen / Esc
Printer-friendly Version
Interactive Discussion
those of the sondes at Reunion Island but systematically high biased by 50–60% at Samoa and Fiji in the Western Pacific. Asides from differences of instrumental arrange-ments a possible explanation could be the frequent occurrence of near zero ozone lay-ers in convective clouds over the South Pacific Convergence Zone (SPCZ) because of the ozone destruction at the surface of the ocean (Kley et al., 1996), which could
5
not be seen by SAOZ limited by definition to cloud free areas. A possible systematic overestimation of tropospheric ozone by remote sensing systems was thus suggested over convective areas.
Since 2001, a number of new ozone measuring space instruments have been put into orbit: the Limb viewing visible OSIRIS (Optical Spectrograph and Infrared
Im-10
ager System) (Warshaw et al., 1996; Llewellyn et al., 1997) and the Limb observing SMR (Sub-Millimetre Radiometer) (Murtagh et al., 2002) both aboard the Swedish-Finish-Canadian-French ODIN satellite launched in February 2001; the NASA SAGE III UV-Vis-near IR spectrometer aboard METEOR III in December 2001 operating by moon occultation in the tropics (McCormick et al., 1991); and finally the ESA ENVISAT
15
satellite in March 2002 carrying the GOMOS (Global Ozone Monitoring by Occultation of Stars) stellar occultation (Bertaux et al., 1991; Bertaux et al., 2001) and the limb viewing SCIAMACHY (SCanning Imaging Absorption spectrometer for Atmospheric CHartographY) UV-Vis spectrometers (Burrows and Chance, 1991; Bovensmann et al., 1999) and the Infra-red Limb viewing MIPAS (Michelson Interferometer for Passive
20
Atmospheric Sounding) (Fischer and Oelhaf, 1996; Harris, 2000).
The objective of the present paper is the evaluation of the performances of all the above systems with the method applied already by Borchi et al. (2005), with the data of the 9-day SAOZ flight of February 2003 and those of a new 39-day flight carried in February–April 2004 in the frame of a HIBISCUS project of the European Union
25
dedicated to the study of the impact of convection on the stratosphere.
Section 2 provides a brief description of the SAOZ system and the long duration bal-loon flights performed in 2003 and 2004, and a recall of the technique developed for de-riving the relative contributions of horizontal and vertical transport and measurements
ACPD
6, 10087–10152, 2006 Evaluation of satellite O3 measuring instruments F. Borchi and J.-P. Pommereau Title Page Abstract Introduction Conclusions References Tables Figures J I J I Back CloseFull Screen / Esc
Printer-friendly Version
Interactive Discussion
errors from the observed ozone zonal variability. Section 3 describes the performances of each ozone measuring system, altitude registration, ozone bias and precision, rel-ative to those of SAOZ: HIBISCUS ozonesondes at Bauru and at the three SHADOZ stations over flown by the balloons, HALOE, SAGE II and III, Odin-OSIRIS and -SMR, and ENVISAT-GOMOS, -SCIAMACHY and -MIPAS. Section 4 provides a comparison
5
of the relative performances of each of them. Finally, the conclusions of the study are summarised in Sect. 5.
2 SAOZ ozone profiles in the tropics
SAOZ is a balloon borne diode array UV-Visible spectrometer for remote O3and NO2 observations by solar occultation (Pommereau and Piquard, 1994). In the present
10
application it was flown aboard long duration Infra-Red Montgolfier (MIR) balloons op-erated by the Centre National d’Etudes Spatiales (CNES). The data used here are those of two flights launched from Bauru at 22◦S in Brazil during the SH summer sea-son in February–March 2003 and 2004, similar to the 34-day flight already carried in 2001 (Borchi et al., 2005). The first in 2003 lasted for 9 days at about 20◦S across the
15
Pacific before being brought down by a hurricane over the Coral Sea, while the second in 2004 flew for 39 days for one and half circumnavigation between 20◦S and 9◦S. 2.1 MIR SAOZ balloon flight in 2003 and 2004
Ozone profiles are obtained by solar occultation in the visible Chappuis bands in the 450–620 nm spectral range. The spectral are analysed by the differential optical
ab-20
sorption technique (DOAS). The profiles are retrieved by onion peeling, after calculat-ing the light path by ray traccalculat-ing. Compared to a satellite, the advantage of a balloon moving slowly is to allow the exposure to vary from 0.5 s to 52 s for compensating the strong increase of attenuation at low tangent height, allowing the measurements to be continued down to cloud top or to about 6 km in clear conditions. A description of
ACPD
6, 10087–10152, 2006 Evaluation of satellite O3 measuring instruments F. Borchi and J.-P. Pommereau Title Page Abstract Introduction Conclusions References Tables Figures J I J I Back CloseFull Screen / Esc
Printer-friendly Version
Interactive Discussion
the SAOZ instrument (300–650 nm range, 1.1 nm resolution, 3 pixels over-sampling) is given in Borchi et al. (2005). Although very similar in most aspects, the SAOZ payload flown in 2004 was using a slightly different spectrometer extended to 1000 nm for the measurement of water vapour around 940 nm (400–1000 nm range, 1.2 nm resolution, 1.7 pixels over-sampling). However, the change has no impact on ozone
measure-5
ments in the broad (30 nm large) Chappuis bands features. The altitude is a geometric altitude. Its accuracy is directly related to that of the GPS 3-D location and clock (±10 m and 0.1 s) from which the SZA at the location of the balloon and then the tangent height are derived. The vertical resolution of the measurements is 1.4 km corresponding to the half-width of the solar disk brightness. Concentrations are retrieved in 1 km thick
10
atmospheric shells. Pressure and temperature are those of the ECMF (European Cen-tre for Medium-range Weather Forecasts) operational analyses (6 h, T106, 2◦×2◦, 60 levels) at the location of the tangent point. Finally, data contaminated by clouds are removed by looking at the atmospheric extinction at 615 nm.
The performance of the SAOZ retrievals has been estimated by comparison with
15
stratospheric and tropospheric ozone lidar observations as well as ozonesondes during an overpass of a SAOZ-MIR over the NDSC station of Reunion Island in the Indian Ocean in 2001. The precision of ozone concentration is estimated to better than 2% in the stratosphere (3.5% accuracy) and 5–6% in the troposphere (respectively 12% and 25% accuracy at 15 km and 10 km), while the error on altitude registration is <50 m
20
(Borchi et al., 2005).
The data used here are those obtained during two flights at the tropics launched from Bauru, Brazil (22◦S, 49◦W), the first on 23 February 2003 for the preparation of the HIBISCUS campaign, and the second on 26 February 2004 during the following main campaign (http://www.aerov.jussieu.fr/projet/HIBISCUS/). The first lasted for 9
25
days only, at almost constant latitude (22◦±1◦S), providing 11 useful profiles across the Pacific before being lost over a hurricane. The second lasted for 39 days, resulting in 70 useful profiles (roughly half at sunrise, half at sunset) between 9◦S and 21◦S, before falling over the Pacific Convergence Zone. The trajectories of the balloons in
ACPD
6, 10087–10152, 2006 Evaluation of satellite O3 measuring instruments F. Borchi and J.-P. Pommereau Title Page Abstract Introduction Conclusions References Tables Figures J I J I Back CloseFull Screen / Esc
Printer-friendly Version
Interactive Discussion
the summer stratospheric Easterlies and the ozone profiles recorded along the flights at sunset and sunrise, are shown in Fig. 1. Only the first thirty-one profiles of 2004 within the 15–21◦S latitude range are being used in this study which could be readily compared with those observed within 15–25◦S in 2001 and 20–23◦S in 2003 (Borchi et al., 2005).
5
2.2 Ozone variability along a latitudinal circle
The zonal variability of ozone concentration along the flights in 2001, 2003 and 2004 is shown in Fig. 2 (relative standard deviation in percent on the left, standard deviation in number density on the right). The ozone concentration along the flight is almost con-stant in the lower stratosphere, but highly variable in the upper troposphere between 12
10
and 20 km. In the stratosphere, above 20 km, the figures are very similar on the three years showing little variability (<5%), but increasing rapidly below 20 km, reaching a maximum of 45% in 2001 and 35% in 2004 at 14 km and then decreasing at lower altitude. The picture is slightly different in 2003 over the Pacific only where ozone is less variable below the tropopause at about 15 km, but a little larger around 18–19 km
15
because of the upwelling of the ozone profile over the hurricane Erika (Fig. 1).
A statistical method based on a multi-regression analysis has been proposed by Borchi et al. (2005) for removing the impact of horizontal and vertical transport, result-ing in a residual variability indicative of the measurement precision. The proxy used for horizontal transport is potential vorticity (PV) on isentropic surfaces provided by
20
MIMOSA high-resolution contour advection model initialised with ECMWF wind fields (Hauchecorne et al., 2002), interpolated at the location of the SAOZ tangent points. The proxy for vertical transport, also provided by ECMWF operational analyses, is the altitude difference between 370 K and 340 K isentropic levels.
For removing the impact of longitudinal change of altitude of isentropic surfaces,
25
ozone concentrations at geometric altitude are first converted in mixing ratios on isen-tropic surfaces. The impact of quasi-horizontal transport is then evaluated by correlat-ing ozone changes and PV. The zonal variability of ozone due to horizontal transport
ACPD
6, 10087–10152, 2006 Evaluation of satellite O3 measuring instruments F. Borchi and J.-P. Pommereau Title Page Abstract Introduction Conclusions References Tables Figures J I J I Back CloseFull Screen / Esc
Printer-friendly Version
Interactive Discussion
∆O3θ was calculated using Eq. 1: ∆O3θ = αθ×∆PVθ
where∆PVθ is the zonal variability of potential vorticity and αθ the slope of the linear regression between SAOZ ozone and MIMOSA PV, at a θ isentropic level. The cal-culation is made on 16 isentropic levels between 335 and 650 K, corresponding to a
5
vertical resolution of ∼500–700 m. The impact of vertical transport is then evaluated by correlating the altitude difference between 370 K and 340 K using an equation similar to (1). The results of the regression analysis applied to the SAOZ measurements in 2001, 2003 and 2004 are shown in Fig. 3. The left panel shows the residual variability after each step of calculation: (a) number density at geometric levels; (b) mixing ratio
10
on isentropic surface; (c) after removal of horizontal transport (PV) and (d) residual after removing also vertical transport. The right hand of Fig. 3 displays the relative per-cent contributions of horizontal and vertical transport. The results are very similar for the two circum-navigating flights in 2001 and 2004 displaying a 60–70% contribution of horizontal transport between 10 and 20 km, and a smaller impact of vertical transport
15
of 15–25% only between 13 and 20 km. The signature of vertical transport is insignifi-cant over the limited area of the Pacific in 2003 where horizontal transport is explaining most of variability. If the residual variability, which may still include some contribution from ozone photochemical production, is adopted as an indicator of random error, the precision of SAOZ ozone measurements would be 2% in the stratosphere, 5–6% at
20
the tropopause and 7–8% at 12 km in the upper troposphere. Since the contribution of vertical transport is limited, it will be ignored in the following comparisons with sonde and satellites.
3 Evaluation of relative performances of other systems
A number of ozone profiles within the latitude range and during the period of the MIR
25
ACPD
6, 10087–10152, 2006 Evaluation of satellite O3 measuring instruments F. Borchi and J.-P. Pommereau Title Page Abstract Introduction Conclusions References Tables Figures J I J I Back CloseFull Screen / Esc
Printer-friendly Version
Interactive Discussion
performed at Bauru during HIBISCUS, from three NASA space instruments, HALOE, SAGE II and III respectively aboard UARS, ERBS and METEOR 3M, from the two OSIRIS and SMR instruments aboard ODIN, and from GOMOS, SCIAMACHY and MIPAS aboard ENVISAT. The performances of each have been studied by comparison with SAOZ after adaptation of vertical resolution by smoothing that of higher resolution,
5
i.e. sondes of 50 m sampling or SAOZ for 2–3 km broad satellite limb viewing resolution. The mathematical background used in this section is given in appendix A.
3.1 Ozonesondes
A first statistical comparison between SHADOZ ozonesondes (Borchi et al., 2005) at Samoa, Fiji and Reunion Island and SAOZ-MIR flights carried in February and March
10
2001 and 2003 concluded at (i) a small systematic altitude shift up of the sondes by 300 m consistent with the known 40–50 s time constant of the Electrochemical Con-centration Cell (ECC) on a balloon ascending at 5–6 m/s (SPARC, 1998, Johnson et al., 2002); (ii) an average relative ozone low bias of 4±1% in the stratosphere between 20 and 26 km, and (iii) a 5% precision. As already explained at lower altitude in the
15
upper troposphere, the SAOZ measurements were found comparable with those of the sondes at Reunion Island but systematically high biased by 50–60% compared to the ascents of Samoa and Fiji in the high clouds area of the South Pacific Convergence Zone (SPCZ) suggesting a systematic high bias in remote sensing measurements in oceanic convective clouds areas. This problem has been revisited in 2004 by dedicated
20
ozonesondes ascents during the pass of the balloon over the stations. 3.1.1 Ozonesondes at Bauru and at three SHADOZ stations in 2004
The data used here are those of thirteen ozonesondes ascents performed by IPMet and the Danish Meteorological Institute (J. Nielsen and N. Larsen, personal communi-cation) from Bauru during the HIBISCUS campaign in February and March 2004 and
25
ACPD
6, 10087–10152, 2006 Evaluation of satellite O3 measuring instruments F. Borchi and J.-P. Pommereau Title Page Abstract Introduction Conclusions References Tables Figures J I J I Back CloseFull Screen / Esc
Printer-friendly Version
Interactive Discussion
Samoa (14.2◦S, 171◦W) and Fiji (18.1◦S, 178◦E) in the Western Pacific (S. Oltmans, personal communication) and Reunion Island (21◦S, 55.5◦E) in the Indian Ocean (F. Posny, personal communication). For statistical studies several other ascents at the three stations between 23 February and 31 March, 2004 available from the SHADOZ database (http://croc.gsfc.nasa.gov/shadoz/), have been added. All ozonesondes are
5
ECC (Electrochemical Concentration Cell) but of various types, i.e. SPC 6A, 2% un-buffered KI solution at Fiji and Samoa, ENSCI Z 0.5% buffered at Reunion, and partly SPC 6A partly ENSCI both 1% buffered at Bauru, and using in addition different cor-recting factors for pump efficiency. In the following, ozone partial pressure is converted into number density using the radiosonde pressure and temperature. The altitude is a
10
geopotential height derived from the pressure sensor of the sonde. Since the sonde sampling is 50 m higher than that of SAOZ, the sonde data have been smoothed with a binomial filter to match the SAOZ resolution of 1.4 km, and then linearly interpolated to 1 km steps.
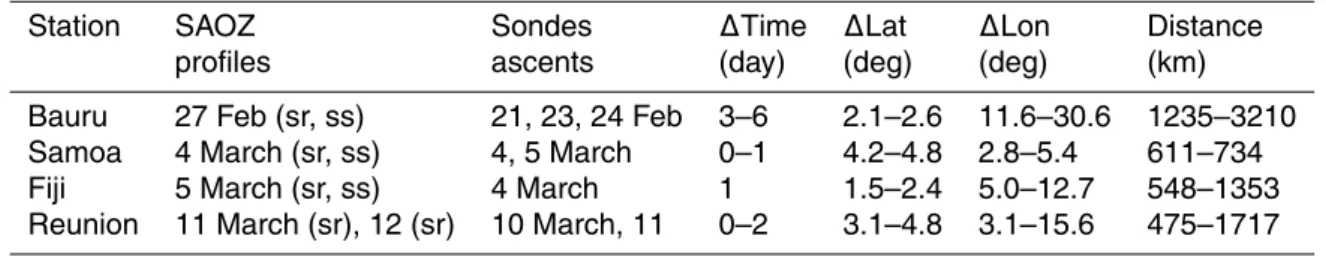
The circumstances of the ozonesondes ascents and the SAOZ measurements are
15
displayed in Table 1. Though the MIR passed close to the stations, the observations are always separated by more than 475 km in distance. In addition, at several occa-sions, the SAOZ measurements at the closest distance were limited to altitude levels above the tropopause at 16–17 km because of the presence of high clouds over the Western Pacific and near Bauru over the South Atlantic Convergence Zone. Even
20
more difficult to interpret are the SAOZ measurements of Reunion Island close to a powerful Gafilo cyclone present over the area on 2–17 March which prevented lidar ob-servations during the period. Indeed, the temperature and ozone profiles of 10 March and 11 March ascents display a large upwelling and cooling of the tropopause com-pared to the monthly average, and at the opposite, an increase of ozone in the lower
25
stratosphere highly correlated with a PV increase indicative of strong advection from mid-latitude.
ACPD
6, 10087–10152, 2006 Evaluation of satellite O3 measuring instruments F. Borchi and J.-P. Pommereau Title Page Abstract Introduction Conclusions References Tables Figures J I J I Back CloseFull Screen / Esc
Printer-friendly Version
Interactive Discussion
3.1.2 SHADOZ statistical comparison in the stratosphere
Twelve ascents are available between 23 February and 31 March 2004 at Samoa (14.2◦S, 171◦W), Fiji (18.1◦S, 178◦W) and Reunion Island (21◦S, 55.5◦E), ignoring those of 10 and 11 February at the latter station because of the cyclone.
The sondes and SAOZ mean profiles, percent difference and relative variability are
5
displayed in Fig. 4. The analysis confirms the results of 2001 and 2003 displaying a shift up by some 200 m of the sondes compared to SAOZ, and a 4% precision. But, after adjustment for the altitude shift, the average relative O3bias of+1.5% in 2004 is different from the –4% of 2001. The possible significance of such difference derived from comparisons with 12 ascents in 2004 and 19 in 2001 of different instrumental
10
arrangement and data processing software, is difficult to access. All which can be safely concluded is that the differences remain within the ±5% accuracy quoted for the SHADOZ sondes (Thompson et al., 2003).
3.1.3 Individual overpass comparisons in the troposphere
On average as shown in Fig. 4, the SAOZ profiles are high biased by some 50% in
15
the troposphere compared to the sondes. But given the high variability of tropospheric ozone concentration, this is of little meaning. A better approach is to look at collocated profiles above individual stations. The comparison between sondes and SAOZ profiles over each station is displayed in Fig. 5 and the results of the analysis are summarized in Table 2. In the troposphere, the results confirm the analysis of 2001 and 2003
20
displaying for the two Pacific stations, a high bias of some 30% of SAOZ compared to the sondes, even for the closest MIR overpass 611/734 kilometres at Samoa. However, a similar high bias of 26% is found at Reunion Island in 2004 in contrast to 1% in 2001. In that case, the difference might be partly attributed to a similar lift of low ozone air by the cyclone, which was not be seen by SAOZ more than 500 km west. Low or even zero
25
ozone layers as frequently reported by the sondes in convective regions have never been observed with the SAOZ whose measurements are limited to cloud free areas.
ACPD
6, 10087–10152, 2006 Evaluation of satellite O3 measuring instruments F. Borchi and J.-P. Pommereau Title Page Abstract Introduction Conclusions References Tables Figures J I J I Back CloseFull Screen / Esc
Printer-friendly Version
Interactive Discussion
Although differences of technical arrangements could certainly contribute to differences between ozonesonde stations (e.g. the data processing software of Reunion Island was changed in 2003 for the NOAA/CMDL system), the results of 2004 support the idea of a possible systematic overestimation of average tropospheric ozone in the tropics by remote sensing instruments because of the absence of measurements in the presence
5
of clouds. 3.2 HALOE
The HALogen Occultation Experiment (HALOE) aboard the Upper Atmosphere Re-search Satellite (UARS) launched in September 1991 and still in operation, performs solar occultation measurements to infer high resolution mixing ratio profiles of trace
10
gases (Russell et al., 1993). Ozone measurements are carried out in a broadband channel centred at 9.6 µm. The geometry of the UARS orbit (57◦inclination, circular at 585 km with orbit period of 96 min) results in about 15 sunrises and 15 sunsets daily, with tangent point locations during a day confined to small latitude bands, different for the two events, which cycle over varying extremes, roughly every 36 days. Tangent
15
heights are derived from a solar edge detection system. The error estimates pro-vided in the HALOE data files include random components due to noise and altitude dependent quasi-systematic errors due to uncertainties in aerosol corrections. They vary from about 5–10% in the middle and upper atmosphere, to about 30% at 100 hPa (Bhatt et al., 1999). The vertical resolution of 2 km of HALOE profiles is close to that of
20
SAOZ, and the sampling 0.3 km.
A first comparison between HALOE v19 and SAOZ in 2001 and 2003 at the Southern Tropics at 20◦±5◦S during the SH summer (Borchi et al., 2005) showed an insignificant ozone bias in the stratosphere between 22 and 26 km of+1% to –0.7% depending on the year and the event, a small altitude shift up by 100 m and a precision of 4%.
How-25
ever, the agreement was observed to degrade rapidly below 22 km, where increasing differences with SAOZ, as well as decreasing precision, were reported.
ACPD
6, 10087–10152, 2006 Evaluation of satellite O3 measuring instruments F. Borchi and J.-P. Pommereau Title Page Abstract Introduction Conclusions References Tables Figures J I J I Back CloseFull Screen / Esc
Printer-friendly Version
Interactive Discussion
3.2.1 HALOE data selection
The data in use here are those of version 19 of the retrieval algorithm available on the HALOE websitehttp://haloedata.larc.nasa.gov/. The data selected are a series of measurements on 15 consecutive orbits during or as close as possible to the balloon flight period within the latitudinal range 15–21◦S. The closest available in 2004 are 15
5
sunrise profiles within 14.9–20.9◦S on 11–12 February before the launch of the balloon on 26 February. There is no sunset measurement available during the flight period nor sunrise profiles in March within 15–21◦S. The HALOE products available in the data files are ozone mixing ratios on altitude levels. Since the SAOZ measured quantity is a number density, the HALOE mixing ratios data have been converted in concentrations
10
using NCEP (National Center for Environmental Prediction) pressure and temperature also provided in the data files. Finally, since the HALOE vertical resolution is close to that of SAOZ and provides every 300 m, the data have been just linearly interpolated to the SAOZ 1 km altitude grid.
3.2.2 Comparison with SAOZ
15
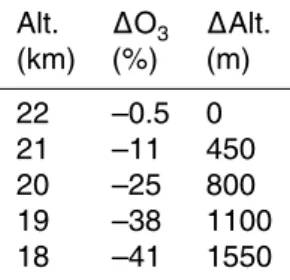
The comparisons between HALOE and SAOZ ozone mean profiles, difference, and relative variability, are displayed in Fig. 6 and the results of the analysis for the strato-sphere between 22 and 26 km are summarised in Table 3. Above 22 km, the HALOE mean profile shows a small altitude shift up by 200 m and a limited ozone high bias of 1.8% after adjustment for the altitude shift. After removing the contribution of horizontal
20
transport by correlation with PV (Eq. 1), the residual variability or precision (in red in the plots) is 3.4% between 22 and 26 km, which is slightly larger than the 1.5 % of SAOZ. However, as in 2001 and 2003, the difference between HALOE and SAOZ increases rapidly below 22 km reaching 1550 m in altitude or 41% in number density at 18 km (Table 4), below which the HALOE data appear little reliable.
25
The comparison with SAOZ in 2004 fully confirms the results of 2001 and 2003. The altitude shift up by 100–200 m in the lower stratosphere is a well-known feature of
ACPD
6, 10087–10152, 2006 Evaluation of satellite O3 measuring instruments F. Borchi and J.-P. Pommereau Title Page Abstract Introduction Conclusions References Tables Figures J I J I Back CloseFull Screen / Esc
Printer-friendly Version
Interactive Discussion
HALOE (SPARC, 1998), thought to be due to a bias in the detection of the top edge of the sun in the presence of heavy aerosol or cirrus clouds, particularly in the tropics. The 1.8±1.6% ozone high bias between 22 and 26 km is comparable to the+1/–0.7% difference observed in 2001/2003 at both sunrise and sunset. Finally, the increasing difference between the two systems below 22 km is very similar on the three years. The
5
results are very consistent with the 8% and 33% low ozone bias of HALOE relative to SAGE II (Eq. 5 in Appendix A) at respectively 20 and 22 km and the systematic zonal mean root-mean-squares difference of about 20% at 20 km and 35% at 18 km at 20◦S reported by Morris et al. (2002), but for which no satisfactory explanation was provided for that. The only piece of information we could add here is that it very likely comes
10
from HALOE since nothing similar could be seen between SAOZ and all other systems, including SAGE II v6.0, as described in the following sections. However, the still open question is to know if it is resulting from an underestimation of the ozone mixing ratio or a progressively growing error in the HALOE altitude registration.
3.3 SAGE II
15
The Stratospheric Aerosols and Gas Experiment II (SAGE II) aboard the Earth Radia-tion Budget Satellite (ERBS) launched in October 1984 and still operaRadia-tional, utilizes the solar occultation method to retrieve ozone, water vapour, aerosols and NO2 (Mauldin et al., 1985). ERBS orbits the Earth along a circular path at an altitude of 610 km with an inclination of 56◦ allowing the measurement of 15 sunset or sunrise profiles every
20
month at a given tropical latitude. Ozone is retrieved in a channel centred at 600 nm in the Chappuis bands (Cunnold et al., 1989) using cross-sections of Shettle and Ander-son (1994). The vertical resolution is ∼1 km and the altitude sampling 0.5 km. Tangent heights are calculated by a solar edge detection algorithm. The precision of the ozone measurements is estimated to 1% in the middle stratosphere (2.5% accuracy),
de-25
grading to about 2% near the stratopause and the tropopause and to higher values in regions of very low ozone (Manney et al., 2001).
South-ACPD
6, 10087–10152, 2006 Evaluation of satellite O3 measuring instruments F. Borchi and J.-P. Pommereau Title Page Abstract Introduction Conclusions References Tables Figures J I J I Back CloseFull Screen / Esc
Printer-friendly Version
Interactive Discussion
ern Tropics at 20◦±5◦S during the SH summer (Borchi et al., 2005) showed a relative ozone high bias of 2–4% in the stratosphere between 20 and 26 km, a small altitude shift up by 100–200 m and a 2% precision. In the troposphere, the comparison showed a systematic 50–60% low bias of SAGE II with a precision of about 40–60%, very con-sistent with that found between SAGE II and ozonesondes by Kar et al. (2002) and
5
Wang et al. (2002), and attributed by these authors to the high sensitivity of the re-trieved ozone abundance to the background (electronic offset) of the SAGE II channel. 3.3.1 SAGE II data selection
The data in use here are those of version 6.2 of the retrieval algorithm available on the SAGE websitehttp://www.sage2.larc.nasa.gov. Eleven SAGE II sunset profiles within
10
15.4–19.7◦S on 20–21 March 2004 are available for comparison with SAOZ. There is no sunrise measurement during the balloon flight period. Since the SAGE II products are number densities at geometric altitude on a vertical resolution closed to that of SAOZ and a 500 m altitude sampling, they have been compared directly to SAOZ by just selecting the data at the 1 km SAOZ grid.
15
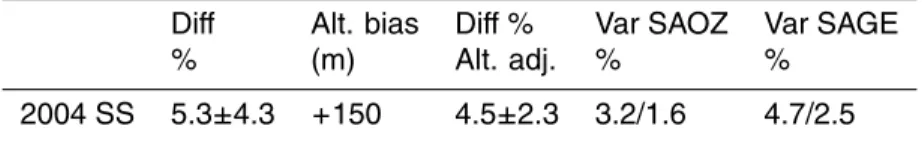
3.3.2 Comparison with SAOZ
The comparison between SAGE II and SAOZ in 2004 is displayed in Fig. 7 in the same format as for HALOE and the results are summarised in Table 5. The SAGE II mean profile shows a small altitude shift up by 150 m and an ozone high bias of 4.5% in the stratosphere after adjustment for the altitude shift. In the stratosphere above
20
20 km, the 2.5% precision of SAGE II estimated from the variability after subtracting the contribution of transport is of the same order of the 1.6% found for SAOZ. Unfortunately, only one profile is available between 15.5 and 18 km, thus little could be said in 2004 on SAGE II performance in the troposphere.
These findings fully confirm previous SAGE II performances estimations. The
alti-25
ACPD
6, 10087–10152, 2006 Evaluation of satellite O3 measuring instruments F. Borchi and J.-P. Pommereau Title Page Abstract Introduction Conclusions References Tables Figures J I J I Back CloseFull Screen / Esc
Printer-friendly Version
Interactive Discussion
II, thought to be due to a bias in the solar edge detection algorithm in the presence of a strong gradient in the 1020 nm extinction profile (SPARC, 1998). The small SAGE ozone high bias is consistent with the 2% smaller absorption cross-sections in use in the SAGE retrieval compared to that of SAOZ (Bazureau, 2001). Finally, the compara-ble precision of the SAGE broadband channels and the SAOZ spectral measurements
5
suggests that aerosol and Rayleigh attenuations are efficiently removed in the SAGE v6.2 retrieval algorithm.
3.4 SAGE III moon occultation
The Stratospheric Aerosol and Gas Experiment III (SAGE III) was launched into a sun-synchronous orbit aboard the Russian Meteor 3M platform in December 2001
(Mc-10
Cormick et al., 1991). SAGE III adds solar and lunar occultation and limb modes. Lunar occultation, the only one available in the tropics, provides profiles of ozone, ni-trogen dioxide, nini-trogen trioxide, and chlorine dioxide. The hardware configuration of the SAGE III instrument is significantly different from either SAGE I or SAGE II. SAGE III, a grating spectrometer measuring ultraviolet, visible and near infrared radiances
15
from 280 to 1040 nm, builds on and improves on the previous experiments by including additional wavelength, allowing better O3measurements at lower altitude (Thomason et al., 1999). Because of the spatial and spectral non-uniformity of the lunar albedo, the variation in lunar illumination as a function of lunar phase, and the moon’s rela-tively low brightness, the lunar altitude registration is much more difficult than that of
20
the sun (SAGE III ATBD, 2002). Tangent heights are derived using a radiometric model of the moon for predicting the radiometric center different from the geometric center in the case of the moon. Below 50 km, ozone is retrieved in the Chappuis bands using cross-sections of Shettle and Anderson (1994). The precision of O3 profiles in lunar occultation mode is about 10% between 16 and 35 km. More details could be found in
25
the SAGE III Algorithm Theoretical Basis Document: Solar and Lunar Algorithm (2002). The vertical resolution is 500 m.
ACPD
6, 10087–10152, 2006 Evaluation of satellite O3 measuring instruments F. Borchi and J.-P. Pommereau Title Page Abstract Introduction Conclusions References Tables Figures J I J I Back CloseFull Screen / Esc
Printer-friendly Version
Interactive Discussion
3.4.1 SAGE III moon data selection
The data in use here are those of version 3 of the retrieval algorithm available on the SAGE III websitehttp://www.sage3.larc.nasa.gov. Four profiles could be found in 2004 close to the latitude and time of the SAOZ flights (Table 6). No collocated data were available for 2003. Since the SAGE III products are ozone number densities
5
at geometric height of 500 m resolution every 500 m, they have been smoothed and linearly interpolated to the SAOZ 1 km grid.
3.4.2 Comparison with SAOZ
The comparison between SAGE III and SAOZ is displayed in Fig. 8 and the results in Table 7. The SAGE III mean profile shows a large shift down by 550 m, but after
10
adjustment for this altitude shift the ozone bias in the stratosphere drops to 2.5%. Above 20 km and without removing the contribution of horizontal transport (only four selected profiles), the variability of the concentration is 4.5% suggesting a precision of the same order of that of SAGE II. But remarkably and in contrast to SAGE II, the bias and precision hold down to the lowest altitude of the measurements at 15 km.
15
Likely because of the larger uncertainty of the lunar altitude registration compared to the sun, the SAGE III altitude bias is larger than that of SAGE II. However, the small ozone high bias is similar to that observed between SAGE II and SAOZ, consistent with the 2% smaller absorption cross-sections in use in both retrievals compared to that of SAOZ (Bazureau, 2001). Finally, the variability of 4.5% derived from this study, close to
20
that of SAOZ, is slightly better than the 10% estimated by the SAGE III ATBD (2002), although the small number of profiles available for comparison do not allow deriving definite conclusions on this aspect.
ACPD
6, 10087–10152, 2006 Evaluation of satellite O3 measuring instruments F. Borchi and J.-P. Pommereau Title Page Abstract Introduction Conclusions References Tables Figures J I J I Back CloseFull Screen / Esc
Printer-friendly Version
Interactive Discussion
3.5 Odin-OSIRIS
The Swedish/Canadian/French/Finish Odin satellite was launched on 20 February 2001 into a circular quasi-polar orbit at 600 km. Detailed information on Odin and its mission could be found in Murtagh et al. (2002) and Llewellyn et al. (2003). Odin carries two co-aligned instruments: a Sub-Millimeter Radiometer (SMR) and an Optical
5
Spectrograph and Infrared Imager System (OSIRIS), both enable to scan the Earth’s limb with tangent heights ranging from about 10 to 70 km. The OSIRIS spectrograph measures scattered sunlight within a field of view of 1.288 arc minute in the vertical di-rection, equivalent to ∼1 km height at the tangent point. Ozone number density profiles are retrieved from the OSIRIS limb radiance spectra in the Chappuis absorption bands
10
between 10 and 50 km on a 2 km grid, using the inversion technique suggested by Flit-tner et al. (2000) and McPeter et al. (2000) and adapted to OSIRIS by von Savigny et al. (2003). The vertical resolution is 2 km. The absorption cross-sections are those of Burrows et al. (1999). Tangent heights are calculated from the viewing direction pro-vided by a star tracker and the orbitography of the satellite. The overall accuracy of
15
an individual profile is estimated to be better than 10% within the 15 to 35 km altitude range (von Savigny et al., 2003).
Comparison with 1220 POAM III profiles and 205 ozonesondes (with a much broader latitudinal range in the both Hemisphere) during the 12 month period from November 2001 to October 2002 showed an ozone high bias ranging from 5–7% for altitudes
20
between 15 and 32 km and a strong altitude low bias of about 1 km during the April-July period for which no clear explanation has been provided yet (Petelina et al., 2004). The random error of 100–300 m at the tangent point was found too small for accounting alone for the offset. The cause was suggested to be presumably due to other altitude registration issues such as misalignment or shift of the optical axis of the instrument in
25
respect to the star-tracker, although it is also possible that systematic errors within the current operational inversion algorithm, such as aerosol climatology, are adding to the problem (Petelina et al., 2004).
ACPD
6, 10087–10152, 2006 Evaluation of satellite O3 measuring instruments F. Borchi and J.-P. Pommereau Title Page Abstract Introduction Conclusions References Tables Figures J I J I Back CloseFull Screen / Esc
Printer-friendly Version
Interactive Discussion
3.5.1 Odin-OSIRIS data selection
The data in use here are those of version 2.3 of the retrieval algorithm available on the OSIRIS websitehttp://http://osirus.usask.ca/. Since the MIR travelled only over the Pacific in 2003, a sub-set of data has been built from orbits between 45◦W and 150◦E. Forty-six OSIRIS profiles within 19.6–24.5◦S between 15 February and 6 March are
5
available for comparison with SAOZ in 2003 and 42 within 15.0–20.9◦S between 22 February and 16 March in 2004. Since OSIRIS products are number densities every 2 km geometric height with a resolution close to that of SAOZ, the data have been just interpolated at the SAOZ 1 km grid.
3.5.2 Comparison with SAOZ
10
The comparison between OSIRIS and SAOZ in 2003 and 2004 is shown in Fig. 9 and the results summarised in Table 8. The OSIRIS mean profiles display an average alti-tude shift down by 300 m in 2003 over the Pacific and by 900 m in 2004 over the entire latitude band. After adjustment for this shift, the OSIRIS difference is found insignif-icantly high biased compared to SAOZ by 1–2% in the whole stratosphere down to
15
19 km in 2003 and 15 km in 2004. The precision above 20 km estimated from the vari-ability after correction for horizontal transport is 7.4% in 2003 and 4.7% in 2004, about 3 times worse than that SAOZ. But it degrades progressively below reaching 35% and 20% at 15 km respectively in 2003 and 2004. An important question is the weight in the results of the a priori profile used in the inversion at low altitude. According to
20
von Savigny et al. (2003), the retrieved concentrations should be quite insensitive to the a priori down to 18 km at low latitude. Overall, the results of the comparison with SAOZ are very consistent with previous evaluations of OSIRIS performances showing a relatively large low bias in altitude registration of unknown origin, but after adjustment for that, a very small 1–2% ozone bias compared to SAOZ, corresponding exactly to
25
the difference of absorption cross sections (Orphals et al., 2003). The 5% OSIRIS-ozonesondes mean difference in the 20–26 km altitude range derived from this study is
ACPD
6, 10087–10152, 2006 Evaluation of satellite O3 measuring instruments F. Borchi and J.-P. Pommereau Title Page Abstract Introduction Conclusions References Tables Figures J I J I Back CloseFull Screen / Esc
Printer-friendly Version
Interactive Discussion
very consistent with the 5–7% bias found by Petelina et al. (2004), both after OSIRIS altitude adjustment. The sum of the 1–2% systematic error and the 5–7% precision de-rived from the variability corrected for transport is even better than the 10% accuracy on individual profiles quoted by von Savigny et al. (2003). The only limitation is the increasing systematic errors in the upper troposphere due to the sensitivity of the
re-5
trievals to the a priori profiles. The information provided by the OSIRIS data degrades rapidly below 18 km in the tropics.
3.6 Odin-SMR
The Sub-Millimetre Radiometer (SMR) also aboard Odin employs 4 tuneable single-sideband Schottky-diode heterodyne receivers in the 485–580 GHz spectral range. In
10
aeronomy mode, various target bands are dedicated to observations of trace con-stituents relevant to stratospheric/mesospheric chemistry and dynamics such as O3, ClO, N2O, HNO3, H2O, CO, and isotopes of H2O and O3(Murtagh et al., 2002). Pro-file information is retrieved from the spectral measurements of a limb-scan by inverting the radiative transfer equation for a non-scattering atmosphere. A retrieval algorithm
15
based on the Optimal Estimation Method (Rodgers, 1976) has been adopted (Urban et al., 2004). In stratospheric mode, the instrument scans the limb between roughly 7 and 70 km in about 90 s. Tangent-heights are calculated from the satellite’s orbitogra-phy and the information of the star tracker. The altitude range of the ozone measure-ments in the 501.8 GHz band used here is 17–45 km with vertical resolution of about
20
2.5 km. The data are provided every 2 km. The precision for a single-scan is of the order of 20–25% (0.25–1.5 ppmv). The upper limit of systematic errors for O3 in the lower stratosphere is estimated to ∼1 ppmv (Urban et al., 2005).
The two comparisons available between SMR and independent data such as ozonesondes and MIPAS at different periods and locations showed a high O3 bias
25
ACPD
6, 10087–10152, 2006 Evaluation of satellite O3 measuring instruments F. Borchi and J.-P. Pommereau Title Page Abstract Introduction Conclusions References Tables Figures J I J I Back CloseFull Screen / Esc
Printer-friendly Version
Interactive Discussion
3.6.1 Odin-SMR data selection
The data in use here are those of version 222 of the retrieval algorithm available on the SMR websitehttp://ether.ipsl.jussieu.fr. Thirteen SMR profiles within 15.2–26.4◦S and 45◦W–150◦E (over the Pacific) are available on 18 February 2003 which could be compared to SAOZ and 189 at all longitudes within 15.3–20.7◦S between 22 February
5
and 20 March in 2004. The SMR products available in the data files are ozone-mixing ratios at altitude levels. Since the SAOZ measured quantity is a number density, the SMR data have been converted using ECMWF (European Centre for Medium-Range Weather Forecasts) average pressure and temperature at the SAOZ tangent locations. As the SMR vertical resolution is of 2.5 km the SAOZ data have been smoothed and
10
then compared to that of SMR on a 2 km grid. 3.6.2 Comparison with SAOZ
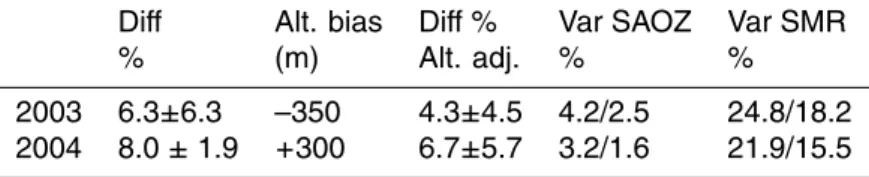
The comparisons between SMR and SAOZ in 2003 and 2004 are shown in Fig. 10 and the results summarised in Table 9. The SMR mean profiles display an average altitude shift down by 350 m in 2003 over the Pacific and up by 300 m in 2004 over the
15
entire latitude band. After adjustment for this shift, the SMR ozone is found high biased compared to SAOZ by 4.3% in 2003 (with only 13 profiles) and 6.7% in 2004 (with 189 profiles) between 20 and 26 km. The precision above 20 km estimated from the variability is 18.2% in 2003 and 15.5% in 2004, about 8 times worse than that SAOZ.
According to Urban et al. (2005), the altitude shift could be resulting from a scan-bias
20
assuming an uncertainty of 500 m. The 9% SMR high bias compared to the sondes is consistent with the 10% reported by Murtagh et al. (2002). The precision of 16– 17% derived from this study is slightly better than the 20–25% estimated by Urban et al. (2005). An important question here also is the weight of the a priori profiles used in the inversion at low altitude. According to Urban et al. (2004) and Urban et al. (2005)
25
retrieved concentrations should be quite insensitive to the a priori down to 19 km at low latitude. The SMR measurements should have thus little meaning below 19 km in the
ACPD
6, 10087–10152, 2006 Evaluation of satellite O3 measuring instruments F. Borchi and J.-P. Pommereau Title Page Abstract Introduction Conclusions References Tables Figures J I J I Back CloseFull Screen / Esc
Printer-friendly Version
Interactive Discussion
tropics.
3.7 ENVISAT-GOMOS
The Global Ozone Monitoring by Occultation of Stars (GOMOS) instrument aboard the ENVIronmental SATellite (ENVISAT) has been launched by the European Space Agency on 1 March 2002. ENVISAT is a sun-synchronous polar-orbiting satellite at
5
about 800 km altitude. GOMOS is a star occultation UV-visible-near IR spectrome-ter providing O3, NO2, NO3, H2O, aerosols and stratospheric clouds measurements, from 15 to 100 km for O3 and from 20 to 50–60 km for other constituents (Bertaux et al., 1991; Bertaux et al., 2001). Slant columns of all species are retrieved simultane-ously by global minimization of the mean squares difference between measured and
10
modelled transmissions. Below 40 km ozone is retrieved in the Chappuis bands us-ing cross-sections of Burrows et al. (1999). Tangent heights are calculated from the orbitography of the satellite. Since the light source is punctual and the location of the satellite and thus the direction of the star are very accurately known, the altitude registration of the measurements is better than ±50 m. Vertical profiles are derived
15
using an onion peeling inversion technique (Connor and Rodgers, 1988) assuming a linear variation of concentration between 2 layers. A Tikhonov regularization is further applied during the profile inversion for smoothing out unphysical oscillations that can appear on the vertical profiles due to atmospheric scintillation. The smoothing is result-ing in a degradation of the vertical resolution to 3 km. The vertical samplresult-ing is about
20
400–500 m. The data used in the following are those produced by a research retrieval algorithm (version v6.0b). Only nighttime measurements are considered.
Comparisons with balloon and ground-based measurements in the 19–64 km altitude range carried with the version v5.4b of the algorithm have suggested a small negative bias of 2.5–7.5%, within a relative standard deviation of 11–16% (Meijer et al., 2004).
25
Compared to SAGE II, the products of v6.0 have shown to display also a small negative bias of 0–5% between 21 and 52 km (Bracher et al., 2004).
ACPD
6, 10087–10152, 2006 Evaluation of satellite O3 measuring instruments F. Borchi and J.-P. Pommereau Title Page Abstract Introduction Conclusions References Tables Figures J I J I Back CloseFull Screen / Esc
Printer-friendly Version
Interactive Discussion
3.7.1 ENVISAT-GOMOS data selection
Fifteen GOMOS profiles within 18.4–25.1◦S and 45◦W–150◦E (over the Pacific) be-tween 26 February and 4 March in 2003 are available for comparison with SAOZ and 35 within 14.9–21.0◦S between 22 February and 20 March in 2004. Since the GOMOS products are number densities at geometric height, they could be compared directly to
5
SAOZ. Since the GOMOS vertical resolution is 3 km and the sampling 400–500 m, the SAOZ data have been smoothed and those of GOMOS linearly interpolated to the SAOZ altitude grid of 1 km.
3.7.2 Comparison with SAOZ
The comparisons between GOMOS and SAOZ in 2003 and 2004 are displayed in
10
Fig. 11 and the results summarised in Table 10. On both years, the mean profiles of the two instruments are very consistent above 22 km in the stratosphere showing no altitude shift within ±50 m and a small, little significant, low ozone bias of GOMOS of 1– 2.5 %. At these altitude levels, the only difference is in the worse precision of GOMOS of 3.1% over the Pacific only in 2003 and 6.1% over the full latitude belt in 2004 above
15
22 km, but degrading very rapidly below that level.
The absence of altitude shift between GOMOS and SAOZ is very consistent with the expectation of a star occultation system. The small low ozone bias is fully cor-responding to the difference of 2.5% between ozone absorption cross-sections used respectively by the two algorithms in the visible Chappuis bands (Orphals et al., 2003).
20
The 1% GOMOS low bias compared to SAGE II is consistent with the 0–5% reported by Bracher el al. (2004), both after altitude adjustment. The main limitation of GOMOS ozone measurements demonstrated by the comparison is the relatively large random error on individual profiles of ∼6% (one relative standard deviation) in the stratosphere above 22 km related to chromatic scintillation due to small-scale atmospheric
turbu-25
lence structures. Because of the fast increase of noise below 22 km, current GOMOS ozone products are of little use in the Tropical Tropopause Layer (TTL) and in the
tro-ACPD
6, 10087–10152, 2006 Evaluation of satellite O3 measuring instruments F. Borchi and J.-P. Pommereau Title Page Abstract Introduction Conclusions References Tables Figures J I J I Back CloseFull Screen / Esc
Printer-friendly Version
Interactive Discussion
posphere.
3.8 ENVISAT-SCIAMACHY
SCIAMACHY (SCanning Imaging Absorption spectroMeter for Atmospheric CHartog-raphY) is a satellite-borne instrument also aboard ENVISAT capable of performing spectroscopic measurements of the chemical composition of the Earth’s atmosphere
5
in three different observation geometries: nadir, solar/lunar occultation and limb scat-tering (Burrows and Chance, 1991; Bovensmann et al., 1999). The O3 limb profiles used here are derived by the Institute of Environmental Physics at University of Bre-men (IUP). The retrieval algorithm employed is similar to that developed by Flittner et al. (2000) and McPeters et al. (2000) for the Shuttle Ozone Limb Sounding Experiment
10
(SOLSE) also used for OSIRIS (von Savigny et al., 2003). The retrieval exploits the dif-ferential structure of the O3absorption cross sections, measured in the laboratory with the SCIAMACHY Flight Model, between the centre (600 nm) and the wings (525 nm and 675 nm) of the Chappuis absorption bands. A linearised version of optimal es-timation is used together with the radiative transfer model SCIARAYS (Kaiser, 2001)
15
to iteratively retrieve stratospheric O3 concentration profiles. The altitude range from about 15 km up to 40 km with vertical resolution of about 2.6 km can be covered with this technique as long as there are no clouds in the instrument’s field of view. The vertical sampling is about 3.3 km. Tangent heights are calculated from the viewing di-rection provided by a star tracker and the orbitography of the satellite. The instrumental
20
error is smaller than 1%, but retrieval errors due to errors in the assumptions of albedo, aerosol profile and background atmosphere are generally larger. Sensitivity studies have shown that these are the major systematic error sources and vary between 6% and 10% at 15–40 km altitude and around 6–7% between 20 and 25 km (Rozanov et al., 2003).
25
The SCIAMACHY v1.6 ozone profiles have been shown to be low biased by 10–15% for an unknown reason in the altitude range 20–35 km compared to HALOE, SAGE II and III, GOMOS, MIPAS, lidars and sondes, as well as shifted up by 1 to 2 km compare
ACPD
6, 10087–10152, 2006 Evaluation of satellite O3 measuring instruments F. Borchi and J.-P. Pommereau Title Page Abstract Introduction Conclusions References Tables Figures J I J I Back CloseFull Screen / Esc
Printer-friendly Version
Interactive Discussion
to all others (Bracher et al., 2005; Brinksma et al., 2005; Rozanov et al., 2003; Sergers et al., 2005). The altitude shift was identified to mainly result from pointing errors caused by an incorrect knowledge of the satellite orientation and/or position (Rozanov et al., 2003). A monthly mean tangent height offset of 800 m amplitude was identified before the improvement of the ENVISAT orbit propagator model in December 2003, but
5
a constant offset component of about 1 km is still presents after (von Savigny, 2005). 3.8.1 ENVISAT-SCIAMACHY data selection
The data in use here are those of the retrieval algorithm version 1.6 available on the IUP websitehttp://www.iup.physik.uni-bremen.de/scia-arc/. Forty-three SCIAMACHY pro-files within 15.9–24.8◦S and 45◦W–150◦E (over the Pacific) are available between 18
10
February and 4 March in 2003 for comparison with SAOZ and 65 within 16.2–20.9◦S on 15 to 29 February in 2004. Since the SCIAMACHY products are number densi-ties at geometric height, they could be compared directly to SAOZ. Since the SCIA-MACHY vertical resolution is 2.6 km and the sampling 3.3 km, the SAOZ data have been smoothed and linearly interpolated to the SCIAMACHY altitude grid of 3.3 km.
15
3.8.2 Comparison with SAOZ
SCIAMACHY and SAOZ ozone profiles in 2003 and 2004 are shown in Fig. 12 and the results of the analysis summarised in Table 11. The SCIAMACHY mean profiles display an altitude shift up by 850 m over the Pacific in 2003 and by 2000 m in 2004 on average over the entire latitude band. After adjustment for this shift, the ozone concentration
20
is found low biased compared to SAOZ by 6–7% in the stratosphere between 20 and 26 km. The difference is found to increase rapidly below, reaching 25% and 66% at 15 km in 2003 and 2004 respectively. The precision above 20 km estimated from the variability is 10.6% in 2003 and 6.2% in 2004, about 4 times worse than that SAOZ.
Overall, the results of the comparison with SAOZ are very consistent with previous
25
ACPD
6, 10087–10152, 2006 Evaluation of satellite O3 measuring instruments F. Borchi and J.-P. Pommereau Title Page Abstract Introduction Conclusions References Tables Figures J I J I Back CloseFull Screen / Esc
Printer-friendly Version
Interactive Discussion
before the improvement of the ENVISAT orbit propagator model in December 2003. The current analysis shows that it is still 2000 m after the correction at the tropics. The 9% SCIAMACHY low bias compared to SAGE II is consistent with the 6% reported by Brinksma et al. (2005), both after altitude adjustment. However, as already noticed by Brinksma et al. (2005), the difference does show a zigzag shape of large amplitude.
5
The SCIAMACHY precision of 6% found here is consistent with the error estimation of 6–7% in the 20 to 25 km altitude range of Rozanov et al. (2003). Finally, according to Brinksma et al. (2005), retrieved concentrations should be quite insensitive to the a priori profile used in the inversion process down to 18 km at low latitude, but increasing rapidly below. The information provided by SCIAMACHY is thus of no use in the tropical
10
troposphere.
3.9 ENVISAT-MIPAS
MIPAS (Michelson Interferometer for Passive Atmospheric Sounding) aboard ENVISAT is a limb-viewing Fourier transform infrared (FTIR) emission spectrometer covering the mid-infrared region in five spectral bands (Fischer and Oelhaf, 1996; Harris, 2000).
15
The data used here (ESA level-2 near real time operational products) are taken in the standard observation mode, which consists in rearward limb scans covering the altitude range from 6 to 68 km within 17 steps. The vertical resolution is 3 km for the 13 lowermost tangent altitudes and increases to 8 km at the upper end of the limb scan. The O3 profiles are obtained by an optimized retrieval model (ORM) (Carli et
20
al., 2004; Ridolfi et al., 2000). The vertical sampling is of about 2.3 km. The noise calculated for each O3 measurement varies between 2 and 4% (Glatthor et al., 2005). The total error has only been evaluated in the data from September–October 2002 (Glatthor et al., 2005; Funke et al., 2005). The largest contributions to the total error are spectroscopic, gain-calibration, instrumental line shape errors, and residual errors
25
while determining the line-of-sight. For O3at high and mid latitudes, the total error was found around 10% at 10–55 km, and around 10% at 20–60 km at the tropics (Glatthor et al., 2005).
ACPD
6, 10087–10152, 2006 Evaluation of satellite O3 measuring instruments F. Borchi and J.-P. Pommereau Title Page Abstract Introduction Conclusions References Tables Figures J I J I Back CloseFull Screen / Esc
Printer-friendly Version
Interactive Discussion
Between 20 and 25 km, HALOE-MIPAS and SAGE II-MIPAS ozone mean difference showed a low bias of 7–8% and 4–5% respectively (Kerridge et al., 2004). Cross comparisons between ENVISAT instruments show a mean relative deviation between 20 and 25 km of –15% for SCIAMACHY-MIPAS, of –10% for GOMOS-MIPAS and – 5% for SCIAMACHY-GOMOS (Bracher et al., 2005). MIPAS measurements in 2002
5
and 2003 indicate a slow drift in instrumental pointing towards lower tangent heights (von Clarmann et al., 2003). Since December 2003, a correction scheme based on both engineering and orbit model updates has been provided by ESA that leads to improved limb pointing. Nevertheless, some residual pointing errors still appear to be present in the data (Bracher et al., 2005).
10
3.9.1 ENVISAT-MIPAS data selection
The data in use here are those of MIPAS NL (the Level 2 near real time operational products) version 4.61 of the retrieval algorithm available on ftp-ops.de.envisat.esa.int. Twelve MIPAS profiles within 17.7–23.3◦S between 18 February and 7 March in 2003 are available for comparison with SAOZ and 441 within 16.9–20.1◦S between 27
15
February and 15 March in 2004. The data used here are volume mixing ratios in pressure coordinates, where the pressure is retrieved from MIPAS spectra. They have been converted in number density and altitude coordinate using ECMWF pressure and temperature. The altitude coordinate also available in the MIPAS data files is not being used since it seems to show some errors. Although the geometric altitudes are derived
20
from retrieved tangent-pressures, the need to fix the geometric altitude of a reference pressure level introduces the possibility for an offset in absolute heights assigned (Ker-ridge et al., 2004). Since the MIPAS vertical resolution is 3 km the SAOZ data have been smoothed and linearly interpolated to the MIPAS altitude grid of ∼2.3 km altitude grid.
ACPD
6, 10087–10152, 2006 Evaluation of satellite O3 measuring instruments F. Borchi and J.-P. Pommereau Title Page Abstract Introduction Conclusions References Tables Figures J I J I Back CloseFull Screen / Esc
Printer-friendly Version
Interactive Discussion
3.9.2 Comparison with SAOZ
The MIPAS and SAOZ profiles in 2003 and 2004 are compared in Fig. 13 and the results summarised in Table 12. The MIPAS mean profiles display an altitude shift down by 350 m in 2003 over the Pacific and by 300 m in 2004 over the entire latitude band. After adjustment for this shift, MIPAS is found high biased in the stratosphere
5
between 20 and 26 km compared to SAOZ by 0.6% in 2003 and 7.1% in 2004, the last being established on 441 profiles being more significant than the first based on only 12 profiles. The difference increases below 20 km reaching 14% at 16 km in 2004. The precision above 20 km estimated from the variability is 5.3% in 2003 and 8.5% in 2004, but decreases below reaching 34% and 54% at 16 km respectively in 2003 and 2004.
10
Overall the results of the comparison with SAOZ are very consistent with previous evaluations of MIPAS performances. However, the present work does show a system-atic altitude shift down by ∼300 m in the tropics in both 2003 and 2004 presumably due to instrumental pointing errors. The 7% GOMOS low bias compared to MIPAS found here is consistent with the 10% reported by Bracher et al. (2005). In the same
15
manner, the 14% SCIAMACHY low bias compared to MIPAS is comparable with the 15% reported by Bracher et al. (2005). Similarly the HALOE-MIPAS –5% and SAGE II-MIPAS –7% differences are of the same order of magnitude of the –7/–8% and –4/– 5% noted by Kerridge et al. (2004). However, the precision of 8.5% above 20 km in 2004 reported here degrading rapidly below, is significantly larger than the 2–4% found
20
by Glatthor et al. (2005). According to Carli et al. (2004), the retrieved concentrations should be insensitive to the a priori profile used in the inversion down to 16 km at low latitude. Although the current MIPAS ozone data could be meaningful down to 16 km, the increasing high bias and the degradation of precision make them of little use in the Tropical Troposphere Layer.
ACPD
6, 10087–10152, 2006 Evaluation of satellite O3 measuring instruments F. Borchi and J.-P. Pommereau Title Page Abstract Introduction Conclusions References Tables Figures J I J I Back CloseFull Screen / Esc
Printer-friendly Version
Interactive Discussion 4 Summary of performances of ozone measuring instruments in tropics
The performances of all available ozone-measuring instruments in the tropical strato-sphere relative to SAOZ in 2003 and 2004 are summarized in Table 13. For ozoneson-des, HALOE and SAGE II, they fully confirm the conclusions of 2001 (Borchi et al., 2005). A remarkable feature is the frequent errors in altitude registration varying from
5
+100/+200 m for solar occultation systems (SAGE II, HALOE) to shifts as large as +2000/–900 m for limb viewing instruments (SCIAMACHY, OSIRIS). As expected, the most precise altitude is that of the GOMOS star occultation system whose observ-ing direction is very accurately known since the light source is punctual. As expected also the ozonesondes are shifted up by 200–300 m because of their time constant.
10
Curiously, the SAGE III moon occultation instrument, using a moon edge detection al-gorithm similar to that of the SAGE II solar system, is showing a shift down by 550 m. Another feature, which did not received any explanation yet, is the increasing shift up or ozone low bias of HALOE profiles below 22 km, as large as 1500 m (or 40% in ozone) at 18 km, present at both sunrise and sunset, in 2001, 2003 and 2004 compared to
15
SAOZ, identical to that already reported between SAGE II and HALOE. Since no such difference was found between SAOZ, SAGE II and all other systems, it can be safely attributed to HALOE.
The ozone bias relative to SAOZ is generally small, between –2% and+4% for most of the instruments measuring ozone in the visible Chappuis bands and near IR (SAGE
20
II and III, GOMOS, OSIRIS and HALOE), within their ±5% accuracy for the ozoneson-des, but it increases for SCIAMACHY in the UV (–6.6%), MIPAS in the mid-IR (+7%) and SMR in the sub-millimeter region (+7%). Most of above biases are not new. On av-erage, as shown in Table 14, the differences between a couple of instruments derived here are very consistent with those of previous evaluations.
25
New here is the evaluation of the precision of each by a statistical method based on the limited ozone variability in the tropical stratosphere, moreover shown to be mainly due to horizontal transport efficiently removed by a regression analysis using