Chronological Approach of Diet-induced
Alterations in Muscle Mitochondrial Functions
in Rats
Emilie Chanse´aume,* Anne-Laure Tardy,* Je´roˆme Salles,* Christophe Giraudet,* Paulette Rousset,* Antoine Tissandier,* Yves Boirie,*† and Be´atrice Morio*
Abstract
CHANSE´ AUME, EMILIE, ANNE-LAURE TARDY,
JE´ ROˆME SALLES, CHRISTOPHE GIRAUDET,
PAULETTE ROUSSET, ANTOINE TISSANDIER, YVES
BOIRIE, AND BE´ ATRICE MORIO. Chronological
approach of diet-induced alterations in muscle
mitochondrial functions in rats. Obesity. 2007;15:50 –59. Objective: Mitochondrial dysfunction might predispose in-dividuals to develop insulin resistance. Our objective was to determine whether mitochondrial dysfunction or insulin re-sistance was the primary event during high-fat (HF) diet. Research Methods and Procedures: Rats were fed an HF diet for 0, 3, 6, 9, 14, 20, or 40 days and compared with control. Soleus and tibialis muscle mitochondrial activity were assessed using permeabilized fiber technique. Insulin
[area under the curve for insulin (AUCI)] and glucose [area
under the curve for glucose (AUCG)] responses to
intraperi-toneal glucose tolerance test as well as fasting plasma non-esterified fatty acids (NEFAs), triglyceride, and glyc-erol concentrations were determined.
Results: AUCI and AUCG were altered from Day 6 (p ⬍ 0.01 vs. Day 0). In soleus, oxidative phosphorylation (OX-PHOS) activity was transiently enhanced by 26% after 14
days of HF diet (p⬍ 0.05 vs. Day 0) conjointly with 62%
increase in NEFA concentration (p⬍ 0.05 vs. Day 0). This
was associated with normalized AUCGat Day 14 and with
a decline of plasma NEFA concentration together with stabilization of intra-abdominal adiposity at Day 20. Pro-longation of HF diet again caused an increase in plasma
NEFA concentration, intra-abdominal adiposity, AUCI, and
AUCG. At Day 40, significant decrease in OXPHOS
activ-ity was observed in soleus.
Discussion: Mitochondria first adapt to overfeeding in ox-idative muscle limiting excess fat deposition. This poten-tially contributes to maintain glucose homeostasis. Persis-tent overfeeding causes insulin resistance and results in a slow decline in oxidative muscle OXPHOS activity. This shows that the involvement of mitochondria in the predis-position to insulin resistance is mainly due to an inability to face prolonged excess fat delivery.
Key words: type 2 diabetes, lipid metabolism, energy metabolism, insulin resistance
Introduction
Insulin resistance is a complex metabolic disorder that precedes by 10 to 20 years the onset of type 2 diabetes. Current knowledge indicates that physiopathology of insu-lin resistance involves metabolic alterations with distinct mechanisms in several tissues including liver, skeletal mus-cle, and adipose tissue (1).
Regarding skeletal muscle, recent experiments have shown
that mitochondrial oxidative phosphorylation (OXPHOS)1
activity and expression of genes involved in OXPHOS are reduced in muscle of insulin-resistant patients suffering from obesity or type 2 diabetes (2–7). In addition to a role of visceral fat (8) in the etiology of insulin resistance, de-Received for review June 27, 2006.
Accepted in final form August 8, 2006.
The costs of publication of this article were defrayed, in part, by the payment of page charges. This article must, therefore, be hereby marked “advertisement” in accordance with 18 U.S.C. Section 1734 solely to indicate this fact.
*Lipid and Energy Metabolism Research Unit, Human Nutrition Laboratory, Institut Na-tional de la Recherche Agronomique, Unite´ Mixte de Recherche 1019, Clermont-Ferrand, France; and †University Clermont 1, Unite´ de Formation et de Recherche Me´decine, Clermont-Ferrand, France.
Address correspondence to B. Morio, Lipid and Energy Metabolism Research Unit, Human Nutrition Laboratory, BP 321, 58 Montalembert Str., 63009 Clermont-Ferrand cedex 1, France.
E-mail: morio@clermont.inra.fr Copyright © 2007 NAASO
1Nonstandard abbreviations: OXPHOS, oxidative phosphorylation; HF, high fat; NEFA, non-esterified fatty acid; TG, triglyceride; IPGTT, intraperitoneal glucose tolerance test; AUCG, area under the curve for glucose; AUCI, area under the curve for insulin; ADP, adenosine 5⬘-diphosphate; ATP, adenosine triphosphate; G/M/S, glutamate/malate/succi-nate; RCR, respiratory control ratio; NS, not significant; PGC-1␣, peroxisome proliferator-activated receptor-␥ coactivator-1␣.
creased muscle fat oxidation can favor the intramyocellular accumulation of fatty acid metabolites (e.g., diacylglycerol and ceramides), which can lead to the deterioration of the insulin signal transduction pathway (9,10). From these find-ings emerged the hypothesis that alterations in mitochondrial OXPHOS activity might be a major risk factor predisposing individuals to develop insulin resistance (4).
For obvious ethical reasons, most of the existing studies in humans have been conducted in diagnosed patients and did not inform about the time course development of muscle mitochondrial dysfunction and insulin resistance (4,11–13). Furthermore, animal studies have been mainly conducted using endpoint model, by comparing, for example, lean vs. obese groups and lean vs. diabetic or insulin-resistant groups (8,14,15). However, a major limit of such models is that they do not inform about any cause and effect relation-ship between insulin resistance and mitochondrial dysfunc-tion. Therefore, a chronological model is required to inves-tigate the sequence of events leading to mitochondrial dysfunction and insulin resistance.
Rodents fed a high-fat (HF) diet for several weeks is a useful validated model (16,17) to study the mechanisms of obesity-induced insulin resistance. We have recently dem-onstrated that this model induces within 6 weeks mito-chondrial dysfunction in skeletal muscle of sedentary rats in association with accumulation of intramyocellular lipids (18). Therefore, in the present work, we used the HF diet in Wistar rats to study the sequence of events leading to muscle mitochondrial dysfunction and insulin resistance. Our aim was to determine whether mitochondrial dysfunc-tion or insulin resistance was the primary event. For that purpose, we examined the changes over time (from 0 to 40 days of diet) in muscle mitochondrial activity, insulin sen-sitivity, intra-abdominal fat weight, and plasma metabolites [non-esterified fatty acids (NEFAs), glycerol, and triglyc-eride (TG)] in HF- and control-fed Wistar rats. As muscle-type-specific adaptations to HF diet have been found in mitochondrial OXPHOS activity (18), we investigated mi-tochondrial functions both in the oxidative soleus and in the glycolytic tibialis anterior muscles.
Research Methods and Procedures
Animals and Diets
Male (⬃400 grams) Wistar rats 3 months old (CERJ, Le
Genest Saint Isle, France) were individually housed and maintained under standard conditions on a 12-/12-hour light/dark cycle in a temperature-controlled room (20 °C to 22 °C). After 1-week acclimatization with a standard corn-starch-based diet, animals were randomly divided into 13 groups of 16 with similar initial body weight. Animals were placed on either a HF or the standard starch-based diet for 3, 6, 9, 14, 20, or 40 days. At the beginning of the experi-ment, 10 animals were sacrificed to constitute the basal group (control diet, Day 0).
Standard diet (UPAE, Jouy-en Josas, France) contained 17.4% protein (casein), 13.8% fat (6.9% of each peanut and canola seed oil), and 68.8% carbohydrates (cornstarch), expressed as percentage of total energy. HF diet (UPAE) contained 17.4% protein (casein), 45% fat (lard for the most part), and 37.6% carbohydrates (25.6% cornstarch and 12% sucrose), expressed as percentage of total energy. Food was
distributed in individual ramekins providing⬃86 kcal/d to
control groups and 33% more energy to HF groups. Diets were similarly enriched in protein, vitamins, fibers (cellu-lose), and minerals. Water was available ad libitum. Ani-mals were weighed twice a week. The experiment was approved by the ethical committee for animal experimenta-tion (Comiteˆ Re´gional d’Ethique sur l’Expe´rimentaexperimenta-tion Animale, Auvergne, CE 1-05).
Intraperitoneal Glucose Tolerance Test (IPGTT)
Insulin sensitivity was evaluated using an IPGTT (1 g
glucose/kg body weight, between 9 AM and 10 AM after
overnight fast) by the glucose insulin index, the product of
the area under the curve for glucose (AUCG) and area under
the curve for insulin (AUCI), respectively. To avoid
even-tual stress impact on biological parameters subsequent to the test, independent groups of animals were used for IPGTT and tissue collection except for the basal group for which IPGTT measurements were performed in six rats from the Day 40 group. An insulin enzyme-linked immu-nosorbent assay kit was obtained from Linco (St. Charles, MO).
Muscle, Liver, and Adipose Tissue Collection
After anesthesia by an intraperitoneal injection of keta-mine and Valium, animals were killed by decapitation (at
9AM). Blood samples were collected in heparinized tubes
and centrifuged immediately for plasma separation. Plasma
was stored at⫺20 °C until metabolite assays. Soleus
(oxi-dative muscle) and tibialis anterior (glycolytic muscle) were quickly removed, separated from fat and connective tissues. Around 50 mg of each muscle was kept at 4 °C in a preser-vation solution until skinned fiber preparation. The remaining
muscles were cooled in liquid nitrogen and stored at⫺80 °C
until further analyses.
After opening the abdominal cavity, the omental (sepa-rated from the pancreas), mesenteric (removed from the length of the gut), paired perirenal (separated from kidneys), and epididymal (separated from testes) fat pads and the liver were then removed and weighed. Estimates of intra-abdom-inal fat were calculated by summing weights of perirenal, epididymal, mesenteric, and omental fat pads.
Biochemical Assays
Plasma concentrations of TG, NEFAs, and glycerol were measured using the automated analyzer (Konelab 20; Thermo Electron, Waltham, MA), and biochemical assay kits were
purchased from Randox Laboratories (Crumlin, United King-dom) for NEFA and glycerol and Thermo Electron for the TG assay.
Measurement of Mitochondrial Respiration and Adenosine Triphosphate (ATP) Synthesis
Reagents were obtained from Sigma-Aldrich (St. Louis, MO). A bioluminescence ATP assay kit (ENLITEN rLuci-ferase/Luciferine) was purchased from Promega (Madison, WI).
Skinned Fiber Preparation
Mitochondrial respiration and ATP production were stud-ied in saponin skinned fibers as described by Saks et al. (19). The experimental procedure with composition of so-lutions and substrates has been detailed previously (18).
Fiber respiration rates were measured at 25 °C using an oxygraph system (Oxytherm; Hansatech Instruments,
Nor-folk, UK) with the mixture 5 mM glutamate⫹ 2 mM malate
⫹ 5 mM succinate (G/M/S) to test the activity of the mitochondrial respiratory chain.
State 2 was measured in the presence of respiratory
substrates without adenosine 5⬘-diphosphate (ADP) (there
was no State 1). State 3 was measured after addition of 1 mM ADP (20). The quality of fibers preparation (notably complete removal of free ADP during washing) was
vali-dated by return to State 2 after the addition of 60 M
atractyloside, a potent inhibitor of the ATP/ADP carrier, adenine nucleotide translocator. ATP synthesis was
mea-sured as described by Ouhabi et al. (20). Briefly, at time t⫽
15, 30, 45, 60, and 75 seconds after addition of ADP, 10-L
aliquots were taken in the respiratory chamber and quickly
frozen in test tubes containing 100L of dimethylsulfoxide.
After dilution in 2 mL of distilled water, ATP concentration was measured at each time-point by bioluminescence using a luminometer (Luminoskan Ascent; ThermoLabsystems, Waltham, MA) and ATP reagent kit. Finally, fibers were dried for 24 hours at 110 °C and weighed. Measurements were performed in duplicate with 0.5 to 1.5 mg of dried fibers.
States 2 and 3 respiration rates were expressed as nano-atoms of oxygen per minute per milligram of dried fibers. Respiratory control ratio (RCR) was calculated by dividing State 3 by State 2 respiration rate. ATP production rate was expressed as nanomoles per minute per milligram of dried fibers. ATP-to-oxygen ratio (ATP/O) evaluated coupling of ATP production (nanomoles per minute per milligram) to
maximal oxygen consumption (State 3 in nanomoles of O2
per minute per milligram) in skeletal muscle fibers. Data Analysis and Statistics
Data are provided as means⫾ standard deviation.
Statis-tical analyses were performed using Statview, version 5.0 (SAS Institute Inc., Cary, NC). Two-way ANOVA was used to examine time and diet-induced differences in body com-position, responses to IPGTT, muscle mitochondrial func-tions, and plasma concentrations. Protected least significant difference Fisher test was used for post hoc analyses. Re-sults were considered significant at the 5% level.
Results
Body, Liver, and Muscle Weights
Time- and diet-induced changes in body, liver, soleus, and tibialis muscle weights are presented in Tables 1 and 2.
Table 1. Time-dependent changes in body and liver weights according to diet (n⫽ 10 per group)
Body weight (g) Liver weight (g)
Days of diet Control HF Control HF
0 430⫾ 6a 430⫾ 6a 14.17⫾ 1.67 14.17⫾ 1.67a 3 435⫾ 13a 462⫾ 13b* 14.50⫾ 1.20 15.62⫾ 0.68ab 6 460⫾ 18ab 492⫾ 25c* 15.13⫾ 1.34 15.53⫾ 1.20ab 9 464⫾ 40b 502⫾ 32c 15.37⫾ 1.34 17.45⫾ 2.63bc* 14 489⫾ 23bc 518⫾ 46cd 15.66⫾ 1.14 17.54⫾ 1.43bc* 20 491⫾ 35bc 535⫾ 29d* 15.94⫾ 2.09 17.80⫾ 1.88bc* 40 514⫾ 23c 570⫾ 28e† 15.95⫾ 1.38 19.13⫾ 2.74c* p ⬍0.001 ⬍0.001 NS ⬍0.001
HF, high fat; NS, not significant. Values are means⫾ standard deviation; p values are from two-way ANOVA. Significantly different from Day 0 of the same diet: a⬍ b ⬍ c ⬍ d ⬍ e, p ⬍ 0.05.
* Significantly different from the control group of the same diet duration, p⬍ 0.05. † Significantly different from the control group of the same diet duration, p⬍ 0.001.
The results showed significant time and diet effects on body
weight (time effect, p⬍ 0.001; diet effect, p ⬍ 0.001), liver
weight (time effect, p⬍ 0.001; diet effect, p ⬍ 0.001), and
time effect on muscle weights (p⬍ 0.05 and p ⬍ 0.001 for
soleus and tibialis, respectively).
Considering time effect in separate groups, body weight significantly increased after 3 days in the HF group (time
effect, p⬍ 0.001 vs. Day 0) and after 9 days in the control
group (time effect, p⬍ 0.001 vs. Day 0). Furthermore, body
weight was significantly higher in the HF group at Day 3
(p⬍ 0.01), Day 6 (p ⬍ 0.05), Day 20 (p ⬍ 0.01), and Day
40 (p ⬍ 0.001) compared with the control group.
Liver weight was unchanged across time in control rats
[p⫽ not significant (NS)] but significantly increased after 9
days in the HF group (time effect, p⬍ 0.001 vs. Day 0).
Diet effect was significant starting from Day 9 compared
with control (p⬍ 0.05).
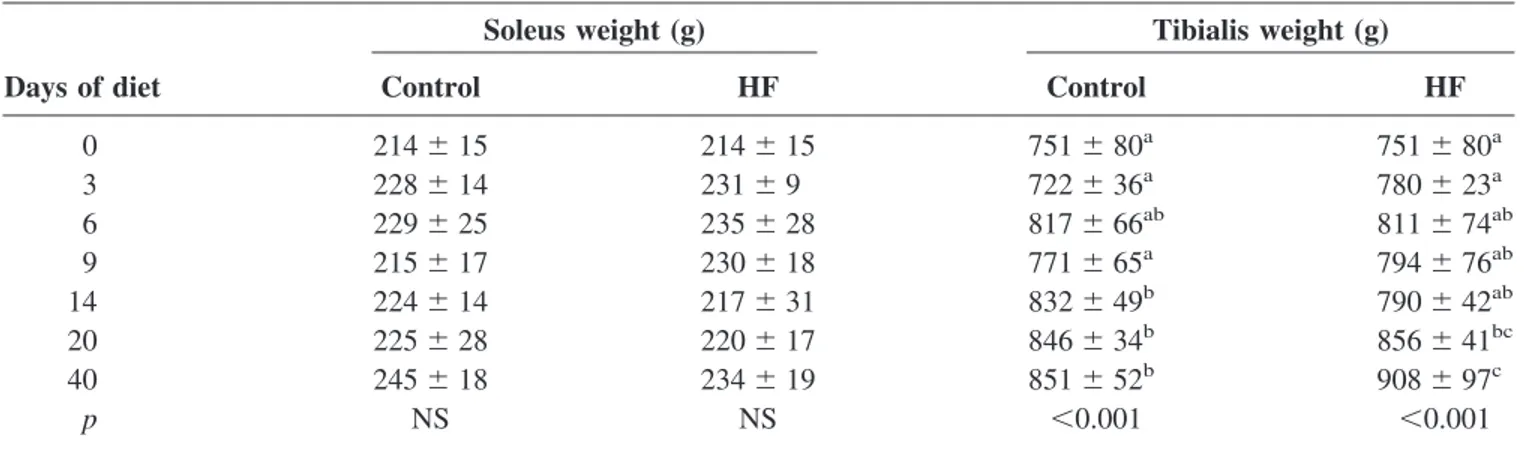
No significant time effect was observed on soleus weight in both groups when considered separately. Tibialis weight increased significantly after 20 days in the HF group (time
Table 2. Time-dependent changes in muscle weights according to diet (n⫽ 10 per group)
Soleus weight (g) Tibialis weight (g)
Days of diet Control HF Control HF
0 214⫾ 15 214⫾ 15 751⫾ 80a 751⫾ 80a 3 228⫾ 14 231⫾ 9 722⫾ 36a 780⫾ 23a 6 229⫾ 25 235⫾ 28 817⫾ 66ab 811⫾ 74ab 9 215⫾ 17 230⫾ 18 771⫾ 65a 794⫾ 76ab 14 224⫾ 14 217⫾ 31 832⫾ 49b 790⫾ 42ab 20 225⫾ 28 220⫾ 17 846⫾ 34b 856⫾ 41bc 40 245⫾ 18 234⫾ 19 851⫾ 52b 908⫾ 97c p NS NS ⬍0.001 ⬍0.001
HF, high fat; NS, not significant. Values are means⫾ standard deviation; p values are from two-way ANOVA. Significantly different from Day 0 of the same diet: a⬍ b ⬍ c, p ⬍ 0.05.
* Significantly different from the control group of the same diet duration: p⬍ 0.05. † Significantly different from the control group of the same diet duration: p⬍ 0.001.
Table 3. IPGTT results according to the experimental diets (n ⫽ 6 per group)
FPG (mM) AUCGduring IPGTT FPI (pM) AUCIduring IPGTT
Days of diet Control HF Control HF Control HF Control HF
0 4.95⫾ 0.39 4.95 ⫾ 0.39 965 ⫾ 125 965 ⫾ 125a 3.72⫾ 1.56 3.72 ⫾ 1.56 628 ⫾ 118 628 ⫾ 118a 3 4.82⫾ 0.68 5.30 ⫾ 0.56 1009 ⫾ 147 970 ⫾ 68a 2.62⫾ 0.71 5.25 ⫾ 3.44 614 ⫾ 137 749 ⫾ 205ab 6 5.08⫾ 0.35 5.43 ⫾ 0.36 958 ⫾ 137 1096 ⫾ 187ab 3.48⫾ 2.24 6.14 ⫾ 3.51 633 ⫾ 304 998 ⫾ 269bc 9 4.99⫾ 0.71 4.98 ⫾ 0.37 957 ⫾ 181 1107 ⫾ 119b 2.32⫾ 0.47 4.45 ⫾ 1.61 510 ⫾ 172 987 ⫾ 211bc 14 4.84⫾ 0.51 4.47 ⫾ 0.19 1070 ⫾ 215 1054 ⫾ 106ab 2.03⫾ 1.23 3.55 ⫾ 1.52 637 ⫾ 163 988 ⫾ 196bc* 20 4.46⫾ 0.60 4.78 ⫾ 0.37 949 ⫾ 121 1144 ⫾ 176b* 3.17⫾ 1.32 4.80 ⫾ 2.19 800 ⫾ 124 1117 ⫾ 184c* 40 4.53⫾ 0.83 4.56 ⫾ 0.42 973 ⫾ 60 1158 ⫾ 199b* 2.16⫾ 1.47 4.78 ⫾ 2.78 611 ⫾ 336 1161 ⫾ 424c* p NS NS NS ⬍0.05 NS NS NS ⬍0.01
IPGTT, intraperitoneal glucose tolerance test; FPG, fasting plasma glucose; AUCG, area under the curve for glucose; FPI , fasting plasma
insulin; AUCI, area under the curve for insulin; NS, not significant. Values are means⫾ standard deviation; p values are from two-way ANOVA. Significantly different from Day 0 of the same diet: a⬍ b ⬍ c, p ⬍ 0.05.
* Significantly different from the control group of the same diet duration: p⬍ 0.05. † Significantly different from the control group of the same diet duration: p⬍ 0.001.
Table 4. Effects of experimental diets on the respiration rates, RCR, ATP synthesis, and ATP/oxygen in permeabilized fibers from soleus muscle (n ⫽ 10 per group) with glutamate/malate/succinate State 2 State 3 RCR ATP production ATP/oxygen Days of diet Control HF Control HF Control HF Control HF Control HF 0 6.37 ⫾ 1.88 6.37 ⫾ 1.88 b 12.26 ⫾ 2.98 12.26 ⫾ 2.98 b 2.00 ⫾ 0.43 2.00 ⫾ 0.43 23.91 ⫾ 4.63 23.91 ⫾ 4.63 bc 3.92 ⫾ 0.54 3.92 ⫾ 0.54 3 5.09 ⫾ 1.18 6.30 ⫾ 1.16 b 10.07 ⫾ 2.28 12.15 ⫾ 2.25 b 2.02 ⫾ 0.29 1.94 ⫾ 0.24 23.11 ⫾ 8.51 21.69 ⫾ 5.97 b 3.54 ⫾ 0.59 3.18 ⫾ 0.53 6 6.09 ⫾ 1.40 6.12 ⫾ 1.45 b 12.13 ⫾ 3.23 11.84 ⫾ 3.03 b 1.98 ⫾ 0.22 1.97 ⫾ 0.49 20.22 ⫾ 2.34 23.21 ⫾ 6.03 bc 3.17 ⫾ 0.58 3.82 ⫾ 0.94 9 6.44 ⫾ 1.71 6.07 ⫾ 0.93 b 11.83 ⫾ 3.10 10.35 ⫾ 1.43 ab 1.85 ⫾ 0.17 1.73 ⫾ 0.24 22.28 ⫾ 3.39 19.28 ⫾ 4.94 b 3.91 ⫾ 0.79 3.68 ⫾ 0.88 14 6.18 ⫾ 1.25 8.13 ⫾ 1.88 c * 12.10 ⫾ 2.30 15.49 ⫾ 3.98 c * 2.04 ⫾ 0.37 1.92 ⫾ 0.22 23.85 ⫾ 5.58 28.25 ⫾ 7.02 c 4.07 ⫾ 0.67 3.62 ⫾ 1.01 20 6.11 ⫾ 1.70 5.81 ⫾ 0.53 a 12.35 ⫾ 3.60 11.41 ⫾ 2.15 b 2.07 ⫾ 0.27 1.97 ⫾ 0.28 23.63 ⫾ 5.14 23.88 ⫾ 3.28 bc 3.24 ⫾ 0.61 3.62 ⫾ 0.39 40 6.26 ⫾ 1.52 5.30 ⫾ 1.61 a 11.18 ⫾ 2.59 8.98 ⫾ 2.38 a * 1.80 ⫾ 0.33 1.76 ⫾ 0.23 21.05 ⫾ 8.14 11.35 ⫾ 3.60 a * 3.41 ⫾ 0.49 2.59 ⫾ 0.58 p NS 0.01 NS 0.001 NS NS NS 0.001 NS NS RCR, respiratory control ratio; ATP, adenosine triphosphate; HF, high fat; NS, not significant. Values are means ⫾ standard deviation; p values are from two-way ANOVA. Significantly different from Day 0 o f the same diet: a ⬍ b ⬍ c, p ⬍ 0.05. Respiration rates are expressed in nanoatoms of oxygen per minute per milligram dry weight, and ATP synthesis rates are expressed in nanomoles per minute per milligram dry weight. * Significantly different from the control group of the same diet duration: p ⬍ 0.05. † Significantly different from the control group of the same diet duration: p ⬍ 0.001.
Table 5. Effects of experimental diets on the respiration rates, RCR, ATP synthesis, and ATP/oxygen in permeabilized fibers from tibialis muscle (n ⫽ 10 per group) with glutamate/malate/succinate. State 2 State 3 RCR ATP production ATP/oxygen Days of diet Control HF Control HF Control HF Control HF Control HF 0 4.73 ⫾ 1.64 4.73 ⫾ 1.64 11.72 ⫾ 1.93 11.72 ⫾ 1.93 2.66 ⫾ 0.69 2.66 ⫾ 0.69 16.53 ⫾ 5.78 16.53 ⫾ 5.78 2.47 ⫾ 0.70 2.47 ⫾ 0.70 3 3.45 ⫾ 1.88 3.78 ⫾ 1.49 10.19 ⫾ 2.06 9.06 ⫾ 2.19 2.71 ⫾ 0.53 2.55 ⫾ 0.60 15.85 ⫾ 3.76 13.71 ⫾ 2.38 2.95 ⫾ 1.02 3.14 ⫾ 0.39 6 4.01 ⫾ 1.63 3.22 ⫾ 0.90 10.12 ⫾ 1.50 9.45 ⫾ 2.52 2.66 ⫾ 0.79 2.92 ⫾ 0.39 17.44 ⫾ 2.77 12.74 ⫾ 3.66 3.14 ⫾ 0.77 2.92 ⫾ 1.20 9 4.09 ⫾ 1.37 4.28 ⫾ 1.02 9.57 ⫾ 2.68 10.96 ⫾ 1.25 2.39 ⫾ 0.40 2.69 ⫾ 0.73 18.45 ⫾ 4.00 18.87 ⫾ 5.77 3.66 ⫾ 0.65 3.34 ⫾ 0.81 14 3.20 ⫾ 0.66 4.36 ⫾ 1.10 10.42 ⫾ 1.62 10.80 ⫾ 1.87 3.08 ⫾ 0.31 2.54 ⫾ 0.49 17.54 ⫾ 5.14 14.94 ⫾ 5.69 3.23 ⫾ 0.62 2.76 ⫾ 1.11 20 2.74 ⫾ 0.58 3.40 ⫾ 0.67 8.47 ⫾ 1.14 9.44 ⫾ 1.41 2.84 ⫾ 0.52 2.76 ⫾ 0.54 15.63 ⫾ 3.61 15.18 ⫾ 3.22 3.13 ⫾ 0.58 3.02 ⫾ 0.73 40 4.29 ⫾ 0.67 4.51 ⫾ 0.83 9.24 ⫾ 1.66 10.10 ⫾ 1.43 2.39 ⫾ 0.30 2.27 ⫾ 0.27 18.52 ⫾ 5.03 10.30 ⫾ 3.30* 3.40 ⫾ 0.44 2.00 ⫾ 0.44 p NS NS NS NS NS NS NS 0.08 NS NS RCR, respiratory control ratio; ATP, adenosine triphosphate; HF, high fat; NS, not significant. Values are means ⫾ standard deviation; p values are from two-way ANOVA. Respiration rates are expressed in nanoatoms of oxygen per minute per milligram dry weight, and ATP synthesis rates are expressed in nanomoles per min ute per milligram dry weight. *Significantly different from the control group of the same diet duration: p ⬍ 0.05. † Significantly different from the control group of the same diet duration: p ⬍ 0.001.
effect, p⬍ 0.001 vs. Day 0) and after 14 days in the control
group (time effect, p⬍ 0.001 vs. Day 0).
Intra-abdominal Fat Pads
Significant time and diet effects were observed for intra-abdominal adiposity whatever the fat pad localization
(time effect, p ⬍ 0.001; diet effect, p ⬍ 0.01).
Intra-abdominal fat (sum of the four intra-Intra-abdominal fat pads) weight was unchanged across time in the control group
(20.4⫾ 4.3 grams, p ⫽ NS). Intra-abdominal fat weights in
the HF groups are presented in Figure 1. Considering fat pads separately, mesenteric fat weight was significantly increased from Day 3 in the HF group, compared with the
control group or Day 0 (p⬍ 0.05, data not shown). Omental
adipose tissue was significantly increased from Day 6 (p⬍
0.05, data not shown) and perirenal and periepididymal fat
weight from Day 9 compared with Day 0 (p⬍ 0.05, data not
shown). IPGTT
We examined changes in fasting plasma glucose, fasting
plasma insulin, and AUCGand AUCI during IPGTT. The
results showed significant time and diet effects on AUCG
and AUCI(p⬍ 0.05, Table 3). Fasting plasma glucose and
fasting plasma insulin were not significantly altered in ei-ther group during the experiment (Table 3).
Regarding time effect, AUCGand AUCIwere unchanged
across time in the control group (Table 3). In the HF group,
AUCG values were similar from Days 0 to 6. AUCG was
then significantly increased at Day 9 compared with Day 0, regained basal level at Day 14, and increased significantly
above Day 0 value at Days 20 and 40 (p⬍ 0.05). AUCIwas
significantly increased from Days 6 to 40 compared with
Day 0 (p⬍ 0.01).
Mitochondrial Activity
We examined changes in States 2 and 3 respiration rates, ATP production, RCR, and ATP/O values in soleus and tibialis muscles. Effects of experimental diets on mitochon-drial activity from soleus muscle with G/M/S are presented in Table 4.
The results showed significant time effect on all
param-eters (p ⬍ 0.05) and significant interaction between time
and diet for State 2, State 3, and ATP production rates (p⬍
0.05). When considered separately, no significant time ef-fect was observed on State 2, State 3, and ATP production
in the control group (p⫽ NS). Furthermore, no change was
observed on RCR and ATP/O values in both groups (p ⫽
NS).
Considering time effect in the HF group (p ⬍ 0.001),
States 2 and 3 respiration rates and ATP production signif-icantly increased at Day 14 compared with Day 0. Return to basal values was observed at Day 20 for the three parame-ters. Thereafter, State 3 and ATP production were
signifi-cantly lower at Day 40 compared with Day 0 (p⬍ 0.01).
Considering diet effect, States 2 and 3 were significantly increased in the HF group at Day 14 compared with the
control group (p⬍ 0.05). State 3 and ATP production were
significantly decreased in the HF group at Day 40 compared
with the control group (p⬍ 0.05).
Effects of experimental diets on mitochondrial activity from tibialis muscle are presented in Table 5. States 2 and 3 respiration rates, ATP/O, and RCR values were not sig-nificantly altered during the experiment in both control and
HF groups (p⫽ NS, Table 5). ATP production at Day 40
was significantly decreased in the HF group compared with
the control group and Day 0 (p⬍ 0.05).
Concentration of Plasma Metabolites
NEFA, TG, and glycerol concentration in the control and HF groups are presented in Table 6. The results showed diet
effect on NEFAs (p⬍ 0.001), TGs (p ⬍ 0.05), and glycerol
(p⬍ 0.001). No significant time effect was observed in the
control group whatever the metabolite studied (p ⫽ NS).
Regarding time effect in the HF group, TG concentration was increased at Day 6 compared with Day 0 or control
group (p⬍ 0.05) and remained elevated until Day 40 (p ⬍
0.05). Changes in NEFA and glycerol plasma concentration followed the same pattern, characterized by a higher value
from Days 6 to 14 (p⬍ 0.05 vs. Day 0), a transient return
to basal value at Day 20 (p ⫽ NS vs. Day 0), and an
elevated value at Day 40 (p⬍ 0.05 vs. Day 0).
Discussion
It is now assumed that defects in muscle mitochondrial OXPHOS activity may predispose to insulin resistance. To corroborate this hypothesis, we used a model of diet-in-duced obesity previously validated in our laboratory (18)
Figure 1: Time-dependent changes in weight of intra-abdominal
fat pads of the HF groups (n⫽ 10 per group). Intra-abdominal fat weight was unchanged across time in control group (20.4⫾ 4.3 g,
p⫽ ns). Significantly different from the basal value (day 0): *p ⬍
and examined the sequences of events leading to mitochon-drial dysfunction in skeletal muscles of rats. Insulin resis-tance and changes in parameters of lipid metabolism were also assessed. As previously described (18), mitochondrial OXPHOS activity was specifically altered by the HF diet in the oxidative muscle soleus but was not significantly af-fected in the glycolytic muscle tibialis. Surprisingly, in soleus, mitochondrial OXPHOS activity was transiently en-hanced by 26% after 14 days of HF diet conjointly with 62% increase in plasma NEFA concentration. This adapta-tion was associated with normalized glycemic response to IPGTT at Day 14 but also with return to baseline values of plasma NEFA concentration and stabilization of intra-ab-dominal adiposity at Day 20. Prolongation of HF diet again caused an increase in plasma NEFA concentration, intra-abdominal adiposity, and glycemic and insulinemic re-sponses to IPGTT. At this stage (Day 40), significant de-crease in mitochondrial OXPHOS activity was observed in soleus. Therefore, the present results suggest that mitochon-drial functions first adapt to overfeeding in oxidative muscle limiting excess fat delivery. Thereafter, persistent overfeed-ing possibly causes system overflow and insulin resistance and induce a slow decline in muscle mitochondrial OX-PHOS activity.
The present study showed that rats fed a HF diet rapidly developed an altered response to IPGTT conjointly with increased body weight gain, intra-abdominal fat deposition, and plasma NEFA and TG concentrations. Surprisingly, the rise in plasma NEFA concentration at Day 14 had an op-posite effect on muscle mitochondrial functions than what could be expected from recent literature. Among the possi-ble factors involved in this response, peroxisome
prolifera-tor-activated receptor-␥ coactivator-1␣ (PGC-1␣) is a good
candidate. PGC-1␣ is a master controller of mitochondrial
gene expression in skeletal muscle (21). Several studies have demonstrated down-regulation of its muscle mRNA level in a situation of acute increase in plasma NEFA levels (22,23). In addition, an inverse relationship has been
de-scribed between PGC-1␣ protein expression and
intramyo-cellular TG accumulation in red and white gastrocnemius of rodents (23). The present study contrasted with these data. State 3 respiration and ATP production rates were increased by 26% and 18%, respectively, at Day 14 compared with basal values, demonstrating an enhanced mitochondrial OXPHOS activity in soleus. This effect was specific to the oxidative muscle because State 3 respiration and ATP pro-duction rates remained unaltered in tibialis. Strikingly co-incidental with enhanced OXPHOS activity in soleus, we observed a normalization of the glycemic response to IPGTT at Day 14 and an improvement in lipid metabolism at Day 20 (i.e., decreased plasma NEFA concentration and stabilization of intra-abdominal fat deposition).
Prolonged overfeeding led to mitochondrial weakening in soleus at Day 40. Respectively, 27% and 53% reductions in State 3 respiration and ATP production rates were observed in this oxidative muscle compared with basal values. In contrast, but in agreement with previous findings (18), mitochondrial oxidative capacity within the glycolytic mus-cle was unchanged, and a tendency for a decreased ATP
production rate was observed (p ⫽ 0.08). At this stage, in
accordance with previous studies in rats (16,24,25), alter-ations in glucose and insulin responses to IPGTT showed that insulin resistance was already tangible in peripheral tissues (e.g., skeletal muscles). An important conclusion
Table 6. Time-dependent changes in plasma concentration of TG, NEFAs, and glycerol (n⫽ 10 per group)
NEFA TG Glycerol
Days of diet Control HF Control HF Control HF
0 0.34⫾ 0.03 0.34⫾ 0.03a 1.62⫾ 0.52 1.62⫾ 0.52a 153.6⫾ 39.9 153.6⫾ 39.9a 3 0.39⫾ 0.08 0.34⫾ 0.05a 1.60⫾ 0.46 1.54⫾ 0.49a 154.0⫾ 13.3 157.8⫾ 23.1a 6 0.37⫾ 0.13 0.51⫾ 0.06b* 1.97⫾ 0.93 2.28⫾ 0.45ab 162.7⫾ 48.6 201.1⫾ 15.2b 9 0.25⫾ 0.04 0.44⫾ 0.12a* 1.97⫾ 0.56 2.69⫾ 0.94b 148.4⫾ 13.9 178.1⫾ 16.4a* 14 0.29⫾ 0.10 0.55⫾ 0.12b* 2.28⫾ 0.53 2.39⫾ 0.86ab 151.0⫾ 25.8 204.9⫾ 23.9b* 20 0.36⫾ 0.12 0.37⫾ 0.14a 1.83⫾ 0.33 2.45⫾ 1.09ab 179.0⫾ 37.2 163.6⫾ 28.3a 40 0.26⫾ 0.09 0.50⫾ 0.11b† 1.90⫾ 0.66 2.56⫾ 0.36b* 140.3⫾ 32.9 210.9⫾ 38.5b* p NS ⬍0.01 NS ⬍0.05 NS ⬍0.01
TG, triglyceride; NEFA, non-esterified fatty acid; HF, high fat; NS, not significant. Values are means⫾ standard deviation; p values are from two-way ANOVA. Significantly different from Day 0 of the same diet: a⬍ b, p ⬍ 0.05. Values are expressed in grams per liter, micromolar (glycerol), and millimolar (NEFA).
* Significantly different from the control group of the same diet duration: p⬍ 0.05. † Significantly different from the control group of the same diet duration: p⬍ 0.001.
arising from these observations is that mitochondrial dys-function within the oxidative muscle occurs late, in all likelihood after the deterioration of insulin sensitivity within the tissue. This indicates that muscle mitochondria dysfunc-tions follow the induction of insulin resistance and that these defects occur because both muscle and adipose tissue encounter difficulty regulating excess NEFA delivery. In-terestingly, at Day 40, sizes of intra-abdominal fat pads and plasma NEFA, glycerol, and TG concentrations were again significantly elevated compared with Day 0. Despite that these metabolic alterations were all similar to those ob-served at Day 14, HF-fed rats did not exhibit higher muscle oxidative capacity.
Over the past few years, it has been clearly established that decreased muscle fat oxidation can favor the intramyo-cellular accumulation of fatty acid metabolites (e.g., diac-ylglycerol and ceramides) that can lead to the deterioration of the insulin signal transduction pathway (9,10). From these findings has emerged the hypothesis that mitochon-drial dysfunction may be a causal factor of insulin resis-tance. However, other markers of metabolic capacity should be considered including fatty acid metabolism and uptake. Indeed, present data provide strong evidence that mitochon-drial dysfunction occurs secondary to lipid accumulation. In support of these data, a recent study in humans has demon-strated that basal lipid oxidation is not impaired in patients with type 2 diabetes, compared with healthy subjects (26). A further alternative mechanism for lipid accumulation may be an increase in fatty acids transport and transporters. Several proteins expressed in skeletal muscle, such as long-chain acyl-coenzyme A synthases (e.g., fatty acid transport protein 1), fatty acid translocase/CD36, or the fatty acid-binding protein family are key factors that modulate fatty acid metabolism and uptake into muscle cells (27,28). In this regard, a relationship has been found between insulin resistance and increased fatty acids transporters (29,30) or increased rate of fatty acids uptake (29). By way of illus-tration, it has been previously shown that fatty acid transport protein 1 knockout mice are protected from fat-induced accumulation of fatty acyl-coenzyme A and insulin resis-tance in skeletal muscle (31).
Taken together, present results indicate that the cross-talk between adipose tissue and skeletal muscle plays a key role in the prevention and induction of metabolic abnormalities, such as muscle mitochondrial dysfunction or insulin resis-tance. This cross-talk involves changes in NEFA metabo-lism but also probably alterations in the production of some adipocytokines or inflammatory factors. The chronological study shows that the decline in muscle mitochondrial func-tions occurs late within the oxidative muscle, after impair-ment in glucose and lipid homeostasis has occurred. This suggests that mitochondria might be considered as victims of excess energy and fat delivery and that their role in the predisposition to insulin resistance is mainly due to an
inability to face prolonged excess fat delivery. Indeed, be-fore being a “victim,” muscle mitochondrial OXPHOS ac-tivity first positively adjusts to excess energy and fat deliv-ery and significantly contributes to limit the diet-induced metabolic disorders. This confirms that any strategy aiming at stimulating muscle mitochondrial OXPHOS activity is a pertinent strategy for management of body weight and pre-vention of metabolic disorders such as insulin resistance, in conjunction with a reduction in fat and energy intake. All things considered, our longitudinal study supports the hy-pothesis that mitochondrial dysfunction is not the primary cause of lipid accumulation and insulin resistance within skeletal muscle.
Acknowledgments
We thank Alexandre Teynie for skillful technical assis-tance and Laurence Kay, Monique Malgat, Valdur Saks, and Jean-Pierre Mazat for valuable assistance regarding the mastering of the permeabilized fiber technique. This work has received support from INRA (Institut National de la Recherche Agronomique) and from ATC Nutrition INRA/ INSERM.
References
1. Kelley DE. Overview: what is insulin resistance? Nutr Rev. 2000;58:S2–3.
2. Kelley D, He J, Menshikova E, Ritov V. Dysfunction of mitochondria in human skeletal muscle in type 2 diabetes.
Diabetes. 2002;51:2944 –50.
3. Patti ME, Butte AJ, Crunkhorn S, et al. Coordinated re-duction of genes of oxidative metabolism in humans with insulin resistance and diabetes: potential role of PGC1 and NRF1. Proc Natl Acad Sci U S A. 2003;100:8466 –71. 4. Petersen KF, Dufour S, Befroy D, Garcia R, Shulman GI.
Impaired mitochondrial activity in the insulin-resistant off-spring of patients with type 2 diabetes. N Engl J Med. 2004; 350:664 –71.
5. Petersen KF, Dufour S, Shulman GI. Decreased insulin-stimulated ATP synthesis and phosphate transport in muscle of insulin-resistant offspring of type 2 diabetic parents. PLoS
Med. 2005;2:e233.
6. Ritov VB, Menshikova EV, He J, Ferrell RE, Goodpaster
BH, Kelley DE. Deficiency of subsarcolemmal mitochondria
in obesity and type 2 diabetes. Diabetes. 2005;54:8 –14. 7. Simoneau JA, Kelley DE. Altered glycolytic and oxidative
capacities of skeletal muscle contribute to insulin resistance in NIDDM. J Appl Physiol. 1997;83:166 –71.
8. Kim JY, Nolte LA, Hansen PA, et al. High-fat diet-induced muscle insulin resistance: relationship to visceral fat mass.
Am J Physiol Regul Integr Comp Physiol. 2000;279:R2057–
65.
9. Mootha VK, Lindgren CM, Eriksson KF, et al. PGC-1alpha-responsive genes involved in oxidative phosphoryla-tion are coordinately downregulated in human diabetes. Nat
Genet. 2003;34:267–73.
10. Shulman GI. Cellular mechanisms of insulin resistance.
11. Schrauwen P, Hesselink MK. Oxidative capacity, lipotoxic-ity, and mitochondrial damage in type 2 diabetes. Diabetes. 2004;53:1412–7.
12. Schrauwen P, Wagenmakers AJ, van Marken Lichtenbelt
WD, Saris WH, Westerterp KR. Increase in fat oxidation on
a high-fat diet is accompanied by an increase in triglyceride-derived fatty acid oxidation. Diabetes. 2000;49:640 – 6. 13. Petersen KF, Shulman GI. Etiology of insulin resistance.
Am J Med. 2006;119:S10 – 6.
14. Iossa S, Mollica MP, Lionetti L, Crescenzo R, Botta M,
Liverini G. Skeletal muscle oxidative capacity in rats fed
high-fat diet. Int J Obes Relat Metab Disord. 2002;26:65–72. 15. Cortez MY, Torgan CE, Brozinick JT Jr, Ivy JL. Insulin resistance of obese Zucker rats exercise trained at two differ-ent intensities. Am J Physiol. 1991;261: E613–9.
16. Storlien LH, James DE, Burleigh KM, Chisholm DJ,
Krae-gen EW. Fat feeding causes widespread in vivo insulin
resis-tance, decreased energy expenditure, and obesity in rats. Am J
Physiol. 1986;251:E576 – 83.
17. Susini C, Lavau M. In-vitro and in-vivo responsiveness of muscle and adipose tissue to insulin in rats rendered obese by a high-fat diet. Diabetes. 1978;27:114 –20.
18. Chanseaume E, Malpuech-Brugere C, Patrac V, et al. Diets high in sugar, fat, and energy induce muscle type-specific adaptations in mitochondrial functions in rats. J Nutr. 2006;136:2194 –200.
19. Saks VA, Veksler VI, Kuznetsov AV, et al. Permeabilized cell and skinned fiber techniques in studies of mitochondrial function in vivo. Mol Cell Biochem. 1998;184:81–100. 20. Ouhabi R, Boue-Grabot M, Mazat JP. Mitochondrial ATP
synthesis in permeabilized cells: assessment of the ATP/O values in situ. Anal Biochem. 1998;263:169 –75.
21. Moyes CD. Controlling muscle mitochondrial content. J Exp
Biol. 2003;206:4385–91.
22. Sparks LM, Xie H, Koza RA, et al. A high-fat diet coordi-nately downregulates genes required for mitochondrial oxida-tive phosphorylation in skeletal muscle. Diabetes. 2005;54: 1926 –33.
23. Richardson DK, Kashyap S, Bajaj M, et al. Lipid infusion decreases the expression of nuclear encoded mitochondrial genes and increases the expression of extracellular matrix genes in human skeletal muscle. J Biol Chem. 2005;280:10290 –7. 24. Kraegen EW, Clark PW, Jenkins AB, Daley EA, Chisholm
DJ, Storlien LH. Development of muscle insulin resistance
after liver insulin resistance in high-fat-fed rats. Diabetes. 1991;40:1397– 403.
25. Kraegen EW, James DE, Storlien LH, Burleigh KM,
Ch-isholm DJ. In vivo insulin resistance in individual peripheral
tissues of the high fat fed rat: assessment by euglycaemic clamp plus deoxyglucose administration. Diabetologia. 1986; 29:192– 8.
26. Hojlund K, Frystyk J, Levin K, Flyvbjerg A, Wojtaszewski
JF, Beck-Nielsen H. Reduced plasma adiponectin
concentra-tions may contribute to impaired insulin activation of glyco-gen synthase in skeletal muscle of patients with type 2 diabe-tes. Diabetologia. 2006;49:1283–91.
27. Abumrad N, Coburn C, Ibrahimi A. Membrane proteins implicated in long-chain fatty acid uptake by mammalian cells: CD36, FATP and FABPm. Biochim Biophys Acta. 1999; 1441:4 –13.
28. Bonen A, Miskovic D, Kiens B. Fatty acid transporters (FABPpm FAT, FATP) in human muscle. Can J Appl Physiol. 1999;24:515–23.
29. Chabowski A, Chatham JC, Tandon NN, et al. Fatty acid transport and FAT/CD36 are increased in red but not in white skeletal muscle of ZDF rats. Am J Physiol Endocrinol Metab. 2006;291:E675– 82.
30. Pelsers MM, Lutgerink JT, Nieuwenhoven FA, et al. A sensitive immunoassay for rat fatty acid translocase (CD36) using phage antibodies selected on cell transfectants: abundant presence of fatty acid translocase/CD36 in cardiac and red skeletal muscle and up-regulation in diabetes. Biochem J. 1999;337:407–14.
31. Kim JK, Gimeno RE, Higashimori T, et al. Inactivation of fatty acid transport protein 1 prevents fat-induced in-sulin resistance in skeletal muscle. J Clin Invest. 2004;113: 756 – 63.