HAL Id: insu-03085861
https://hal-insu.archives-ouvertes.fr/insu-03085861
Submitted on 22 Dec 2020
HAL is a multi-disciplinary open access
archive for the deposit and dissemination of sci-entific research documents, whether they are pub-lished or not. The documents may come from teaching and research institutions in France or abroad, or from public or private research centers.
L’archive ouverte pluridisciplinaire HAL, est destinée au dépôt et à la diffusion de documents scientifiques de niveau recherche, publiés ou non, émanant des établissements d’enseignement et de recherche français ou étrangers, des laboratoires publics ou privés.
Crichton, Fabrice Gaillard
To cite this version:
T. Hammouda, Geeth Manthilake, P. Goncalves, J. Chantel, J. Guignard, et al.. Is there a global carbonate layer in the oceanic mantle?. Geophysical Research Letters, American Geophysical Union, 2021, 48 (2), pp.e2020GL089752. �10.1029/2020GL089752�. �insu-03085861�
1
Is there a global carbonate layer in the oceanic mantle?
2 3
T. HAMMOUDA1, G. MANTHILAKE1, P. GONCALVES2, J. CHANTEL1,3*, J.
4
GUIGNARD4†, W. CRICHTON4, and F. GAILLARD5
5 6 7
1Laboratoire Magmas et Volcans, Université Clermont-Auvergne, 6 avenue Blaise Pascal, 63178 8
Aubière, France
9
2UMR 6249 Chrono-environnement, Université de Bourgogne Franche-Comté, France 10
3Department of Earth, Environmental, and Planetary Sciences, Case Western Reserve University, 11
Cleveland, OH 44106, USA
12
4ESRF, 71 avenue des Martyrs, F-38000 Grenoble, France 13
5ISTO, 5 rue de la Férollerie, F-45100 Orléans cedex 2, France 14
15
Corresponding author: Tahar Hammouda ([email protected])
16 17
*now at Unité Matériaux et Transformations, Université Lille1, 59655 Villeneuve d'Ascq
18
France.
19
†now at Géosciences Environnement Toulouse (GET), OMP-UPS-CNRS, 14 Avenue E. Belin,
20 31400 Toulouse, France. 21 22 23 Key Points: 24
• CO2 release during subduction and its transfer to the mantle initiates compression melting 25
at the lithosphere-asthenosphere boundary.
26
• Dissolution-precipitation driven melt porous flow results in migration of carbonatite melt
27
away from the mantle wedge.
28
• Steady supply of carbonated material by subduction may build up a global carbonatite
29
melt layer at the top of the oceanic asthenosphere.
30 31
Abstract
32
Previous modeling of carbonate subduction by high-pressure experimentation has allowed to
33
propose scenarios for bulk carbon return to the mantle, but the detailed transfer mechanisms have
34
seldom been studied. We monitored carbonate – silicate reactions by combining high-pressure
35
experiments and synchrotron-based x-ray diffraction. Carbonates break down at moderate
36
pressure and high temperature and CO2 is trapped at grain boundaries. Further isothermal 37
compression yields melting, which may control continuous carbon introduction, first in the
38
mantle wedge, and next, away from the wedge. Carbon presence has been discussed in a variety
39
of magmatic contexts, under the oceanic lithosphere (hotspots, petit spots, fossil ridges). We
40
suggest the presence of a global carbon-rich layer under the oceanic lithosphere that is steadily
41
fed by subduction processes. This layer can be the source of mechanical weakening of the
42
lithosphere-asthenosphere boundary under the oceans. Therefore, carbon-induced compression
43
melting may be a key mechanism of modern-style plate tectonics.
44 45
Plain Language Summary
46
Plate tectonics, the mechanism by which rigid plates migrate atop the Earth’s mantle, necessitate
47
mechanical decoupling between the plates (lithosphere) and the underlying mantle
48
(asthenosphere). The presence of a melt layer acting as a lubricating agent has been discussed on
49
the basis of geophysical evidence, such as provided by seismic and electrical conductivity data
50
analysis. In this study, we show that this layer can be fueled by the melting of carbonate-rich
51
material carried down by oceanic plates returning to the mantle at subduction zones. This process
52
is continuous because the Earth is an active planet with permanent seismic and volcanic activity.
53
It may have been going on for billions of years and may have been fundamental for the initiation
54
of plate tectonics.
55 56
1 Introduction
57
Continuous volcanic activity causes the escape of volatiles from the mantle. This
58
degassing process is partly counterbalanced by the recycling of volatiles at subduction zones,
59
including water, carbon dioxide, and noble gases (Poli & Schmidt, 1995; Zhang & Zindler, 1993;
60
Sleep et al., 2012; Jackson et al., 2013). Volatile compounds are introduced in the mantle with
61
altered oceanic crust at subduction zones.
62
Previous studies showed that breakdown of water- and hydroxyl-bearing minerals
63
releases important quantities of water-rich fluids at depths corresponding to fore-arc to back-arc
64
regions (Schmidt & Poli, 1995). However, the importance of CO2-rich fluids is increasingly 65
recognized and CO2 may be as important as H2O in petrogenetic processes (Molina & Poli, 2000; 66
Gorman et al., 2006). CO2-rich fluid released from the slab may be introduced into the mantle 67
wedge, via a complex process that could involve crack propagation, as discussed by Brenan &
68
Watson (1988).
69
At depths corresponding to pressures lower than 2.5 GPa (ca. 75 km), the addition of CO2 70
is not expected to cause mantle melting because the the pressure is too low for carbon to initiate
71
melting (the carbonate ledge, as defined by Eggler, 1987). In addition, Watson et al. (1990)
72
showed that H2O-CO2 mixed fluids have very poor wetting properties, even at low CO2 content. 73
Therefore, if present, CO2-rich fluids do not have a tendency to form an interconnected network 74
and cannot migrate by porous flow. This absence of mobility may be the cause of the common
75
occurrence of CO2 fluid inclusions in mantle minerals (Roedder, 1965, and the recent review by 76
Frezzotti and Thouret, 2014). By remaining locked at grain boundaries, CO2-rich fluids create 77
CO2-impregnated domains confined at the slab/mantle wedge interface, resulting in the 78
formation of CO2-enriched peridotite bodies as discussed by Scambelluri et al. (2016). Because 79
of the viscous coupling of the plunging slab and the wedge, this modified mantle region may be
80
entrained to greater depths. The burial of this oceanic plate-borne carbonated material is near
81
isothermal because in this region, the isotherms are sub-parallel to the slab mantle interface
82
(Syracuse et al., 2010).
83
Here we explore the outcome of having CO2-rich fluids at the slab-mantle interface, by 84
using high-pressure in-situ experiments combined with synchrotron radiation. Compared to
85
quench studies, our approach allows for testing a global scenario of carbon delivery and reaction
86
at mantle conditions by reproducing pressure-temperature path of subduction, coupled with
87
continuous x-ray monitoring. A major point that is tackled is whether, once formed, CO2-rich 88
fluids escape the system or remain and act as fluxing agents at high pressure. As will be
89
discussed, the possibility for the dissemination of carbon-bearing material at the
lithosphere-90
asthenosphere boundary depends on the answer to this question.
91 92
2 Materials and Methods
93
Experiments were performed using the 2000 ton multianvil press operated on ID06
94
beamline of the European Synchrotron Radiation Facility, following the approach used in
95
Hammouda et al. (2014). The details on the experimental and analytical methods are provided in
96
the supporting-information file. We used a synthetic model system with almost purely magnesian
97
endmember minerals. Compared to natural systems, this experimental strategy results in shifting
arrangement of the phase diagram (Hammouda & Keshav, 2015). Two experimental runs are
100
reported. The first one was designed to investigate CO2-fluid release, whereas the second one 101
explored further reactions involving the fluid. The latter pressure-temperature path is illustrated
102
in Figure 1 and the corresponding x-ray diffraction patterns are shown in Figure 2.
103
A mixture of [enstatite + dolomite] was first compressed and heated, up to 2.25 GPa and
104
977°C (Figure 1). Enstatite and dolomite diffraction lines are visible on the first pattern of Figure
105
2. Further heating to 1100°C at about the same pressure results in dolomite diffraction line
106
disappearing, while diopside lines start growing. If present, forsterite lines are faint. They are
107
visible only after further heating to 1150°C. This combination of diffraction lines growth
108
(diopside and forsterite) and collapse (dolomite) attests for crossing of the following
109
decarbonation reaction
110 111
Enstatite + Dolomite = Diopside + Forsterite + CO2. 112
113
The texture resulting from decarbonation, with isolated pores (previously filled with CO2 114
fluid) is illustrated in Figure 3A, which presents the result of the experiment that was interrupted
115
at this stage.
116
Heating up to over 1300°C results in no major change in the diffraction pattern. Further
117
compression with the temperature kept around 1330°C yields no change up to 2.71 GPa.
118
However, while increasing pressure from 2.71 to 3.02 GPa, diopside and forsterite diffraction
119
lines collapse, and enstatite lines start growing (Figure 2), whereas dolomite diffraction lines
120
were not observed. This is an indication that the melting reaction has been crossed (Figure 1). In
121
this experiment, the melt presence is difficult to demonstrate on the sole basis of diffraction
122
patterns. However, after the experiment was quenched, the resulting assemblage was studied by
123
scanning electron microscopy. The corresponding texture (Figure 3B) shows evidence for
124
melting. In this experiment the melting of a silicate + CO2 assemblage has been directly 125
monitored and demonstrated to occur solely as an effect of compression at constant temperature.
126
The crossing of the solidus boundary defines the carbonate ledge (Eggler, 1978; 1987). Melting
127
is a result of fluid CO2 remaining trapped in the solid silicate assemblage. 128
129
3 Discussion
130
In our experimental simulation, the carbonatitic melt is produced at conditions
131
corresponding to a CO2-impregnated mantle wedge crossing the carbonate ledge. Therefore, the 132
ledge acts as a melting curve at about 80 km depth, in the context of subduction zones. This is a
133
situation wherein silicate + CO2 melting occurs because of compression, at nearly isothermal 134
conditions. Usually, melting in the mantle is associated with decompression in upwelling
135
plumes, either at mid-ocean ridges or at hot spots, because in most cases, melting is accompanied
136
by volume expansion. Otherwise, melting can be caused by the introduction of a fluxing agent,
such as H2O in the case of arc magmatism. Here we illustrate an occurrence of melting 138
associated with downwelling, because of the peculiarities of the silicate + CO2 phase diagram. 139
The excellent wetting properties of carbonatitic melts (dihedral angles < 30 °, Hunter &
140
McKenzie, 1989; Watson et al., 1990; Hammouda & Laporte, 2000) and their very low viscosity
141
(Kono et al., 2014) at mantle conditions allow for their very efficient percolation into the
142
surrounding melt-free mantle, provided they are not reduced to graphite (Stagno et al., 2013).
143
Therefore, at about 80 km depth, a region of carbonated melt-impregnated mantle is formed near
144
the slab (Figure 4). This modified mantle may be entrained to greater depths because of the
145
coupling between the plate and the mantle. However, the melt may also spread horizontally,
146
because carbonatitic melts have a spontaneous tendency to infiltrate the melt-free mantle by
147
surface-energy minimization. This migration, which is driven by dissolution-precipitation, is
148
faster than mantle flow and can operate even against gravity (Hammouda & Laporte, 2000).
149
Decoupling between melt and mantle movement is thus expected, contrary to the CO2 fluid-150
mantle situation, and a carbonatite-rich region extending far from the slab can develop in the
151
mantle wedge and further away from the slab, at about 80 km depth. This carbonatite-rich
152
domain is limited toward shallow levels by the ledge. It is limited toward greater depth (about
153
150 km) by carbon reduction (Stagno et al., 2013; Hammouda & Keshav, 2015).
154
On the basis of thermodynamic modeling, previous studies (Gorman et al., 2006) have
155
shown that high CO2 contents should be expected in fluids produced in a hot subduction 156
environment, which is precisely the case of the Cascadia area. Here, we suggest that highly
157
mobile carbonatitic melts, originating from the encounter of released CO2-rich fluids with the 158
mantle wedge peridotites are the cause of the observed high conductivity of the Cascadia
159
subduction zone. At a larger scale, this mechanism could be responsible for delivering
carbon-160
rich material at the base of the lithosphere, creating a shallow mantle carbon reservoir (Sleep,
161
2003; Kelemen & Manning). If reheated, this metasomatized mantle region could be the source
162
of kimberlite-carbonatite magmatism such as observed in North America along a line parallel to
163
the western paleo-subduction margin of the North American plate (Duke et al., 2014) or along
164
the North-China craton (Chen et al., 2016). After spreading at the bottom of the lithosphere, the
165
CO2-bearing melts may be involved in the source of petit spots, as recently discussed by 166
Machida et al. (2017). It may also be anticipated that carbonated material that would escape
167
remobilization at petit spots could be buried during a later subduction event. There,
carbon-168
enriched material is located at the back of the subducting slab (Figure 4). It is therefore separated
169
from the hot mantle wedge by the thickness of the subducting lithosphere. This two-stage
170
process is a much more efficient way of introducing carbon to great depth because the thermal
171
regime is cooler than when carbon is carried on top of the plate.
172
The amount and composition of the fluid released by the altered oceanic crust are highly
173
dependent on the subduction pressure-temperature regime. The recent thermo-mechanical
174
models (Syracuse et al., 2010) point toward paths hotter than earlier estimates mainly because of
175
the coupling between the slab and the mantle wedge. With the new models, it is possible that
176
even cool subduction paths also allow for the release of carbon-bearing fluids. Earlier
177
experimental studies have shown that the depth of the carbonate ledge depends only slightly on
178
the CO2/H2O ratio (Hammouda & Keshav, 2015). Therefore, the presence of a layer of 179
carbonatite-impregnated mantle wedge may be a general feature of subduction zones, assuming
that carbonated material (altered crust or sediments) is carried by the plate, which is a likely 181 situation. 182 183 4 Conclusions 184
The release of CO2 during the subduction of altered oceanic crust and its transfer to the 185
mantle wedge initiates compression melting at the lithosphere-asthenosphere boundary. The melt
186
formed can migrate away from the mantle wedge by porous flow driven by
dissolution-187
precipitation at grain boundaries. Because subduction zones are continuously active on the scale
188
of the whole planet, the steady supply of carbonated material may build up a global carbonatite
189
melt layer at the top of the asthenosphere.
190
Recent petrological and geophysical investigations lend support to the presence of a
191
carbon-rich melt layer at the oceanic lithosphere/asthenosphere boundary, away from mid-ocean
192
ridge axes. Petrological evidence comes from the low-degree melts in spreading centers (Zhang
193
et al., 2017), from petit spot volcanism (Machida et al., 2017) and from metasomatism in the
194
source of hot spots (Hauri et al., 1993). Further evidence of melt presence at the
lithosphere-195
asthenosphere boundary arises from seismic data (Schmerr, 2012) and these melt physical
196
properties strongly suggest a carbonate-rich composition (Sifré et al., 2014). Our results show
197
that melt trapped at this depth may originate, not only from upwelling regions (Liu et al., 2020)
198
but also from down-going oceanic plates. This possibility is further substantiated by electrical
199
conductivity anomalies observed in the Cascadia subduction zone (Soyer & Unsworth, 2006). So
200
far, serpentinized mantle, caused by water-rich fluid circulation, has been invoked, but serpentine
201
presence cannot explain high conductivity (Guo et al., 2011).
202
Carbonate-based sediments are present in Archean terranes, and 3.7 Ga old stromatoliths
203
have been reported from the Isua region in Greenland (Nutman et al., 2016). Recycling of
204
material of crustal origin in modern type subduction started at least about 3.2 billion years ago
205
(Næraa et al., 2012). Given that the hot subduction regime was rather the rule for the young
206
Earth, it can be anticipated that the process of sub-lithospheric impregnation by carbonate melts
207
has been active very early in the planet history. It may have aided mechanical decoupling at the
208
lithosphere-asthenosphere boundary, triggering modern-style plate tectonics.
209 210
Acknowledgments
211
This work was financially supported by the European Synchrotron Radiation Facility
212
(ESRF proposal ES-25). Help by J.-L. Devidal on the electron microprobe and by J.-M. Hénot on
213
the SEM are gratefully acknowledged. This research was partly supported by the French
214
Government Laboratory of Excellence initiative n°ANR-10-LABX-0006, the Région Auvergne
215
and the European Regional Development Fund. FG is supported by the European Research
216
Council (ERC grant number 279790) and the French agency for research (ANR project #2010
217
BLAN62101). This is Laboratory of Excellence ClerVolc contribution 437.
The authors comply with AGU's data policy, and the x-ray diffraction data of this study are
219
available in the general repository Figshare (doi:10.6084/m9.figshare.12464687 ). The authors
220
declare no competing financial interests.
221 222
References
223 224
Brenan J.M., Watson E.B. (1988) Fluids in the lithosphere, 2. Experimental constraints on CO2 225
transport in dunite and quartzite at elevated P-T conditions with implications for mantle
226
and crustal decarbonation processes, Earth and Planetary Science Letters, 91, 141-158.
227
Chen, C.F., Liu, Y.S., Foley, S.F., Ducea, M.N., He, D.T., Hu, Z.C., Chen, W., Zong, K.Q.
228
(2016) Paleo-Asian oceanic slab under the North China craton revealed by carbonatites
229
derived from subducted limestones, Geology, 44 (12), 1039–1042.
230
Dalton J.D., Presnall D.C. (1998) Carbonatitic melts along the solidus of model lherzolite in the
231
system CaO-MgO-Al2O3-SiO2-CO2 from 3 to 7 GPa, Contributions to Mineralogy and 232
Petrology, 131, 123-135. 233
Duke, G.I., Carlson, R.W., Frost, C.D., Hearn, B.C.,Jr., Eby, G.N. (2014) Continent-scale
234
linearity of kimberlite–carbonatite magmatism, mid-continent North America, Earth and
235
Planetary Science Letters, 403, 1-14. 236
Eggler D.H. (1978) The effect of CO2 upon partial melting of peridotite in the system Na2 O-237
CaO-Al2O3-MgO-SiO2- CO2 to 35 kb, with an analysis of melting in a peridotite-H2 O-238
CO2 system, American Journal of Science, 278, 305-434. 239
Eggler D.H. (1987) Discussion of recent papers on carbonated peridotite, bearing on
240
metasomatism and magmatism: an alternative. Earth and Planetary Science Letters, 82,
241
398-400.
242
Frezzotti, M.-L., Thouret, J.L.R. (2014) CO2, carbonate-rich melts, and brines in the mantle, 243
Geoscience Frontiers, 5, 697-710. 244
Gorman, P.J., Kerrick, D.M., Conolly, J.A.D. (2006) Modeling open system metamorphic
245
decarbonation of subducting slabs, Geochemistry Geophysics Geosystems, 7, 4.
246
Guo, X., Yoshino, T., Katayama, I. (2011) Electrical conductivity anisotropy of deformed talc
247
rocks and serpentinites at 3 GPa, Physics of the Earth and Planetary Interiors, 188, 69–
248
81.
249
Hammouda, T., Chantel, J., Manthilake, G., Guignard, J., Crichton, W. (2014) Hot mantle
250
geotherms stabilize calcic carbonatite magmas up to the surface, Geology, 42, 911-914.
251
Hammouda T., Laporte D. (2000) Ultrafast mantle impregnation by carbonatite melts, Geology,
252
28, 283-285.
253
Hammouda T., Keshav S. (2015) Melting in the mantle in presence of carbon; review of
254
experiments and discussion on the origin of carbonatites, Chemical Geology, 418,
171-255
188.
Hanfland, M., Beister, H., Syassen, K., (1989) Graphite under pressure: equation of state and
257
first-order Raman modes, Physical Review B, 39, 12598–12603.
258
Hauri, E. H., Shimizu, N., Dieu, J. J., and Hart, S. R., 1993, Evidence for hotspot-related
259
carbonatite metasomatism in the oceanic upper mantle, Nature, 365, 221–227.
260
Hunter R.S., McKenzie D. (1989) The equilibrium geometry of carbonate melts in rocks of
261
mantle composition, Earth and Planetary Science Letters, 92, 347-356.
262
Jackson, C.R.M., Parman, S.W., Kelley, S.P., Cooper, R.F. (2013) Noble gas transport into the
263
mantle facilitated by high solubility in amphibole, Nature Geosc. 6, 562-565.
264
Kelemen, P.B, Manning, C.E. (2015) Reevaluating carbon fluxes in subduction zones, what goes
265
down, mostly comes up, Proceedings of the National Academy of Science, 112,
E3997-266
E4006.
267
Kono, Y., Kenney-Benson C., Hummer D., Ohfuji H., Park C., Shen G., Wang Y., Kavner A.,
268
Manning C.E. (2014) Ultralow viscosity of carbonate melts at high pressures, Nature
269
Communications, 5, 5091. 270
Liu, J., Hirano, N., Machida, S., Xia, Q., Tao, C., Liao, S., Liang, J., Li, W., Yang, W., Zhang,
271
G., Ding, T. (2020) Melting of recycled ancient crust responsible for the Gutenberg
272
discontinuity, Nature Communications, 11:172.
273
Machida, S., Kogiso, T., Hirano, N. (2017) Petit-spot as definitive evidence for partial melting in
274
the asthenosphere caused by CO2, Nature Communications, 8:14302. 275
Martin, A.M., Hammouda, T. (2011) Role of iron and reducing conditions on the stability of
276
dolomite + coesite between 4.25 and 6 GPa – a potential mechanism for diamond
277
formation during subduction, European Journal of Mineralogy, 23, 5-16.
278
Molina, J.F., and Poli S. (2000) Carbonate stability and fluid composition in subducted oceanic
279
crust: an experimental study on H2O-CO2-bearing basalts, Earth and Planetary Science 280
Letters, 176, 295-310. 281
Næraa, T, Scherstén A, Rosing M.T., Kemp A.I.S., Hoffmann J.E, Kokfelt T.F, Whitehouse M.J.
282
(2012) Hafnium isotope evidence for a transition in the dynamics of continental growth
283
3.2 Gyr ago, Nature 485, 627-630.
284
Nutman, A.P., Bennett, V.C., Friend C.R.L., Van Kranendonk, M.J., Chivas, A.R. (2016) Rapid
285
emergence of life shown by discovery of 3,700-million-year-old microbial structures,
286
Nature doi:10.1038/nature19355. 287
Petricek, V., Dusek, M., and Palatinus, L. (2006) Jana2006. The Crystallo- graphic Computing
288
System, Institute of Physics, Prague.
289
Poli, S, Schmidt, M.W. (1995) H2O transport and release in subduction zones: Experimental
290
constraints on basaltic and andesitic systems, Journal of Geophysical Research, 100,
291
22299-22314.
292
Roedder, E. (1965) Liquid CO2 inclusions in olivine-bearing nodules and phenocrysts from 293
basalts, American Mineralogist, 50, 1746-1782.
294
Scambelluri, M, Bebout, G.E., Belmonte, D., Gilio, M., Campomenosi, N., Collins, N., Crispini,
295
L. (2016) Carbonation of subduction-zone serpentinite (high-pressure ophicarbonate;
Ligurian Western Alps) and implications for the deep carbon cycling, Earth and
297
Planetary Science Letters, 441, 155-166. 298
Schmerr N. (2012) The Gutenberg Discontinuity: Melt at the Lithosphere-Asthenosphere
299
Boundary, Science, 335, 1380-1383.
300
Schmidt, M.W., Poli, S (1995) Experimentally based water budgets for dehydrating slabs and
301
consequences for arc magma generation, Earth and Planetary Science Letters, 163,
361-302
379.
303
Sifré, D., Gardés, E., Massuyeau, M., Hashim, L., Hier-Majumder, S., Gaillard, F. (2014)
304
Electrical conductivity during incipient melting in the oceanic low-velocity zone, Nature,
305
509, 81-85.
306
Sleep, N.H. (2009) Stagnant lid convection and carbonate metasomatism of the deep continental
307
lithosphere, Geochememistry Geophysics Geosystems 10:Q11010.
308
Sleep, N.H., Bird, D.K., Pope, E. (2012) Paleontology of Earth’s Mantle, Annual Review of
309
Earth and Planetary Science, 40, 277–300. 310
Soyer, W., Unsworth, M. (2006) Deep electrical structure of the northern Cascadia (British
311
Columbia, Canada) subduction zone: Implications for the distribution of fluids, Geology
312
34, 53-56.
313
Stagno, V., Ojwang, D.O., McCammon, C.A., Frost, D.J. (2013) The oxidation state of the
314
mantle and the extraction of carbon from Earth’s interior, Nature 493, 84-88.
315
Syracuse E.M., van Keken P.E., Abers G.A. (2010) The global range of subduction zone thermal
316
models, Physics of the Earth and Planetary Interiors, 183, 73-90.
317
Watson EB, Brennan JM, Baker DR (1990) Distribution of fluids in the continental mantle. In:
318
Mezies MA (ed) Continental Mantle, Clarendon Press, Oxford, pp 111-125.
319
Zhang G-L, Chen l-H, Jackson M G, Hofmann A W, Evolution of carbonated melt to alkali
320
basalt in the South China Sea, Nature Geoscience 10, 229–235 (2017).
321
Zhang Y, Zindler A (1993) Distribution and evolution of carbon and nitrogen in Earth and
322
Planetary Science Letters, 117, 331-345. 323
324 325
326
Figure 1. Pressure – temperature path followed during the compression melting experiment.
327
Phase relationships in the synthetic CaO-MgO-SiO2+CO2 system (solid red lines) drawn after 328
(Eggler, 1978). Univariant reactions are labeled according to the list displayed in the top
left-329
hand corner. Diamond symbols represent P – T conditions where phases have been identified,
330
using in-situ X-ray diffraction. Squares with numbers inside represent P – T conditions where
331
mineral transformations have been observed. Phase-in indicates that new diffraction peaks have
332
been observed, corresponding to the phase in question (except for melt). Arrows indicates
333
decrease or increase in diffraction line intensities of the corresponding phases. Melting is
334
deduced from these variations, as discussed in the main text, and confirmed by imaging of
335
quenched textures (see Fig.3). Major phase fields are indicated by underlined and italicized
336
labels. Abbreviations are: dol = dolomite; en = enstatite; di = diopside; fo = forsterite; V = vapor
337
(CO2); L = carbonate melt. 338
340
Figure 2. X-ray diffraction patterns recorded during the experiment. Units of x-ray intensity on
341
the count abscissa are arbitrary (a.u.) and patterns are offset vertically for clarity. Pressure and
342
temperature conditions are given for each pattern. Diagnostic diffraction lines for minerals are
343
indicated with arrows. Each pattern corresponds to a diamond symbol of Figure 1. Highlighted
344
patterns (in red) are evidence for decarbonation and melting.
345 346 347
348
Figure 3. Scanning electron images of the quenched experiment illustrating the processes
349
involved in compression melting. (A) Texture resulting from the decarbonation reaction dolomite
350
+ enstatite = diopside + forsterite + vapor. The presence of vapor is attested by the vacuoles
351
(arrows) surrounded by rims consisting of an intergrowth of diopside and forsterite. (B) Texture
352
resulting from the melting reaction diopside + forsterite + CO2 = enstatite + melt, producing a 353
carbonatitic liquid. The melt is disseminated at grain boundaries, throughout the sample.
354
Abbreviations are the same as those used in Figure 1, except for Carbo-Melt=quenched melt of
355
carbonatitic composition.
356 357 358
359
Figure 4. Summary of the proposed mechanism for the introduction and dissemination of
360
carbonate melts. (A) Carbonate melts produced by compression melting in front of the
361
subducting slab occur at depth between 100 and 150 km (yellow patch beneath the arc region).
362
The region for stable carbonatite melt (in light green) is bounded by the
Lithosphere-363
Astenosphere Boundary, where decarbonation occurs (LAB, dotted red line), on top, and the
364
redox front controlled by the EMOD/G equilibrium, below which the stable form of carbon is
365
graphite/diamond (dotted green line). Yellow arrows illustrate carbonatite migration away from
366
the subduction zone. Other yellow patches indicate region of carbonatite implication in
367
magmatism, such as spreading centers and hot spots (B), and petit spots (C). Vertical red thick
368
arrows represent oceanic magmatism where carbonate melts participate and may be extracted. In
369
panel (C), note that carbonate melt present at the back of the subducting plate can be introduced
370
to greater depth. Vertical blue thick arrows represent arc magmatism, with implication of
water-371
dominated fluids. Abbreviations are: dol = dolomite; en = enstatite; di = diopside; ol = olivine,
372
mst = magnesite.
0 1 2 3 4 400 600 800 1000 1200 1400 1600 1800 Temperature (°C) Pr essu re (G Pa) fo en di L (3) di + fo + CO2 = en + L (4) di + fo + CO2 = pig + L (5) di + dol + CO2 = en + L (1) (2) (3) (4) (5) fo-di-en-CO2 di, fo en fo-in en+dol (melt-in) 1 2 3 di-in 1 2 3 Melting BEGIN END en dol di fo CO 2 en L di fo CO 2
6
7
8
9
10
11
0
5
10
15
20
25
01(
st
nu
oc
3).
u.
a
6
7
8
9
10
11
2 θ (°)
0
5
10
15
20
25
01(
st
nu
oc
3).
u.
a
2.25 GPa, 977 °C 3.4 GPa, 1545 °C 3.71 GPa, 1650 °C 3.26 GPa, 1500 °C 3.02 GPa, 1323 °C 2.71 GPa, 1337 °C 2.32 GPa, 1330 °C 2.14 GPa, 1332 °C 2.23 GPa, 1150 °C 2.18 GPa, 1100 °C QUENCH Dol Dol (-) Di (+) Di (+) Fo (+) Di+Fo (+) Fo (+) Di+Fo (+) Fo (+) En (+) Di (-) Di (-) En (+) Fo (-) Di+Fo (-) Fo (-) DECARBONATION MELTINGdi
fo
en
V
20 µm
dol + en = di + fo + CO
2
V
A
fo
en
di
Carbo-Melt
20 µm
di + fo + CO
2
= en + Carbo-Melt
B
2. EXTRACTION volcanism subduc ting pla te 100 km 150 km 0 km volcanism (Pacific plate) redox-front: en + mst = ol + C + O2 (EMOD/G) Vertical scale exagerated
carbonate melt migration carbonate melt extraction
subduc ting pla
te
preserved at fossil ridge
(S-China sea) (Cape Verde; Pacific)volcanism
plate-flexure
LAB = decarbonation-front: en + dol = ol + di + CO2
Tahar HAMMOUDA1, Geeth MANTHILAKE1, Philippe GONCALVES2, Julien CHANTEL1,3*, Jérémy GUIGNARD4**, Wilson CRICHTON4, Fabrice GAILLARD5
Supplementary material: Methods
High-pressure experiment design
Experiments were performed using the 2000 ton multianvil press operated on ID06 beam line of the European Synchrotron Radiation Facility, following the approach used in Hammouda et al. (2014). The difference from quench experiments is that several data points were collected during the same experiment. The conditions investigated are shown on Figure 1 (main text). As pressure and temperature were varied, the phases present in the experiment were identified using X-ray diffraction (see below).
In order to introduce CO2 and have it react with mantle mineral assemblage a mixture of
natural dolomite (DNY, Hammouda et al. (2014)) and synthetic enstatite was used. Heating of dolomite + enstatite at pressure below 2.7 GPa produces CO2 vapor phase, according to the
reaction decarbonation reaction:
Enstatite + Dolomite = Diopside + Forsterite + CO2.
This reaction has been studied, together with other important reactions in the peridotite + CO2 synthetic system (Eggler, 1978), as illustrated in Figure 1 (main text). Formation of
The starting mixtures were loaded in graphite capsules. The samples were compressed using 18-mm edge length Cr-doped MgO octahedra as pressure transmitting media that were squeezed with 11 mm edge length tungsten carbide anvils (18/11 assembly). Heating was performed using a stepped graphite furnace. The sample temperature was determined using a W-Re (5-26) thermocouple that was separated from the graphite capsule by a thin MgO disk. No correction was applied for the effect of pressure on the e.m.f. Pressure was determined using the cell parameters of the graphite capsule material and the equation of state of Hanfland et al. (1989). Error on temperature and pressure are considered to be about 50 °C and 0.2 GPa, respectively. No water was added to the starting material. The experiment is therefore considered to be nominally anhydrous, although we cannot exclude the presence of small quantities of adsorbed water in the starting material.
X-ray data collection
We used in situ X-ray diffraction for phase identification at high pressure and high temperature. Monochromatic X-ray diffraction patterns (λ=0.38745 Å) were collected with a Tl:NaI Bicron scintillator detector, scanning on a large-radius pseudorotation over a 2θ angular range 6-11°, with step size 0.01°. Two sets of adjustable slits were used to define the volume of the diffracting sample, and remove diffraction signal from the up- and downstream gaskets and furnace. Angular calibration of the instrument was performed before the experiment against NIST standard LaB6 SRM660a. X-ray diffraction patterns were processed
by full profile LeBail refinements with the Jana2006 software package (Petricek et al., 2006).
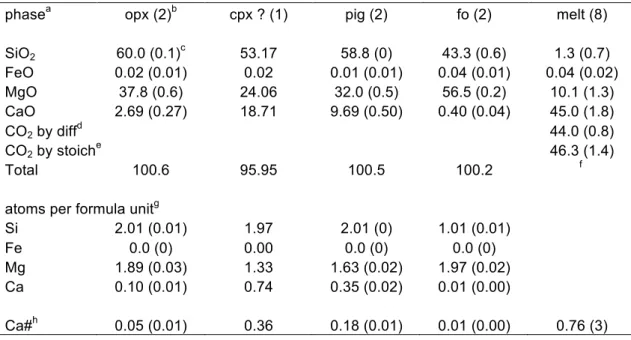
phases were performed using a CAMECA SX100 electron microprobe. Accelerating voltage was 15 kV and probe current on the Faraday cup was 15 nA. We used focused beam for minerals and defocused beam for quenched melts. In the latter case, beam diameter depended on the size of quenched melt pockets (usually, a few micrometers), and beam damage is difficult to avoid. The following standards were used: wollastonite for Ca and Si, olivine for Mg, magnetite for Fe. Carbon was determined by stoichiometry for the carbonates, and it was estimated by difference to 100% on analysis total for the quenched melt, and by stoichiometry, assuming that all cations (except Si) are bound to carbonate. As can be seen in
Table ST1, the agreement between of the two methods is satisfactory (within 5% relative),
given the difficulty in analyzing small quenched carbonate melt pools.
Electron microprobe analyses of quenched phases are displayed in Table ST1. Forsterite has end-member composition, while enstatite contains a slight amount of calcium (about 0.1 atom per formula unit, on the basis of 6 oxygen atoms). Two clinopyroxene types are found. One is close to diopside composition, while the other is of pigeonite type. We note that the diopside-like pyroxene is deficient in Ca, with 1.33 Mg and 0.74 Ca atoms per formula unit. This deficit can be attributed either to Ca partitioning in the melt (melt has Ca/(Ca+Mg) > 1, see Table ST1) or in the vapor phase, as suggested by Martin and Hammouda (2011). Melt composition varies among the different analytical spots. Variations are found for SiO2 content
and for Ca / (Ca+Mg) atomic ratios (Ca#). Given the difficulty encountered while analyzing the quenched melt, it is not clear whether this observation reflects true compositional zoning, contamination by adjacent silicate minerals during analysis, or modification during quenching. In the absence of large separated quenched melt pools, it is not possible to
Supplementary references
Dalton J.D., Presnall D.C. (1998) Carbonatitic melts along the solidus of model lherzolite in the system CaO-MgO-Al2O3-SiO2-CO2 from 3 to 7 GPa, Contrib. Mineral. Petrol. 131,
123-135.
Eggler D.H. (1978) The effect of CO2 upon partial melting of peridotite in the system Na2
O-CaO-Al2O3-MgO-SiO2- CO2 to 35 kb, with an analysis of melting in a peridotite-H2O-CO2
system, Am. J. Sci. 278, 305-434.
Hammouda, T., Chantel, J., Manthilake, G., Guignard, J., Crichton, W. (2014) Hot mantle geotherms stabilize calcic carbonatite magmas up to the surface, Geology 42, 911-914. Hanfland, M., Beister, H., Syassen, K., (1989) Graphite under pressure: equation of state and
first-order Raman modes, Phys. Rev. B, v. 39, p. 12598–12603.
Martin, A.M., Hammouda, T. (2011) Role of iron and reducing conditions on the stability of dolomite + coesite between 4.25 and 6 GPa – a potential mechanism for diamond formation during subduction, Eur. J. Mineral. 23, 5-16.
Petricek, V., Dusek, M., and Palatinus, L., 2006, Jana2006. The Crystallo- graphic Computing System, Inst. of Phys., Prague.
Table 1: Average phase composition obtained by electron microprobe analysis.
phasea opx (2)b cpx ? (1) pig (2) fo (2) melt (8)
SiO2 60.0 (0.1)c 53.17 58.8 (0) 43.3 (0.6) 1.3 (0.7) FeO 0.02 (0.01) 0.02 0.01 (0.01) 0.04 (0.01) 0.04 (0.02) MgO 37.8 (0.6) 24.06 32.0 (0.5) 56.5 (0.2) 10.1 (1.3) CaO 2.69 (0.27) 18.71 9.69 (0.50) 0.40 (0.04) 45.0 (1.8) CO2 by diffd 44.0 (0.8) CO2 by stoiche 46.3 (1.4) Total 100.6 95.95 100.5 100.2 f
atoms per formula unitg
Si 2.01 (0.01) 1.97 2.01 (0) 1.01 (0.01) Fe 0.0 (0) 0.00 0.0 (0) 0.0 (0) Mg 1.89 (0.03) 1.33 1.63 (0.02) 1.97 (0.02) Ca 0.10 (0.01) 0.74 0.35 (0.02) 0.01 (0.00) Ca#h 0.05 (0.01) 0.36 0.18 (0.01) 0.01 (0.00) 0.76 (3) Notes:
aphase abbreviations are: opx=orthopyroxene, cpx?=clinopyroxene not confirmed, pig=pigeonite
(Ca-poor clinopyroxene), fo=forsterite, melt=quenched carbonatitic melt.
bnumber in brackets indicated the number of analyses performed for each phase. cnumber in bracket next to composition indicates 1 standard deviation.
dCO
2 calculated by difference to 100%, using the sum of the other oxides.
eCO
2 calculated by stoichiometry, assuming that all cations (except Si) are bound to carbonate. fno total is given because CO
2 is not directly analyzed.
gatoms per formula units are calculated assuming the following number of oxygen: pyroxene=6,
forsterite=4.