CONFLICT AND COOPERATION IN WATERSHED MANAGEMENT: CASE STUDY OF METROPOLITAN BOSTON'S WATER SUPPLIES
by
CHRISTINE L. ROBERTS
B.A., University of California (1986)
Submitted to the Department of Urban Studies and Planning in Partial Fulfillment of the Requirements for the Degree of
MASTERS IN CITY PLANNING
at the
Massachusetts Institute of Technology June 1990
(
Christine L. Roberts, 1990. All rights reserved The author hereby grants to MIT permission to reproduce and to distribute copies of this thesis in whole or in part.Signature of Author
Department of Urban Studies and Planning May, 1990
Certified by - ~ -- I
H. Patricia Hynes Professor, De re t of,.9%banAStud'es and Planning
TIie G supervisor Accepted by M ,ASSACHUSTTS INST!'uiE OF TECP
JUN 06 1990
LIBRARIES - ' tk)Professor Donald Schon Chair, M.C.P. Committee
CONFLICT AND COOPERATION IN WATERSHED MANAGEMENT: CASE STUDY OF METROPOLITAN BOSTON'S WATER SUPPLIES
By
CHRISTINE L. ROBERTS
Submitted to the Department of Urban Studies and Planning on May 11, 1990 in Partial Fulfillment of the
Requirements for the Degree of Masters in City Planning
ABSTRACT
Interorganiztional conflict and cooperation in the dyadic relationship of Boston's water supply and delivery agencies is examined. Unlike other major metropolitan cities, Boston divides its water-supply system management between two
agencies--the Metropolitan District Commission's Division of Watershed Management (DWM)--with jurisdiction in the
watersheds--and the Massachusetts Water Resources Authority (MWRA)--responsible for the delivery system. In the five years of this institutional arrangement, observers have
assumed a cooperative relationship between the two, but conflict more accurately characterizes their interaction. This question becomes important in light of the Safe
Drinking Water Act amendments (SDWA) which provide
guidelines by which public water suppliers shall comply with new drinking-water contaminant regulations. The SDWA
assumes a single system operator and represents a
performance pressure that forces the two agencies to design a functional working relationship that was not required in their enabling legislation. This thesis presents and
analyzes instances of both cooperation and conflict and assesses the extent to which their magnitude effects a productive working relationship in the context of the Safe Drinking Water Act amendments.
Thesis Supervisor: H. Patricia Hynes
To my Parents for their
Strength of Heart and Love of Life
ACKNOWLEDGEMENTS
This thesis could not have been written without the help of several individuals on whom I relied during the last few frenetic months.
I wish to thank my Thesis Committee members--Pat Hynes, Richard Schramm, and Stephen Estes Smargiassi--for their continued interest in and support of this endeavor. As my advisor, Pat consistently responded to rewrites as though they were fresh copies--she never tired of the issues. Richard provided indispensable commentary and much appreciated support. A special thank you to Steve, my committee member from the MWRA, for generously sharing his professional opinions and that most valuable commodity--his time.
Thank you to all those who consented to interviews for this project, particularly the staff at the Division of Watershed Management and the Massachusetts Water Resources Authority.
In addition to these individuals, I wish to thank Paul and Gladys Roberts for their tireless perseverence and editing expertise. I could not have written this without you. And thank you, John, for making sure the bills got paid.
TABLE OF CONTENTS ABSTRACT... DEDICATION... ACKNOWLEDGMENTS... TABLE OF CONTENTS.... LIST OF TABLES... LIST OF FIGURES... LIST OF APPENDICES... INTRODUCTION...
Safe Drinking Water Act: Catalyst for Increased Inter Management Structure and
Agency Reorganization... Current Challenge for
Watershed Management.
IV. Methodology and Chapter Summ
action..
aries...
CHAPTER 1: HISTORY OF BOSTON'S WATER-SUPPLY
AGENCIES AND WATERSHED MANAGEMENT ....
I. Water Supply Expansion and
Agency Reorganization... II. Watershed Management History...
CHAPTER 2: BOSTON'S WATER SUPPLY WATERSHEDS...
I.
II. III. IV.
Quabbin Watershed... Ware River Watershed... Wachusett Watershed... Sudbury Watershed... iv iv vi vii viii I. II. III. . . . . 1 13 13 17 24 26 30 32 35 ... . . . .
TABLE OF CONTENTS (cont.)
CHAPTER 3: MANAGING THE WATER SUPPLIES:
CATALYST FOR CHANGE AND MANDATE FOR OPERATIONS...
Recent History, 1970 to 1984... Catalyst for Change... Mandate for Operations: Interaction of
DWM and MWRA... Division of Watershed Management... Massachusetts Water Resources Authority... 39 40 43 47 47 50 CHAPTER 4: I. II. III. IV. V. ORGANIZATIONAL PROBLEMS: THEORETICAL FRAMEWORK...
Open vs. Closed System... Environment... Resource Dependence and Exchange... Conflict and Cooperation... Dimensions of Interorganizational Interaction... 55 56 56 57 58 63
CHAPTER 5: COOPERATION AND CONFLICT:
RESEARCH FINDINGS AND ANALYSIS ...
I. Cooperation... 65
Memorandum of Understanding... 65
II. Conflict... 76
Structural... 77
Operational Philosophy... 86
CHAPTER 6: CONCLUSIONS AND RECOMMENDATIONS...103
APPENDICES... ... 130 NOTES...138 BIBLIOGRAPHY...144 I. II. III. 65
TABLES
1.1: CHANGES IN METROPOLITAN BOSTON'S
SUPPLY SOURCES AND AGENCY STRUCTURE... 14
1.2: METROPOLITAN BOSTON'S CURRENT
WATER SUPPLY SOURCES... 16
1.3: PROPOSED MDC FORESTRY MANAGEMENT
PRACTICE - 1986... 21
2.1: MDC DIVISION OF WATERSHED MANAGEMENT:
ACREAGE OWNERSHIP... 26
2.2: QUABBIN WATERSHED COMMUNITY POPULATIONS... 27
2.3: WARE RIVER WATERSHED COMMUNITY POPULATIONS.. 32
2.4: WACHUSETT WATERSHED COMMUNITY POPULATIONS... 34
2.5: SUDBURY WATERSHED COMMUNITY POPULATIONS... 37
3.1: MDC FORMER WATER DIVISION: BUDGET REQUESTS,
EXECUTIVE RECOMMENDATIONS, AND
LEGISLATIVE ALLOCATIONS, 1970 - 1985... 41
4.1: POSITIVE AND NEGATIVE CONSEQUENCES
OF CONFLICT... 62
5.1: DWM AND MWRA MEMORANDUM OF UNDERSTANDING:
COMPARISON BETWEEN 1985 AND 1989... 69
5.2: LEGISLATIVE ALLOCATIONS TO MDC'S DWM:
1985 - 1991... 98
FIGURES
2.1: BOSTON'S WATER SUPPLY AND
DISTRIBUTION SYSTEMS... 25
2.2: QUABBIN RESERVOIR RESERVATION WATERSHED... 29
2.3: WARE RIVER RESERVATION AND WATERSHED... 31
2.4: WACHUSETT RESERVOIR RESERVATION
AND WATERSHED... 33
2.5: SUDBURY RESERVATION: NORTH AND
SOUTH WATERSHEDS... 36
APPENDICES
A. BANK OF BOSTON CRITERIA FOR PUBLIC
ENTERPRISE MANAGEMENT OF METROPOLITAN
BOSTON'S WATER MANAGEMENT...131
B. DIMENSIONS OF CONFLICT MANAGEMENT...132
C. DIMENSIONS OF INTERORGANIZATIONAL
INTERACTION...133
D. SUMMARY OF QUABBIN AND WARE RIVER
WATERSHEDS RECREATIONAL ACCESS POLICIES...134
INTRODUCTION
The continued delivery of safe unfiltered drinking water to Boston area communities is currently being challenged by two factors. The first is recently revised federal public-health legislation, the Safe Drinking Water Act amendments
(SDWA 1986). The second concerns the actual management structure of the agencies charged with ensuring watershed protection and water delivery of the drinking water
supplies.
Boston and all other public water suppliers in the nation must comply with the revised SDWA. These amendments elevate
drinking-water quality issues in the public consciousness in the same way that the Clean Water Act focused attention on wastewater treatment in the 1970s. The amendments are a particularly important performance measure for public water
suppliers, because they institute new maximum contaminant levels that are more stringent than previous levels and increase the number of regulated contaminants to include formerly allowable chemical substances.
In addition to meeting the SDWA's water-quality
standards, Boston must address issues that arise due to the organizational structure of its water supply and delivery system. Unlike similar U.S. cities with unfiltered water
supplies", the Massachusetts State Legislature delegates management of greater Boston's drinking-water resources to two separate agencies. A more common management model
consolidates watershed management with reservoir management and water delivery, or it includes the water utility as a partner in government-initiated decision making.
Prior to 1985, Boston's water supply and delivery
infrastructure was managed as a single system. This 1985 management split means that the two organizations must work
not only with federal and state interests to effect the SDWA's regulations, but that they must also negotiate a working relationship with one another that integrated water suppliers need not address. While single-management
organizations are not immune to internal problems, tensions and resulting discord challenge internal-management
structures--not the legitimacy of the organization itself--and relationships can be established in the absence of
external constraints.
SAFE DRINKING WATER ACT: CATALYST FOR INCREASED INTERACTION
The SDWA amendments, which apply to all public water suppliers, introduce new contaminant levels to be regulated in drinking water supplies and are designed to meet the following objectives:
1. Regulate contaminants (83 initially; 25 more by January 1, 1991 and every three years after 1991).
2. Monitor unregulated contaminants (53 initially).
3. Stipulate mandatory treatment techniques if water quality criteria cannot be met
otherwise (filtration of surface water and mandatory disinfection of all public water systems).
4. Protect groundwater.
5. Prohibit the use of lead pipes, solder, and flux.
(Source: MWRA Safe Drinking Water Act Impact Study)
The Environmental Protection Agency drafted a set of rules to implement these safeguards of drinking-water
quality. These raise serious concern for the efficacy of the DWM-MWRA organizational structure. One rule in particular, the Surface Water Treatment Rule (SWTR), highlights the unique institutional structure of the DWM and the MWRA by addressing contamination of unfiltered surface-water
supplies, which characterize Boston's water sources. The SWTR directs its requirements2
to public water
suppliers and expects them either to implement site-specific watershed management and disinfection, or to construct a water filtration facility to ensure the continued delivery of safe water supplies to system users. The former option
is preventive, and the latter is corrective.
If the watershed management alternative is chosen, the DWM must comply by producing a watershed protection plan and
assure its approval by the state's environmental primacy agency. In Massachusetts, this is the Department of
Environmental Protection (DEP). If this criterion is not met, the latter option, filtration, must be met by the MWRA.
The DEP and other state environmental agencies prefer to meet the amended water quality standards through watershed protection rather than filtration; but strict compliance deadlines apply for the DWM to show "ownership or control"
of the watersheds.3 If the DWM and MWRA cannot produce a plan that meets DEP watershed protection guidelines by
January 1991, the SDWA mandates construction of a filtration facility.
MANAGEMENT STRUCTURE AND AGENCY REORGANIZATION
Water suppliers around the country with water supplies similar to Boston's are concerned about their ability to produce an acceptable watershed protection plan in light of the stringent new drinking-water standards. Boston must address these same issues with the additional concern of what impact its unusual dual-management structure holds for compliance. The DWM and MWRA's five-year interaction has been guided by a formal memorandum of understanding, but amendments to the federal SDWA in 1986 forced
interorganizational conflict to surface between DWM and MWRA by raising issues not addressed in the memorandum.
In 1984, the Massachusetts State legislature restructured responsibility for Boston's water-supply management by
District Commission (MDC). This creation was the Division of Watershed Management (DWM) and was entrusted to manage
state-owned watershed lands surrounding metropolitan
Boston's water-supply reservoirs. Prior to this date, the MDC operated and maintained the entire water supply and
distribution systems. When the legislature created the DWM, it also created the Massachusetts Water Resources Authority
(MWRA) to take over water-supply ownership and delivery functions.
The DWM's purpose is to manage state-owned watersheds--the land area that serves as a drainage route for water into the reservoirs--to ensure delivery of pure water to the MWRA supply sources. The MWRA assumed the MDC's responsibilities for providing wholesale water and sewer service to 46
communities in the greater Boston service area. The MDC's DWM manages portions of the supplies' watersheds and is responsible for the reservoirs' operating levels while the MWRA is responsible for the transmission and distribution of the water once it leaves the reservoirs.
The MWRA's and DWM's interorganizational relationship is statutorily defined to overlap in two areas--organizational goals and financing. The first overlap is DWM's mandated goal to manage the watersheds to ensure delivery of safe water to the MWRA while the MWRA is responsible for
delivering safe water to end-of-system users. Financing is a second factor directly linking the DWM to the MWRA. The
enabling legislation directs the MWRA to finance 75 percent of the DWM's operations and maintenance costs. Despite the fact that MWRA monies, not the state's general funds,
support most of the DWM budget, the MWRA has only advisory input into watershed policies. The MWRA relies on the DWM's protection policies for pure water to reach its reservoirs, but it has no control over the management decisions that
shape policy implementation. The enabling statute's
drafters designed this overlap, but offered no guidance for designing cooperation.
The institutional design of the two organizations complicates the implementation of their separate, but
similar, goals and raises issues about future interaction. The MDC's DWM is a public agency, subject to competition
among other state agencies and services for increasingly limited general state funds. As a public enterprise which can charge for the water it supplies and borrow from the private financial markets, the MWRA need not compete with other public agencies for state monies.
Due to the overlapping nature of their agency functions, the DWM and MWRA have chosen to draft the watershed
protection plan jointly, but they are doing so without preliminary analysis of the implications their atypical relationship has on the potential for compliance with the statute's provisions and continued delivery of safe
CURRENT CHALLENGE FOR WATERSHED MANAGEMENT
The SWTR illustrates the importance of organizational interdependency between the DWM and the MWRA in a way that was previously unknown--it raises the question of compliance
accountability. The DWM manages the watersheds, but if its policies fall short of the SWTR's requirements, the MWRA is responsible for implementing the filtration option. The amendments represent an unanticipated performance pressure that forces the two agencies to design a functional working relationship not anticipated in the originating act.
A consultant's preliminary assessment4 of the MWRA's
adherence to water-quality standards concluded that, despite current compliance, continued adherence is doubtful because of the limited public ownership of watershed land
surrounding one of its reservoirs. The report encourages the DWM and MWRA to foster cooperation among the state's environmental agencies in preparation of the watershed protection plan; but this recommendation assumes a
cooperative relationship currently exists between the two most directly linked participants in the planning process,
the DWM and MWRA.
Although the two organizations have exhibited cooperation by voluntarily initiating, and later revising, a Memorandum of Understanding (MOU) that details property divisions and institutional responsibilities, conflict also occurs in
the relationship is conflictual, not cooperative. Prior to preparing a joint Watershed Protection Plan that can
exemplify a conservationist philosophy and avoid the capital costs of a filtration facility, the relationship between the DWM and the MWRA should be examined to assess the reality of assumed cooperation and the effects of existing conflict. Conflict and uncooperative behavior may impede acceptance of a protection plan that ensures delivery of safe water to
system users without the additional costs of a filtration plant.
An analysis of the DWM's and the MWRA's overlapping goals and unique funding arrangement will highlight the
organizational constraints to both in their joint efforts to produce a watershed protection plan that will meet DEP
guidelines. I will analyze the potential for conflict and cooperation in this relationship and assess the extent to which their magnitude affects the eventual production of an
acceptable watershed protection plan. Furthermore, I will extrapolate from the lessons of this specific analysis to offer organizational recommendations on future interaction of the DWM and MWRA in fulfilling their complementary goals of watershed protection and delivery of safe drinking water.
METHODOLOGY AND CHAPTER SUMMARIES
Conflict and cooperation in the DWM and MWRA relationship are revealed through a series of interviews. Twenty-eight
personal interviews were conducted over a three-month period with staff from the DWM, MWRA, and other water utility and
environmental interests. Those interviewed were chosen on the basis of the relationship of their duties to watershed management. At the DWM, the choices were evident, because the function of the division is devoted to this issue. At the MWRA, those interviewed were chosen on the bases of (1) direct and frequent interaction with DWM staff on watershed issues, (2) duties that, while not directly indicative of watershed management, include frequent contact with DWM watersheds, and (3) MWRA staff who, while not currently
working on watershed-related projects, are former members of the MDC's Water Division (the predecessor to the MWRA
Waterworks Division).
Personnel from both field and Boston headquarters were interviewed. In addition to the persons directly affiliated with these two organizations, selective representatives from Massachusetts and federal environmental organizations and
agencies whose job descriptions and activities directly affect the two agencies were interviewed. Examples in this category include the Department of Environmental Protection (DEP) and the Environmental Protection Agency (EPA). Also interviewed were representatives from environmental interest groups (such as the Audubon Society and local watershed
associations) and watershed-management staff from other water utilities.
The conclusions voiced by personnel from these peripheral organizations are not incorporated into the conflict and cooperation attributed to the DWM and MWRA. Interviews with these outside contacts are included in order to place the DWM and MWRA in a broader social context and yet not to stray from the dual-agency focus of the thesis study.
External commentaries balance the internal observations of the DWM and the MWRA and are cited only where they add
credence to the issues raised by DWM and MWRA staff. A list of interviewees is contained in the bibliography.
Personnel interviewed were asked a series of questions about their interaction with the other organization,
including the nature of this interaction and its frequency and formalization. As clear patterns of overlap and conflict emerged in areas such as forestry management, recreation and hydropower operations, the questions focused on specific
aspects of these interactions. The opinions of the MWRA and DWM personnel are attributed to their institutions and not
to particular individuals. This reduces the confusion of identifying the specific affiliation of the respondent and is appropriate in this context, because the opinions of most individuals interviewed fell within boundaries of their
intraorganizational structure. If there is no unanimity, this will be cited when it highlights a conflict.
Chapters 1 and 2 review Boston's water-supply management agencies and their watershed-management practices and define
the physical condition of the watersheds to offer an
historical and descriptive basis for subsequent analysis. Chapter 3 explores the recent legislative and judicial events surrounding the creation of two water management
agencies to illustrate political inattention to water-system needs.
Chapter 4 reviews the theoretical framework of
organizations and conflict and cooperation to provide the basis for the eventual analysis of the interview results. Chapter 5 identifies areas of conflict and cooperation between the DWM and MWRA and analyzes these results in the
context of the theoretical expectations of Chapter 4. The results have been broken down into cooperative and
conflictual interaction. Cooperation is best represented by a formal Memorandum of Understanding. The contents of the MOU will be introduced, and the 1985 original version will be compared to the 1989 revision and assessed for its
effectiveness as a medium to address conflict.
Chapter 5 also analyzes conflict, which more accurately characterizes the interorganizational relations of this case study. Conflicts are broken down into those occurring due to structural and operational factors.
Structural conflicts are those caused by two factors: (1) the institutional differences between a public agency and a public enterprise (particularly financing
shared management of a system physically designed as a single delivery mechanism.
Philosophical conflicts are those which arise due to contradictory ideological interpretations of how best to define the agencies' shared goals. This category has two parts: (1) jurisdictional disputes characterized by
attempts to expand (MWRA) or maintain (DWM) organizational control in the watersheds and (2) management disputes that
stem from the above ideological differences.
Chapter 6 summarizes the findings of the preceding chapter and presents recommendations to guide future
productive actions of the DWM and MWRA, including short- and long-term recommendations for organizational structure.
CHAPTER 1
HISTORY OF BOSTON'S WATER-SUPPLIES AGENCIES AND WATERSHED MANAGEMENT
Chapter 1 provides an historical review of Boston's water-management structures, and this review will serve as
the basis for the interorganizational analysis that follows in Chapter 5. The purpose of this chapter is twofold. The initial focus will be on the management structure prior to the 1984 legislative creation of the Division of Watershed Management (DWM) and the Massachusetts Water Resources Authority (MWRA). Because the expansion of metropolitan Boston's water supplies closely parallels the formation of new water-management agencies, supply expansion serves as a backdrop for the discussion.
In the second part of this chapter, Boston's early watersheds-management efforts will be discussed and a
general examination of the threats from certain land uses will be made.
WATER SUPPLY EXPANSION AND AGENCY REORGANIZATION
Early History: 17th Century to 1984. Metropolitan Boston's water supplies historically expanded to meet the
needs of a growing urban population. As supply sources were added to the system, the agencies charged with managing
these supplies underwent a parallel change. A series of private and public entities managed Boston's water supplies
from the mid-17th century to the present. Each new
reorganization was based on the perceived need to expand existing supplies. Table 1.1 shows the progression ofsupply expansion and the accompanying changes in management
agencies.
TABLE 1.1: CHANGES IN METROPOLITAN BOSTON'S SUPPLY SOURCES AND AGENCY STRUCTURE
Management Structure Year Created Supply Source Waterworks Company 1652 Local waterbodies
Aqueduct Company 1796 Jamaica Pond
Cochituate Water Board 1846 Long Pond
Cochituate Water Board 1846 Sudbury Res.(*) Metropolitan Water Board 1895 Wachusett Res. Water Supply Commission 1926 Ware River(**) Water Supply Commission 1926 Quabbin Reservoir
(*) The Sudbury system consisted of six small storage reservoirs with a total capacity of 13 billion
gallons.
(**) The Ware River is diverted to either Quabbin or Wachusett Reservoirs
Source: (Nesson 1983; Massachusetts Water Resources Authority Long Range Planning Overview, February 1990)
Early efforts, such as the Waterworks Company and the
Aqueduct Corporation, were managed by private companies; but by the early 1800s, the primitive delivery mechanisms of cisterns and wooden conduits became technologically
insufficient to meet demand increases and were abandoned in pursuit of larger supplies. By the mid-19th century, the Boston City Council selected a Water Board to oversee the construction of the Cochituate/Sudbury Reservoir system
(Nesson 1983: 6). Additional development of the Sudbury River as a water-supply source occurred throughout the late
1800s to meet continuous increases in water demand. As Boston's population moved into the sensitive watersheds of these sources, these supplies became contaminated or
abandoned, and newer water sources were impounded.
As Boston's population grew, additional supply sources capable of accommodating residents' needs were added to
existing supplies. Incremental expansion occurred until the late 1800s when the state Board of Health recommended
developing supply sources in the central part of the state to accommodate water needs (Nesson 1983). The next major expansion, Wachusett Reservoir, was preceded by a new water-management agency. Based on the Board of Health's
recommendation, the state legislature created the
Metropolitan Water District in 1895 to maintain and operate the water supplies of communities within a ten-mile radius of the State House.
The last two major supply-system expansions, the Quabbin Reservoir (1939) and the Ware River Diversion (1931) were designed and constructed by yet another water-management entity, the Water Supply Commission. Although the state
legislature, in 1919, centralized water, sewer, and park management into the Metropolitan District Commission (MDC
Annual Report 1919), it relied on the Water Supply
Commission to oversee construction projects. Since the completion of Quabbin Reservoir in 1946, no major water supplies have been added to Boston's system. Table 1.2 shows the supply sources and their capacities.
TABLE 1.2: METROPOLITAN BOSTON'S CURRENT WATER SUPPLY SOURCES
Year
Filled or Maximum Capacity Source Status Diverted Depth (ft.) (Mil.Gal.) Sudbury Reservoir Standby 1878 65 7(*) Wachusett Reservoir Active 1908 129 65
Ware River Active 1931 --
--Quabbin Reservoir Active 1946 150 412 (*) Sudbury Reservoir supplies are on standby only Source: MWRA, Long-Range Planning Overview, 1990.
Throughout the periods of supply expansion, no water sources were designed to include filtration. During early efforts, such as the Cochituate system, filtration was still
an experimental technology. Water engineers were unwilling to gamble the success of the system's water quality on a fledgling technology (Nesson 1988: 12). In later expansion efforts, engineers opted for unfiltered supplies even though the technology was practicable. Wachusett's pure water was chosen over the alternative of filtering
industrially-polluted water from the Merrimack River. Water engineers opted for Wachusett's unfiltered source because it was preferable to obtain water from pure sources that did
notrequire constant supervision (Nesson 1983: 20).
In addition to professional preference for unfiltered water, engineers were conscious of consumers' preference for unfiltered supplies. Unlike today, where alternative water sources are scarce, consumers at that time could substitute filtered supplies with unfiltered water sources. This
consumer preference continued when Quabbin Reservoir was added to the system, resulting in a completely unfiltered
supply source for today's water consumers.
WATERSHED MANAGEMENT HISTORY
As the supply system expanded throughout the late 19th and early 20th centuries, the water entity responsible for constructing impoundments also managed watershed lands. When each new reservoir was constructed or river diverted,
the water management agency exercised eminent domain power to purchase lands necessary to ensure protection of the water supplies. The Metropolitan Water Act of June 1895
granted broad taking powers to the Water Board during construction of Sudbury and Wachusett watersheds.
The Wachusett Reservoir's Nashua River impoundment in 1908 was the first incidence of the relocation of towns for reservoir construction.5 By 1930, the legislature approved construction of Quabbin Reservoir to meet increased demand for water. This time, the construction necessitated the destruction of four towns and the relocation of their
residents."
Despite these broad powers, the Water Board was conscious of the potential for opposition to outright takings without initial negotiation with landowners.
The Board has deemed it wise to exercise as little as possible its power under the statute of arbitrarily taking lands and other valuable rights and divesting people of their ownership, and has pursued the policy of acquiring the necessary lands and rights by mutual agreements with the landholders.
In addition to paying property owners for land, the Water Board also released payments for damages to businesses, loss
of employment, and depreciation of real estate that occurred during reservoir construction.8 The Board effected eminent domain proceedings as required for construction needs; the watersheds adjacent to reservoir sites were purchased as construction progressed. In some instances, construction work proceeded on private property prior to the completion of sale negotiations.' When Wachusett was completed in
1908, the Water Board had purchased almost 12 million acres for the Sudbury and Wachusett Reservoirs at a cost of
approximately three million dollars.1 *
To protect watershed lands from intensive development is important because, in addition to transporting clean water to reservoirs, the watersheds' natural drainage patterns are vehicles for contaminants. Intensive residential,
commercial, and industrial activities adjacent to a
reservoir pose significant risks to the quality of water
which is eventually delivered to Boston. Leaching from landfills, leaking underground storage tanks, and on-site septic systems present a few of the sources of potential dangers which threaten reservoir water quality."
The early designers of Boston's water-supply system
recognized the importance of protecting sensitive watershed lands. The fact that only seven percent of the Wachusett watershed was purchased at the time of construction in 1908 does not mean that the water planners were ignorant of
watershed protection needs; nor does the 47 percent
purchased at Quabbin in the 1930s reflect a new watershed preservation ethic. Rather, it represents the belief that these distant rural areas would never be urbanized to an extent that could threaten the water quality of the
reservoirs. "
During the MDC's tenure, the definition of watershed management grew to include water quality monitoring,
forestry, wildlife management, and recreational issues.
Early watershed management consisted of sanitary inspections at the reservoir construction sites. The Water Board
exhibited concern for the health of the construction laborers. A lack of sanitary facilities posed a severe threat. Several cases of typhoid occurred during
construction of Wachusett, and the Water Board reacted by installing latrines, using disinfectants, and a regular monitoring of the sites to prevent further outbreak. In
addition, the Board assigned a medical inspector to the work sites."
Once the reservoirs were activated, the early concern for the health of the workers expanded to include additional
land acquisition and sanitary monitoring. Additional lands were purchased in sensitive tributary areas that fed the
supplies. Management focused on installing septic systems, filtration beds, and drainage sewers in the watersheds to serve the remaining population. In addition, engineering crews drained swamps to avoid excessive growth of organic matter. 14
Despite the Board's success in maintaining high water quality in the reservoirs (93 percent satisfactory
inspections in 1908 and 98 percent in 1918), unanticipated land uses highlighted an increase in water-quality problems. By 1911, the Board's annual reports cited factory discharges into the Wachusett watershed's Nashua River and agricultural and farm-animal waste drainage as causes of typhoid
outbreaks in the watersheds.'"
During the MDC's management tenure, tributary monitoring and sanitary surveys continued. The MDC also initiated
forestry management to increase reservoir yield by thinning high-density forests to reduce vegetative coverage. This
resulted in less water absorption by plant root systems and reduced transpiration loss, thus, allowing increased water runoff into the reservoirs."
From the 1930s to the 1960s, forestry management
consisted of red pine plantings to replace the vegetation originally removed during reservoir construction. The fast growth pines proved problematic in later years due to their high water consumption.1 7
In the following two decades, forestry practices involved selective clearing and reduced forestry stocking to ensure a diversified habitat for
wildlife, reduce erosion, and to increase reservoir water yield." In addition, the MDC asserted that selective cutting would increase the recreational value of the watersheds by providing scenic views.
In 1986, the MDC proposed expanding forestry management as a watershed management technique by increasing lumber harvesting by 100 percent of its historical level. This proposal is shown below in Table 1.3. The MDC estimated that increased forestry management would increase system
yield by four billion gallons per year (11 million gallons per day)."
Table 1.3: PROPOSED MDC FORESTRY MANAGEMENT PRACTICE - 1986 Proposed Percent
1986 Yield (Acres) Increase Increase Watersheds Softwood Hardwood in Cutting in Cutting
Quabbin 257 679
Ware River 63 171
Wachusett 21 61
Total 341 911 2500 100%
In addition to a forestry focus, the definition of watershed management expanded to include recreational
issues. Since the reservoirs were first constructed, local residents have used them for recreational pursuits.2o As populations in the watershed communities grew, the
reservoirs and adjacent watersheds became increasingly popular recreational areas.
Water supplies for metropolitan Boston and accompanying management agencies underwent continuous growth and change
since the early recognition of the need for a centralized delivery system. As supply sources expanded under
increasingly centralized management, those who planned and constructed system expansion chose to avoid filtration of already contaminated supplies and relied instead on
purchasing sensitive adjacent reservoir lands and watershed protection of pure sources.
From the early purchases in Sudbury to later acquisitions at Quabbin, a single agency has monitored these lands to ensure eventual delivery of safe drinking water to Boston's communities. This arrangement changed in 1985 when the legislature decentralized management into two agencies--the Division of Watershed Management and the Massachusetts Water Resources Authority. These new management agencies face the challenge of continuing to provide unfiltered drinking water
in accord with the more stringent SDWA standards.
Adapting to a decentralized system and complying with
quality standards are complicated by increasing recreational and development pressures in watershed lands. The next
chapter illustrates the effects of these pressures by providing a detailed description of Boston's water-supply watersheds.
CHAPTER 2
BOSTON'S WATER-SUPPLY WATERSHEDS
This chapter will feature descriptions of the watersheds managed by the Division of Watershed Management (DWM) and a discussion of the interdependencies between watershed
management practices and water supply quality. Population profiles of the communities having land within the watershed will be presented to illustrate the land use pressures of both recreation and residential development in sensitive areas.
LAND MANAGEMENT JURISDICTION
The watersheds serving metropolitan Boston's water supplies drain into two surface reservoirs (Quabbin and Wachusett) and one river (Ware). The DWM manages, under
state ownership, different percents of four watersheds that drain into the water supply reservoirs: Quabbin, Ware
River, Wachusett, and Sudbury watersheds. (Refer to Figure 2.1 for a system-wide view of the four watersheds).
Quabbin, Wachusett, and Sudbury watersheds drain into unfiltered surface reservoirs, and the Ware watershed contributes to flows in both Quabbin and Wachusett
FIGURE 2.1:
BOSTON'S WATER SUPPLY AND DISTRIBUTION SYSTEMS
- LERS
BIN WARE IVER UM
-HDWATER SHEDCLNN
QAB QuEDUC,
EAR 101 tN IX
RE7 WEVERTOU
NOUGHI D-M
DAM a AEMLNSLTR SUNBUUY.D1NG
CHEYUCOPEE0
CHICOPEE
EVI
R WILBRAHAM
-- ESRVIRELV 3- -OCSE M.QUBBN
SWIFT~~~~W.1 1A 1 0 RIE HAT1
S. HADLY SUMBLE HA
LEOMTNRTER
sr r
WA H S LEXINiTg -ttoCATO
-CFERVER
- rWSO
YllT EDHA FuA NGHAMA
QUABBIN ESERVOELLEEVLEY
im.~~ WAvoSET
~ ~
uEEVORuOUADDINLEENeric
AreUCaOGRV
QUDC
BOS~~~~~~~ ATON CIT Pumpin Stat030B 40ion30 7_00
CTYPYCAL
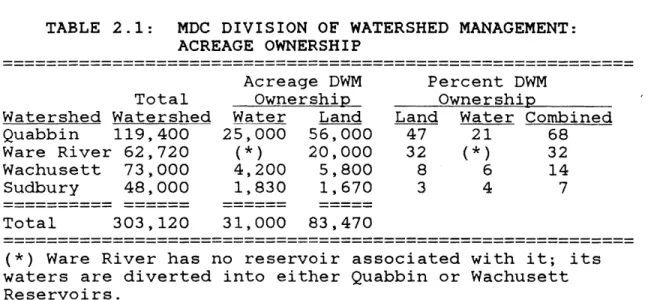
Reservoirs. All water supplies are active except for the Sudbury Reservoir, which is on standby for emergency use only (See Table 1.2 in Chapter 1 for MWRA supply sources.) Table 2.1 presents the total acreage for each watershed compared to the land and water areas under MDC or MWRA management.
TABLE 2.1: MDC DIVISION OF WATERSHED MANAGEMENT: ACREAGE OWNERSHIP
Acreage DWM Percent DWM Total Ownership Ownership
Watershed Watershed Water Land Land Water Combined Quabbin 119,400 25,000 56,000 47 21 68 Ware River 62,720 (*) 20,000 32 (*) 32 Wachusett 73,000 4,200 5,800 8 6 14 Sudbury 48,000 1,830 1,670 3 4 7 Total 303,120 31,000 83,470
(*) Ware River has no reservoir associated with it; its waters are diverted into either Quabbin or Wachusett Reservoirs.
Source: Metropolitan District Commission Division of Watershed Management, Mission Statement and Operational
Summary, January 18, 1989
These figures show that the level of watershed
protection, as measured by percents of state-owned land, varies considerably among the watersheds.
Quabbin Watershed. Quabbin watershed, comprised of
119,400 acres, is the largest of the DWM's four watersheds. The DWM maintains control of 47 percent of this total, which makes Quabbin Reservoir Boston's best protected water
supply. The 63,400" acres of land not owned by the state 26
are held by private property owners in ten surrounding towns, but the number of property owners whose residences directly affect the Quabbin watershed includes only 6,984 persons. Table 2.2 below shows the population profile of
these towns.
TABLE 2.2: QUABBIN WATERSHED: COMMUNITY POPULATIONS Percent Change Town 1970 1980 1985 1990 70-90 Belchertown 4,936 8,339 7,863 9,010 83 Barre 3,825 4,102 4,020 9,390 145 Hardwick 2,379 2,272 2,190 2,300 (03) New Salem 474 688 770 790 67 Orange 6,104 6,844 6,341 7,400 21 Pelham 937 1,112 1,136 1,250 33 Petersham 1,014 1,024 82 1,100 08 Shutesbury 489 1,049 1,126 1,260 158 Ware 8,187 8,953 8,669 8,960 09 Wendell 405 694 780 870 115 Subbasin Total 29,750 39,077 33,877 37,330 25 Source: 1970 = US Census Figures 1980 = US Census Figures
1985 = Massachusetts State Government, 1985 Census
1990 = Massachusetts Department of Public Health Estimate
Despite the limited number of residences that directly affect this area, the Quabbin watershed represents the
greatest visitor usage of any of the four under discussion. As the largest remaining open space in southern New England,
Quabbin watershed each year hosts over 700,000 visitors who hike, picnic, fish, and sight see. In addition, the
watershed serves as an educational research facility. Quabbin watershed is further divided into three regions,
each with varying levels of visitor access; (1) Quabbin Park, (2) Quabbin Reservation, and (3) North Quabbin
Reservation. Quabbin Park's 3,100 acres at the southern tip of the reservoir are the watershed's most popular and
frequently visited location, hosting about 600,000 visits each year. A visitors' center is located in this area and is open year round to provide interpretive displays and visitor information. The DWM seeks to make this portion of the park an intensive use area, because its proximity to the MDC Administration area and the Police offers the greatest potential for visitor oversight.
Quabbin Reservation consists of 53,000 acres that drain primarily into the Quabbin Reservoir. Unlike Quabbin Park, this area is primarily reserved for water resources
protection." Management activities here include forest and wildlife resources and environmental research. Human
activity in this area is limited by restricting access to Prescott Peninsula and Mount Zion Island. Despite these
restrictions, fishing is allowed from gas-powered boats from three boat ramp access points, as well as from the shoreline (Refer to Figure 2.2 for these locations).
North Quabbin Reservation consists of 7,500 acres not covered by the same statute as the Quabbin reservation due to the fragmented nature of land holdings in this area. It
FIGURE 2.2:
QUABBIN RESERVOIR RESERVATION WATERSHED
BOAT MOORhi AREA NO.1
-LEGEND BEL( -7re PICNIC AREA
MD.C.
LANDHOLDINGS
[ROAD MOORING GATE TOAREA
SHORE FISHING
FISHING AREA Over 80 foot depth
60 foot depth
QUABBIN RESERVOIR
RESERVATION
WATERSHED
consists of approximately 50 separate land parcels that are further decentralized by interim private and public land holdings. Most of these holdings are in the towns of
Shutesbury, New Salem, and Pelham. The DWM identifies this area as a management difficulty due to the fragmented
ownership but acknowledges that poor access to these holdings reduces this concern.
Ware River Watershed. The DWM manages 20,000 acres of the Ware River's more than 60,000 acres of watershed land. The Ware watershed is unique among the DWM's watersheds in that its drainage does not flow into a supply reservoir, thus posing unique management needs. (Figure 2.3
illustrates this concern). The Ware River watershed contains six major tributaries that branch from the main river, and greater than half the area of these tributaries is under DWM ownership; the remainder are private property holdings in surrounding towns. Although the communities are predominantly rural, development pressure exists that could threaten the water quality of supplies eventually delivered to Boston.
In addition, even the watershed land managed by the DWM is not subject to Quabbin's strict human access guidelines, partly due to staffing shortages that prevent proper
monitoring of human access to the watershed. The Ware River watershed is open to the public 24 hours per day, 365 days per year. Such unlimited access coupled with the limited
FIGURE 2.3:
WARE RIVER RESERVATION AND WATERSHED
RUTLAND STATE PARK -* (M.D.C) Managed by Department of Natural Resourses BOATING, SWIMMING, FISHING, PICNIC AREA, TRAILS
M. D. C. LANDHOLDINGS
WARE RIVER
RESERVATION
and
WATERSHED
0 1 2 3 4 E SCALE OF MILESstaff to enforce existing guidelines results in documented cases of illegal dumping and negative impacts of human use.
TABLE 2.3: WARE RIVER WATERSHED: COMMUNITY POPULATIONS Percent Change Town 1970 1980 1985 1990 70-90 Hubbardston 1,437 1,797 1,876 2,050 43 Oakham 730 994 1,212 1,120 53 Phillipston 872 953 1,101 1,100 26 Rutland 3,198 4,334 4,291 5,104 60 Templeton 5,863 6,070 5,941 6,410 09 Subbasin Total 7,918 10,503 11,160 12,124 53 Source: 1970 = US Census Figures 1980 = US Census Figures
1985 = Massachusetts State Government, 1985 Census
1990 = Massachusetts Department of Public Health Estimate
Wachusett Watershed. The DWM owns 7 percent of the total 73,000 acres of Wachusett watershed; the remaining 93
percent is private property holdings. Of the three current supply sources, the Wachusett is the most at risk regarding contamination, because less watershed land is state owned there than in the Quabbin or Ware River watersheds. (See Figure 2.4).
Increased development pressure in central Massachusetts is threatening Wachusett Reservoir's water quality. The watershed is characterized by intensive residential
development pressures in the surrounding towns of Boylston, Clinton, West Boylston, Holden, Sterling, and Princeton. At
FIGURE 2.4:
WACHUSETT RESERVOIR RESERVATION AND WATERSHED
LEOMINSTER
LEGEND SNOWMOBILE AREA
- WATERSHED AREA WORCESTER SHORE FISHING
M.DC.LANDHOLDINGS
WACHUSETT RESERVOIR
RESERVATION & WATERSHED
0 1 2 3 4 5
SCALE OF MILES
33
first glance the population increases appear less
troublesome in Wachusett than in other watersheds; but when combined with the limited state control of Wachusett
watershed lands, the increases in the past twenty years are more problematic due to greater potential for development.
(Refer to Table 2.4 for Wachusett's population figures).
TABLE 2.4: WACHUSETT WATERSHED: COMMUNITY POPULATIONS Percent Change Town 1970 1980 1985 1990 70-90 -- ---Boylston 2,774 3,470 3,594 4,030 45 Clinton 13,383 12,771 12,689 13,880 04 Holden 12,564 13,336 13,187 14,390 15 Sterling 4,247 5,440 5,956 6,190 46 W. Boylston 6,369 6,204 6,112 6,300 (01) Princeton 3,198 4,334 4,291 5,104 60 Subbasin Total 42,535 45,555 45,829 49,894 17 Source: 1970 = US Census Figures 1980 = US Census Figures
1985 = Massachusetts State Government, 1985 Census
1990 = Massachusetts Department of Public Health Estimate
Private land holdings in Wachusett watershed are more developed than those of either Quabbin or Ware River
watersheds. Although the amount of state-owned watershed land in Quabbin is almost ten times greater than that in Wachusett, and Quabbin's reservoir capacity is six times
larger than that of Wachusett Reservoir, the Wachusett
watershed's population exceeds Quabbin's by 34 percent. In addition, the Wachusett Reservoir is traversed by heavily
travelled roadways and within ten miles of a major transportation link, Route 495.
Recreational access to the watershed is discouraged, but the greater issue at Wachusett is the use of watershed land not managed by the DWM. The fact that Wachusett Reservoir and watershed provide the only extensive open space for the watershed communities results in its use as a recreational resource. In addition, shoreline fishing is allowed which brings users to the water's edge and has resulted in illegal boating and swimming in the reservoir.
Sudbury Watershed. The Sudbury watershed represents the least amount of DWM ownership, with only four percent of a total 48,000 watershed acres controlled by the DWM (See Figure 2.5). The water supplies associated with this watershed"2 had been active since the 1870s, but were
removed from service in the early 1970s due to water-quality contamination. Pollution from adjacent residential,
commercial, and industrial development resulted in consistent failure to meet federal drinking water
standards." Currently, the supplies are on standby, which means that it can be reactivated for emergency use; but the resources needed to bring the supplies up to current federal water quality standards would preclude watershed management.
A treatment facility would be required due to the advanced degradation of the source and the population
FIGURE 2.5:
SUDBURY RESERVATION: NORTH AND SOUTH WATESHD
LEGEND
- - -- SOUTH SUDBURY MDCLANDHOLDINGS
(Outer limits)
* "oiuefor wae Supply SUDBURY RESERVATION
NORTH and SOUTH WATERSHEDS
0 1 2 3 4 5
intensity in the watershed." Sudbury's watershed populations are listed in Table 2.5.
TABLE 2.5. SUDBURY WATERSHED: COMMUNITY POPULATIONS
Percent Change Town 1970 1980 1985 1990 70-90 ---Ashland 8,882 9,165 10,531 9,960 12 Framingham 64,048 65,113 61,241 63,900 (.02) Hopkington 5,981 7,114 7,711 8,230 27 Marlborough 27,936 30,617 34,294 33,060 15 Southborough 5,798 6,193 6,334 6,800 15 Westborough 12,594 13,619 13,549 14,811 15 Subbasin Totals 125,239 131,821 133,660 136,761 08 Source: 1970 = US Census Figures 1980 = US Census Figures
1985 = Massachusetts State Government, 1985 Census
1990 = Massachusetts Department of Public Health Estimate
This chapter introduced the separate watersheds for Boston's water supplies and showed the potential for
protection, as measured by percent of state-controlled land, for each of the four. Quabbin watershed is one of the best-protected unfiltered supplies in the Boston system, as well
as in the nation, but threats to water quality are evident in the other three. Development potential and its
accompanying water-quality threats are not pressing issues in Ware River and Sudbury. In Ware River, a large percent of land is state-owned and in Sudbury, the existing level of development has caused water-quality problems resulting in the closure of that system as a viable unfiltered supply. Wachusett watershed is the most susceptible to water-quality
degradation and, thus, is the target of watershed management efforts.
Despite the urgency to produce an acceptable management plan, progress is impeded by several factors. Political
inaction results in an ill-defined management structure that undermines intentions to comply with the SDWA amendments
without constructing a filtration facility.
The following chapter details the political basis for creating and retaining a dual-management system, and
outlines the specific responsibilities of the DWM and the MWRA in the context of the watersheds.
CHAPTER 3
MANAGING THE WATER SUPPLIES:
CATALYST FOR CHANGE AND MANDATE FOR OPERATIONS
The DWM's and MWRA's split responsibility for water-supply protection is unique in Boston's water-agency history. Throughout the reorganizations of the 19th and 20th centuries, the legislature continually centralized management; but the action taken in 1984 reversed that trend.
In the first part of this chapter an examination of the events leading up to the most recent organizational designs
(the DWM and the MWRA) will be made. The contributing
political and legal reasons for the separation of watershed management into a division separate from the water supplier
will follow.
This separation of watershed management into a new MDC division was totally unexpected, for the 1984 political debates focused on issues relative to preventing continued wastewater pollution of Boston Harbor, limiting water supply
expansions, and encouraging water conservation. The debates did not focus on watershed management.
The second part of this chapter details the operational jurisdictions of the DWM and the MWRA and explores their interaction in terms of watershed management. Their shared enab-ing legislation is introduced to show the bureaucratic overlaps in their operational mandates.
RECENT HISTORY: 1970 TO 1984
From 1919 to the reorganization in 1984, the MDC managed the Boston area's water supply functions (which includes both watersheds and reservoirs), but it proved increasingly unable to maintain and improve the system due to consistent
legislative underfunding for systems' upgrade and
maintenance. Table 3.1 shows that, from 1970 to 1984, the legislature successively reduced allocations for the MDC Water Division.
TABLE 3.1: MDC'S FORMER WATER DIVISION: FUNDING REQUESTS AND APPROPRIATIONS, FISCAL YEARS 1970-1985
(1989 DOLLARS(*) IN THOUSANDS)
Percent Agency EOEA Sct'y Governor's Legislative Yearly Year Request Recommend. Recommend. Allocation Change
1970 24,225 18,210 18,177 (+) 1971 23,718 20,402 20,118 20,128 1972 23,950 20,395 19,886 19,859 (1) 1973 25,018 20,590 20,342 20,355 2 1974 19,851 19,851 20,068 20,095 (1) 1975 19,341 18,559 18,855 18,873 (6) 1976 14,395 14,395 14,395 17,425 (8) 1977 18,696 18,696 17,557 18,424 (6) 1978 16,713 15,594 15,594 18,840 (2) 1979 19,061 17,375 16,352 15,816 (16) 1980 18,819 14,695 16,695 14,132 (11) 1981 16,127 14,831 14,831 14,588 3 1982 16,091 15,145 15,145 15,063 3 1983 16,222 15,787 15,787 15,720 4 1984 17,853 17,606 17,606 (+) 1985 19,173 9,010 9,010 (+) (*) CPI 1989 = 100
(+) Figures not readily available for these years
Source: Massachusetts House 1 Budget Requests 1970-1984.
As a government agency, the MDC's budget requires
approval by the legislature, but the agency never received adequate funds to operate and maintain the water system, let alone finance needed capital improvements.2 7 In the ten-year period between 1973 and 1983, the legislature reduced MDC Water Division funding in constant dollars by 23
percent.
In addition to decreasing legislative appropriations, the MDC's ability to fund operations and maintenance became even more problematic in 1981 with the passage of voter
initiative Proposition 2 1/2. Prior to 1981, the MDC Water 41
Division could recoup its costs via user fees from member communities. The agency assessed the costs of its
operations and debt service on the member cities, towns, and other public bodies in its jurisdiction; but the passage of the initiative constrained the MDC's (and other state
agencies') ability to collect on certain kinds of revenues. Proposition 2 1/2 specifically limits any increases in the
charges and fees assessed by MDC on the towns to the sum of: 1. 2.5% of the total charges and fees imposed in the
preceding fiscal year and
2. any increase in charges for services customarily provided locally, or services obtained by the city
or town at its option.
In effect, the initiative placed a cap on the funds that the MDC could raise to finance its multi-purpose operations for water, sewer, and parks.
After 1981, a decreasing proportion of the new limited assessments were allocated to the water division, because the 2 1/2 percent cap applied to the three MDC divisions: Water, Sewer, and Parks. Of the three divisions, Parks consistently received the lion's share of MDC's total budget. Legislators were more concerned with funding the Parks Division, because it was a visible sign of political
action in a community and could return votes on election day. Between 1970 and 1984, legislators consistently allocated at least twice as much money to the MDC Parks
Division as they did to the combined Water and Sewer Divisions.
In addition to receiving a decrease in monies for operations, the MDC was forced to rely on general tax
revenues (not just assessments on user communities) to fund its operations and maintenance costs. A combination of
system age and political unwillingness to finance maintenance and upgrades resulted in an antiquated
infrastructure and harbor pollution.
CATAYLYST FOR CHANGE
The impetus for changing the management structure was based on wastewater pollution, not water-quality
degradation. A court suit filed by a member community charged the MDC with violating the state and federal Clean Water Acts."2 The presiding state judge, Judge Paul
Garrity, appointed a special court master to explore ways to address compliance with the Clean Water Act, and the special master recommended that a quasi-public authority be created
to take over the MDC's water and sewer management duties. Prior to legislative response to the crisis, the Bank of Boston published a report recommending an authority
management structure and cited the problems inherent in the MDC's ability to upgrade and maintain the water and sewer
systems, including the property-tax initiative and MDC
reliance on legislative appropriations. (Refer to Appendix
A for the Bank of Boston's bases for recommending a public enterprise to manage the water and sewer systems.)
In April 1984, Governor Dukakis submitted a proposal to the legislature" to create a public enterprise to address harbor pollution. In recognition of the financial
restrictions faced by the MDC, he adopted the court master's recommendation of an authority independent from legislative budget allocations and capable of raising revenues in the private market.
From April through December 1984, the legislature debated the proposal. The Governor's bill was unopposed until
October when the Senate President rejected the formation of an authority including both the water and sewerage systems under a single public enterprise structure.3 1 Although this provision of the original bill was eventually restored in the final legislation, a November 1984 revision by the Ways
and Means staff separated the watershed management function from the rest of the water system.
Judge Garrity was prepared to take over MDC sewer-service operation unless the legislature approved the recommended restructuring. The legislation was finalized in a three-day marathon conference committee and resulted in the creation of the Massachusetts Water Resources Authority and the Division of Watershed Management.
The conference committee process avoided a court takeover to clean up the harbor, but no record of public
debate is extant to justify creating a new division within the MDC to oversee watershed management. Several reasons exist for creating a separate division to manage watershed lands, including:
1. Accountability: Concern that the authority, as a single-purpose water-delivery agency, would not manage the watersheds in the best interests of the Commonwealth.
2. Legislative Special Use: A guarantee that
both the legislators whose districts are adjacent to MDC watersheds and certain special interests of such districts would retain unauthorized special uses. 32
A former committee staff person3 3 who was privy to the
closed conference sessions states that he drafted this organizational arrangement to preserve public control over
state-owned property. His actions were motivated by the fear that an authority would not be an appropriate steward of public lands and would lack accountability to the
commonwealth in its management practices. This concern was shared by the Water Supply Citizens Advisory Committee which expressed concern that a public authority lacked legislative oversight and could possibly sell watershed lands to finance a filtration plant to increase water sales.
In addition to altruistic concern over public
accountability in land management, state legislators regard the watersheds as havens for special-use privileges and respond to recreational interests at the expense of water-quality protection. Despite the DWM's stated goal of
passive use of the watersheds, state legislators have used 45