Publisher’s version / Version de l'éditeur:
The Astrophysical Journal, 856, 2, p. 164, 2018-04-01
READ THESE TERMS AND CONDITIONS CAREFULLY BEFORE USING THIS WEBSITE. https://nrc-publications.canada.ca/eng/copyright
Vous avez des questions? Nous pouvons vous aider. Pour communiquer directement avec un auteur, consultez la première page de la revue dans laquelle son article a été publié afin de trouver ses coordonnées. Si vous n’arrivez pas à les repérer, communiquez avec nous à [email protected].
Questions? Contact the NRC Publications Archive team at
[email protected]. If you wish to email the authors directly, please see the first page of the publication for their contact information.
NRC Publications Archive
Archives des publications du CNRC
This publication could be one of several versions: author’s original, accepted manuscript or the publisher’s version. / La version de cette publication peut être l’une des suivantes : la version prépublication de l’auteur, la version acceptée du manuscrit ou la version de l’éditeur.
For the publisher’s version, please access the DOI link below./ Pour consulter la version de l’éditeur, utilisez le lien DOI ci-dessous.
https://doi.org/10.3847/1538-4357/aaafc7
Access and use of this website and the material on it are subject to the Terms and Conditions set forth at
The envelope kinematics and a possible disk around the class 0
protostar within BHR7
Tobin, John J.; Bos, Steven P.; Dunham, Michael M.; Bourke, Tyler L.; Van
Der Marel, Nienke
https://publications-cnrc.canada.ca/fra/droits
L’accès à ce site Web et l’utilisation de son contenu sont assujettis aux conditions présentées dans le site LISEZ CES CONDITIONS ATTENTIVEMENT AVANT D’UTILISER CE SITE WEB.
NRC Publications Record / Notice d'Archives des publications de CNRC:
https://nrc-publications.canada.ca/eng/view/object/?id=572c6228-e4c6-4dc4-9d2e-a49b0c279647 https://publications-cnrc.canada.ca/fra/voir/objet/?id=572c6228-e4c6-4dc4-9d2e-a49b0c279647
The Envelope Kinematics and a Possible Disk around the Class 0 Protostar within BHR7
John J. Tobin1,2 , Steven P. Bos2, Michael M. Dunham3,4 , Tyler L. Bourke5, and Nienke van der Marel6,7 1
Homer L. Dodge Department of Physics and Astronomy, University of Oklahoma, 440 W. Brooks Street, Norman, OK 73019, USA 2
Leiden Observatory, Leiden University, P.O. Box 9513, 2300-RA Leiden, The Netherlands 3
Department of Physics, State University of New York Fredonia, Fredonia, New York 14063, USA 4
Harvard-Smithsonian Center for Astrophysics, 60 Garden Street, Cambridge, MA, USA 5
SKA Organization, Jodrell Bank Observatory, Lower Withington, Macclesfield, Cheshire SK11 9DL, UK 6Institute for Astronomy, University of Hawaii, 2680 Woodlawn Drive, 96822 Honolulu, HI, USA 7
Herzberg Astronomy and Astrophysics Programs, National Research Council of Canada, 5017 West Saanich Road, Victoria, BC, V9E 2E7, Canada
Received 2017 September 12; revised 2018 January 9; accepted 2018 February 13; published 2018 April 4
Abstract
We present a characterization of the protostar embedded within the BHR7 dark cloud, based on both photometric measurements from the near-infrared to millimeter and interferometric continuum and molecular line observations at millimeter wavelengths. We find that this protostar is a Class 0 system, the youngest class of protostars, measuring its bolometric temperature to be 50.5 K, with a bolometric luminosity of 9.3 L☉. The near-infrared and Spitzer imaging show a prominent dark lane from dust extinction separating clear bipolar outflow cavities.
Observations of 13CO (J= ), C2 1 18O (J= ), and other molecular lines with the Submillimeter Array2 1 (SMA) exhibit a clear rotation signature on scales <1300 au. The rotation can be traced to an inner radius of ∼170 au and the rotation curve is consistent with an R−1 profile, implying that angular momentum is being conserved. Observations of the 1.3 mm dust continuum with the SMA reveal a resolved continuum source, extended in the direction of the dark lane, orthogonal to the outflow. The deconvolved size of the continuum indicates a radius of ∼100 au for the continuum source at the assumed distance of 400 pc. The visibility amplitude profile of the continuum emission cannot be reproduced by an envelope alone and needs a compact component. Thus, we posit that the resolved continuum source could be tracing a Keplerian disk in this very young system. If we assume that the continuum radius traces a Keplerian disk (R∼120 au) the observed rotation profile is consistent with a protostar mass of 1.0M☉.
Key words:ISM: individual objects (BHR7) – ISM: jets and outflows – ISM: molecules – stars: formation – stars:
protostars
1. Introduction
The formation of rotationally supported disks during star formation is a crucial part of the star and planet formation process. Once a disk has formed, stellar mass assembly will then be governed by accretion through the disk, and the disk will further enable the growth of solids, catalyzing the planet formation process (Testi et al. 2014). Furthermore, if the forming disks are sufficiently massive, they may fragment via gravitational instability, leading to the formation of a close binary star system or possibly giant planets (e.g., Kratter et al. 2010; Tobin et al. 2016). Also, clumps formed via gravitational instability may lead to episodic bursts of accretion (Vorobyov & Basu2006), and they may lead to disk snowline radii moving in and out during the protostellar phase (Cieza et al.2016). However, it is uncertain if (or how often) processes such as gravitational instability can function in protostellar disks because their general properties such as radii, mass, and temperature structure have yet to be characterized for a broad sample. This is because the continuum and molecular line emission of the envelope is entangled with that of the disk early in the star formation process, the Class 0 phase (André et al.1993; Dunham et al.2014), when the infalling envelopes are very dense.
In order to understand the formation and evolution of disks, they must be observed throughout the star formation process. Thus, both high spatial and spectral resolution must be coupled with high-sensitivity observations to distinguish the disk from the infalling envelopes. A few examples of disks in Class 0
systems have been found (Tobin et al. 2012b; Murillo & Lai2013; Codella et al.2014; Lee et al.2014; Lindberg et al.
2014; Ohashi et al.2014; Yen et al.2015,2017), having a wide variety of sizes, from >100 to <10 au. However, the total number of systems is still quite small, therefore detections and/ or evidence of disks in additional systems are important.
BHR7 (Bourke et al. 1995a) is an isolated dark cloud harboring an embedded protostar, discovered by the coin-cidence of its mid- to far-infrared emission detected by the
Infrared Astronomy Satellite (IRAS 08124-3422), an optical dark cloud (Hartley et al. 1986), and ammonia emission (Bourke et al.1995b). The isolated nature of BHR7 makes it an ideal target to examine, free of confusion from the super-position of neighboring protostars. However, a drawback of an isolated system is its uncertain distance, because of the difficulty to relate BHR7 to a particular star-forming region. BHR7, however, is associated with the Vela Cometary globules and the distance estimates range between 400 and 500 pc (Woermann et al. 2001). The systemic velocity of BHR7 indicates that it is on the near-side of an expanding shell, thus we adopt ∼400 pc as the distance to BHR7 throughout the text. In order to distinguish between the protostar and the dark cloud, we will refer to the protostar as BHR7-MMS and refer to the region around the protostar as BHR7.
Since the original detection, this protostar has received little attention in the form of follow-up observations. However, the Two-Micron All Sky Survey (2MASS; Santos et al.1998and Skrutskie et al.2006)observed BHR7 and detected evidence of a bipolar scattered light nebula at 2.15 μm, indicating the
856:164 (15pp), 2018 April 1 https://doi.org/10.3847/1538-4357/aaafc7
possible presence of outflow activity from this source. The bipolar nebula also appeared as if it might be near edge-on in both sets of near-infrared observations from the dark lane that appears to bisect the nebula. Edge-on protostar systems can be advantageous because the orientation enables a clear view of the kinematics, well-separated from the outflow, and any velocity corrections due to inclination are inherently small.
Here we present a multi-wavelength and multi-scale examina-tion of BHR7 using ground- and space-based observaexamina-tions spanning the near-infrared to millimeter wavelengths, confirming the evolutionary state of BHR7-MMS as a Class 0 protostar. We subsequently obtained observations with the Submillimeter Array (SMA; Ho et al.2004)in multiple configurations, gaining both a small-scale (subarcsecond) view, and a larger-scale (several arcsecond) view of the kinematic structure. The key advance is that the SMA observations have enabled us to assess the likelihood of a disk in this protostar system. The paper is structured as follows: the observations and data reduction are presented in Section2, we discuss the overall infrared imaging, spectral energy distribution (SED), and results from the SMA observations in Section3, discussion of the results is presented in Section 5, and the summary and conclusions are given in Section5.
2. Observations and Data Reduction
2.1. SMA Observations
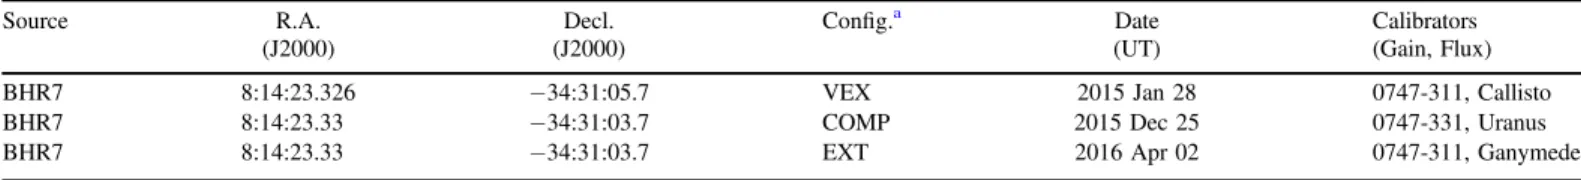
The SMA is located on Maunakea on the island of Hawaii at an altitude of 4000m, and it nominally has eight 6m antennas combined to form the interferometer. BHR7-MMS was observed by the SMA several times during 2015 and 2016 in Very Extended, Extended, and Compact configuration at 1.3 mm; the observations are summarized in Table 1 and detailed in the following sections.
2.1.1. Very Extended Array Observations
The Very Extended observations were conducted on 2015 January 28 with six antennas operating and a maximum baseline of 362m. The zenith atmospheric optical depth at 225 GHz was ∼0.06 throughout the observation. The observa-tion used the ASIC correlator configured for continuum observations, sampling a total bandwidth of 8 GHz (upper and lower sided bands). The spectral resolution was set to 64 channels per 104 MHz spectral chunk and the central frequency was 225.5 GHz. The observations used Callisto as the absolute flux calibrator, 3C279 as the bandpass calibrator, and 0747-331 was used as the complex gain calibrator. The observations were conducted in a standard loop observing the gain calibrator for 3 minutes and BHR7-MMS for 10 minutes. The total time on source was approximately 4.0 hr.
2.1.2. Compact Array Observations
The Compact array observations were conducted on 2015 December 25 with eight antennas operating and a maximum baseline of 69m. The zenith atmospheric optical depth at 225 GHz was ∼0.07 throughout the observation. For these observations, Uranus was used as the absolute flux calibrator, 3C84 was the bandpass calibrator, and 0747-331 was the complex gain calibrator. The observations were conducted in a standard loop observing the gain calibrator for 3 minutes and BHR7-MMS for 15 minutes. The total time on source was approximately 5.0 hr. The correlator was configured for both spectral line and continuum observations with a central frequency of 225.4 GHz; we observed 12CO, 13CO, C18O (J= ), H2 1 2CO (J=30,320,2), and N2D+ (J= 3 ). All lines had a spectral resolution of 200kHz2 (0.26 km s−1), except C18O and N2D
+
, which had a spectral resolution of 100 kHz (∼0.13 km s−1
). The total continuum bandwidth was 5.2 GHz (upper and lower sidebands combined).
2.1.3. Extended Array Observations
The Extended array observations were conducted on 2016 April 02 with eight antennas operating and a maximum baseline of 181m. The zenith atmospheric optical depth at 225 GHz was ∼0.04 throughout the observation. For these observations, Ganymede was used as the absolute flux calibrator, 3C273 was the bandpass calibrator, and 0747-331 was the complex gain calibrator. The observations were conducted in a standard loop observing the gain calibrator for 3 minutes and BHR7-MMS for 15 minutes. The total time on source was approximately 4.2 hr. The correlator was configured for both spectral line and continuum observations; it has the same configuration and spectral resolution as the Compact observations, except that H2CO (J=32,122,1), SO
(JN =56 ), and SiO (J45 = ) were also observed.5 4
They were not observed in the Compact observations due to a correlator problem. The SiO (J= ) transition was also5 4 covered at the continuum spectral resolution (1.625 MHz or 2.25 km s−1). The total continuum bandwidth was 10.8 GHz (upper and lower sidebands combined; 5.2 GHz from the original correlator and 5.6 GHz from the early SWARM correlator).
2.1.4. Data Reduction
The SMA data were calibrated and edited using standard techniques within the MIR software package. MIR is an IDL-based software package originally developed for the Owens Valley Radio Observatory and adapted by the SMA group. We performed subsequent imaging in MIRIAD (Multichannel Table 1
SMA Observations
Source R.A. Decl. Config.a Date Calibrators
(J2000) (J2000) (UT) (Gain, Flux)
BHR7 8:14:23.326 −34:31:05.7 VEX 2015 Jan 28 0747-311, Callisto
BHR7 8:14:23.33 −34:31:03.7 COMP 2015 Dec 25 0747-331, Uranus
BHR7 8:14:23.33 −34:31:03.7 EXT 2016 Apr 02 0747-311, Ganymede
Note. The position listed for VEX corresponds to the phase center of the observations, not the coordinates of the continuum emission, and the positions for EXT and COMP are centered on the continuum source.
a
Image Reconstruction, Image Analysis and Display; Sault et al. 1995) for both the spectral line and continuum data. However, we did import the Very Extended data into CASA (McMullin et al.2007)for self-calibration. We did this by first exporting the continuum visibility data from MIR to MIRIAD format, then converting the MIRIAD visibility files to UVFITS via the MIRIAD task fits, and then importing the data into CASA using the importuvfits task. The purpose of using CASA was to perform self-calibration on the continuum, using the procedures established for VLA and ALMA data. The final images from Very Extended data were generated in CASA using the clean task. Self-calibration of the Very Extended data was useful given that the initial signal-to-noise ratio (S/N) was 50 and phase-only self-calibration on 5 minute solution intervals increased the S/N to >100. The absolute flux density accuracy is estimated to be between 10% and 20%.
2.2. Herschel Observations
BHR7 was observed with the Herschel Space Observatory as part of the Hi-Gal2π project (OT2_smolinar_7), obsids 1342254511 and 1342254512, using the Spectral and Photo-metric Imaging Receiver (SPIRE; Griffin et al. 2010). While these data were acquired in a parallel mode, where SPIRE and the Photoconductor Array Camera and Spectrometer (PACS; Poglitsch et al. 2010) observed simultaneously, the PACS coverage missed BHR7 by a few arcminutes. Therefore, BHR7 was only observed by SPIRE at 250, 350, and 500 μm. We used the Jscan imaging products from the archive for photometry. We measured the flux density in a circular aperture around BHR7 with a radius of 40″ and subtracted the background measured from a nearby region of blank sky. The background region was at R.A.=8:14:20.390, decl.=−34:36:26.29 and had a radius of 129″. We used the median background value, and scaled this to the area of the 40″ aperture. BHR7 is an isolated globule, so extended, diffuse emission from a surrounding cloud was not present, but there is an extended tail to the cloud, prohibiting the use of a background annulus. We used the extended source photometry methods described in the SPIRE data handbook,8 using the extended source color correction factor and aperture corrections. We use values corresponding to a modified blackbody with β=1.5, and a temperature of 30K; these values are reasonably representative of the SED of the protostar that peaks near 100 μm. The Herschel SPIRE photometry are listed in Table 2; the uncertainties given are statistical only, accounting for the rms noise in the image and the number of pixels summed to measure the flux density. The PACS and SPIRE absolute photometric accuracy are estimated to9 be 3%–5% and 4%,10 respectively. However, in the SPIRE bands there is additional extended emission that we do not capture with the apertures used; thus, the submillimeter flux densities may be systematically low.
2.3. Spitzer Observations
BHR7 was observed with the Infrared Array Camera (IRAC; Fazio et al. 2004) on board the Spitzer Space
Telescope on 2008 December 22 as part of program 50477 (PI: Bourke) during the cryogenic portion of the mission.
This program observed BHR7 at 3.6, 4.5, 5.8, and 8.0 μm. Using the pipeline-processed images from the Spitzer Heritage Archive, we measured the photometry in the IRAC bands using a circular aperture radius of 25″ (∼10,000 au) and calculated the background using the median of an off-source patch of sky. The Spitzer photometry are listed in Table2.
2.4. CTIO Near-infrared Observations
BHR7 was observed at Cerro-Tololo Inter-American Obser-vatory (CTIO) on 2009 June 11 using the Infrared SidePort Imager (ISPI; van der Bliek et al. 2004) on the Blanco 4 m telescope. The conditions during the observations were photometric and the seeing was ∼0 9. ISPI provides a ∼10′ field of view on a 2048×2048 detector array. We observed BHR7 in J (1.25 μm), H (1.6 μm), and Ks (2.15 μm) bands. The observations were conducted in a 10-point box dither pattern with a dither step size of 60″. At each position in the dither, 4×15 s coadds were taken in H and Ks bands and 2×30 s coadds in the J band. The sky background was measured using a median combination of the dithered frames; the step size of 60″ preserved extended emission on this scale. A total integration time on source was 40 minutes for J band, 20 minutes for H band, and 30 minutes for Ks band. Further details that discuss the combination of the individual frames to make the final mosaic are given in Tobin et al. (2010b). The data were calibrated using the 2MASS photometry catalog (Skrutskie et al.2006)and the photometry are listed in Table2
and are extracted from the same aperture radius as the Spitzer-IRAC data.
2.5. Swedish-ESO Submillimetre Telescope Observations
The 1.2 mm (250 GHz) continuum observations were carried out with the 37 channel bolometer array SIMBA (SEST IMaging Bolometer Array) at the SEST (Swedish-ESO Submillimetre Telescope) on La Silla, Chile, between 2001 June and 2003 August, as part of a larger program to map the
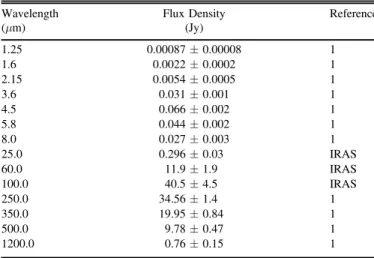
Table 2 BHR7 Photometry
Wavelength Flux Density Reference
(μm) (Jy) 1.25 0.00087±0.00008 1 1.6 0.0022±0.0002 1 2.15 0.0054±0.0005 1 3.6 0.031±0.001 1 4.5 0.066±0.002 1 5.8 0.044±0.002 1 8.0 0.027±0.003 1 25.0 0.296±0.03 IRAS 60.0 11.9±1.9 IRAS 100.0 40.5±4.5 IRAS 250.0 34.56±1.4 1 350.0 19.95±0.84 1 500.0 9.78±0.47 1 1200.0 0.76±0.15 1
Note. The uncertainties listed are statistical only and do not include systematic uncertainty from the absolute flux calibration accuracy. Furthermore, emission in the SPIRE bands is extended beyond the radius for which we measure it. Reference. (1) This work.
8 http://herschel.esac.esa.int/Docs/SPIRE/spire_handbook.pdf 9 http://herschel.esac.esa.int/Docs/PACS/html/pacs_om.html 10 http://herschel.esac.esa.int/Docs/SPIRE/html/spire_om.html
BHR (Bourke et al. 1995a) and Spitzer c2d cores (Evans et al. 2003; Kämpgen et al. 2004). The observations were obtained in fast-scanning mode (80″ per second), with multiple maps obtained at different orientations (hour angles), to reduce artifacts due to the mapping scheme. To estimate the atmospheric opacity sky-dips were undertaken about every three hours. The resulting zenith opacity values were 0.10–0.45. The beam size of an individual SIMBA bolometer was 24″ FWHM, and the positional accuracy was estimated to be 2″–3″ from frequent pointing scans on Centaurus A, η Carina, and Uranus. Flux calibration was determined to be accurate to about 10%, through maps of Uranus and Neptune. The rms at the map center is estimated to be 18 mJy beam−1
. All data were reduced and analyzed with the MOPSI software according to the instructions of the SIMBA Observer’s Handbook (2002)11and Kämpgen (2002).
3. Results
The synthesis of the multi-wavelength data set collected toward BHR7-MMS has enabled us to characterize the orientation, evolutionary state, luminosity, and the small-scale physical and kinematic structure. All of these data together contribute to a much better understanding of this system as an important test case for star formation theories.
3.1. Near-IR, Spitzer, and Herschel Imaging
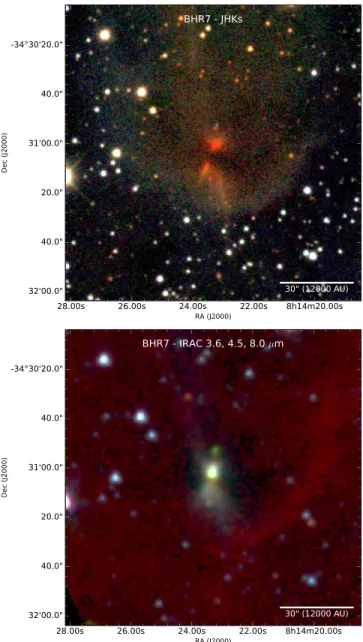
The near-infrared image with subarcsecond seeing and the
Spitzer-IRAC imaging shown in Figure1reveal the appearance of a prominent bipolar outflow cavity viewed in scattered light from a central illuminating source (the protostar and disk; e.g., Whitney et al.2003b). The system has a similar morphology in both its SED and images, to prototypical Class 0 protostars like L1527 IRS, B335, and L1157 (Looney et al.2007; Tobin et al.
2008; Stutz et al.2009), all of which are viewed near edge-on. However, toward BHR7-MMS, there is no point-like source visible between the outflow cavities as in L1527 IRS, which was due to scattered light from its edge-on disk (Tobin et al.
2010a). Moreover, BHR7-MMS exhibits a brightness
asym-metry with respect to the north and south cavities. The dark lane that is apparent from the near-infrared to 8 μm, the two clearly defined scattered light cavities, and the SED shape indicate that the protostar was most likely viewed at an inclination >60° but <90° (Whitney et al.2003a). It is difficult to more precisely determine the inclination from the SEDs and images alone due to degeneracies and asymmetry of the envelope (Furlan et al.2016). Finally, there are two prominent, apparently symmetric, shock knots located in the center of the outflow cavities. These knots are brightest in Ks and 4.5 μm due to the presence of a shock-excited H2emission line within
these bands. The symmetry of these knots is quite striking, they are both located at a distance of 10 9 (∼4360 au), indicating a near simultaneous ejection.
The extinction lane in the near-infrared image appears to have a different position angle with respect to the dark lane in the IRAC images. This likely reflects some degree of morphological complexity in the surrounding envelope (e.g., Tobin et al.2010b); there is also a hint of 8 μm absorption from the surrounding envelope against the mid-infrared background.
However, it is also clear that the system is externally illuminated, likely from a ultraviolet emitting source because of the limb-brightened 8 μm emission that is likely from polycyclic aromatic hydrocarbons (PAHs).
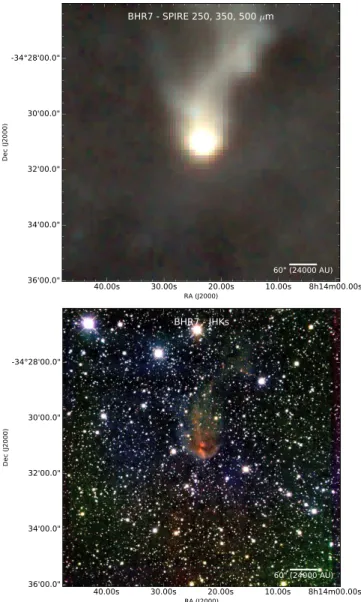
We show the Herschel SPIRE data in Figure2over a larger field that encompasses the dense core where the protostar is forming and a lower density tail extending north. We also show a view of the same field in the near-infrared and there is diffuse scattered light associated with some of the extended sub-millimeter emission. This view also shows that the cloud is extended in the direction of the outflow and that BHR7-MMS has formed at the end of this filamentary structure.
Figure 1. Images of BHR7 at J, H, and Ks bands (top) and Spitzer-IRAC 3.6, 4.5, and 8.0 μm (bottom); the wavelength order for both images are assigned to blue, green, and red colors, respectively. Notice the thick dark lane separating the north and south sides of the outflow cavity in both images. The outflow cavity appears in scattered light in nearly the north–south direction. There are also two knots in the center of the outflow cavity that are prominent in the Ks band and at 4.5 μm, tracing a shock in the outflow. The dark lane appears thicker at JHKs bands due to greater levels of extinction and it also has a slightly different angle. There also appears to be an “edge” to the envelope surrounding BHR7, appearing in diffuse scattered light at JHKs bands, but also in 8 μm, likely reflecting PAH emission.
11
http://www.apex-telescope.org/sest/html/internal-access/ OnlineManuals/Receivers/Simba/simba.ps
3.2. Spectral Energy Distribution
Using the near-infrared, Spitzer-IRAC, -IRAS, -SPIRE, and -SEST SIMBA data, we constructed the SED of this source in order to determine its evolutionary state and plot the SED in Figure 3. We measure a bolometric luminosity of 9.3L☉, a
bolometric temperature (Tbol) of 50.5K, and a ratio of
submillimeter to bolometric luminosity (Lbol) of 0.034. Both
of these measurements require integrating the SED for which we use the tsum procedure from the IDL Astronomy library that integrates the SED using trapezoidal integration. These values indicate that BHR7-MMS is a Class 0 protostar, having both
Tbol<70 K and Lsubmm/Lbol>0.005 (André et al.1993; Chen
et al.1995); both of these metrics are independent of distance. Furthermore, Lbolis significantly above the median for Class 0
protostars, near the top-end of the distribution for low-mass systems (Dunham et al.2014; Fischer et al.2017).
3.3. Molecular Line Kinematics
The SED reveals that this protostar is very young, but molecular lines are key to characterizing the kinematics of the envelope in order to determine if there is significant rotation or if it is dominated by infall motion alone. An isolated Class 0 source with an inclination of >60° is an ideal candidate to examine the kinematic properties of the infalling envelope. The lack of nearby sources and the clear geometric orientation simplify the interpretation of molecular line kinematic data. The observations in Extended and Compact configuration were set up for the mapping of kinematic tracers of the inner envelope (13CO, C18O, and H2CO), outer-envelope (H2CO and
N2D +
), disk (13CO, C18O), and outflow (12CO).
3.3.1. The Inner Envelope
To evaluate the molecular line kinematics, we utilize both moment maps made for the red- and blueshifted emission, but also by plotting the position and velocity of the molecular line (s). The position–velocity (PV) diagrams of the various molecular line emission are all made with a PV cut in exactly the east–west direction. The PV diagram is made by collapsing one spatial axis onto the other, summing a strip of specified width, thereby transforming the 3D datacube (position-position–velocity) into a 2D image ((position-position–velocity). While this position angle of the PV cut (90° east of north) is not exactly orthogonal to the outflow (off by 5°.9, see Section3.8), the PV cut direction matches the blue- and redshifted emission peaks of the various molecules.
We show the moment zero (integrated intensity) maps for
13
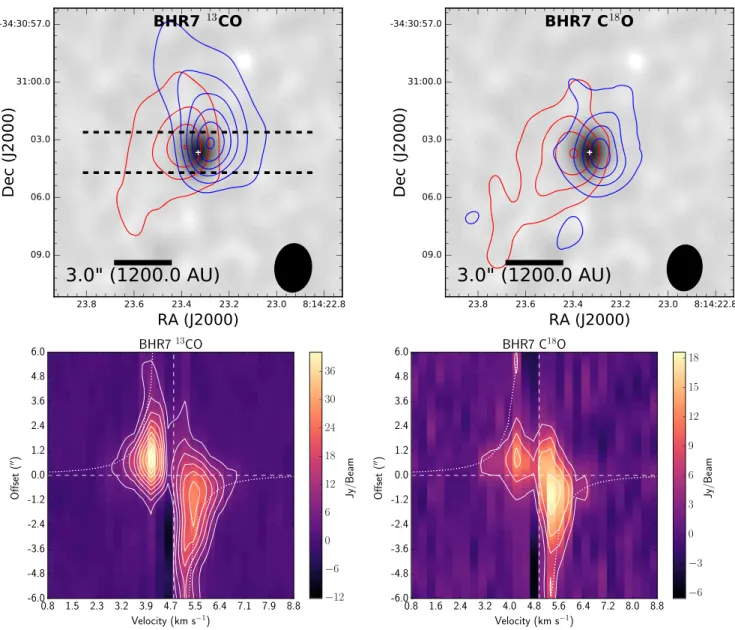
CO and C18O from the combined Compact and Extended configuration data in Figure4. The integrated intensity maps for the blue- and redshifted13CO and C18O emission clearly show a position shift between the blue and the red on scales <1300 au. The PV diagrams shown in Figure4 offer more detail on the kinematic structure of the emission. The PV diagrams show clearly separated blue- and redshifted components for both13CO and C18O, and both molecular lines are resolved out around the Figure 2. Herschel SPIRE image at 250, 350, and 500 μm (top) and a
wider-field J, H, and Ks image (bottom); the color ordering of the wavelengths is blue, green, and red, respectively. The SPIRE image shows the extended cloud and the dense core at the base where the protostar is forming. Some of the extended SPIRE emission has corresponding diffuse scattered light in the near-infrared as shown in the JHKs image.
Figure 3. Spectral energy distribution for BHR7. The 3.6–8.0 μm measure-ments are from Spitzer-IRAC, the 25–100 μm measuremeasure-ments are from IRAS, the 250–500 μm measurements are from Herschel SPIRE, and the 1.2 mm data point is from SEST SIMBA. From these data, we measured a bolometric luminosity of 9.3L☉and a bolometric temperature of 50.5K. The ratio of
submillimeter luminosity to bolometric luminosity of 0.034 meets criteria for a Class 0 protostar (>0.005; André et al.1993).
source velocity. The lower-velocity emission is observed to extend to larger radii and at a given offset there is a trend for either blue or redshifted emission to dominate; this is a clear indication of envelope rotation. There is sometimes both blue-and redshifted emission at a given position. The superposition of both blue- and redshifted emission at the same position is indicative of radial infall motion in an axisymmetric system (Tobin et al. 2012a; Sakai et al. 2014). We also notice that toward the source position there is higher-velocity emission evident in both13CO and C18O. Given that there is an indication of rotation at larger radii, this feature likely reflects the increased rotation velocity (or spin-up) of infalling material due to conservation of angular momentum.
To examine the increased velocity or spin-up observed at smaller radii, we make the same blue- and redshifted integrated intensity maps from the Extended configuration data only, see Figure 5. The same general features are observed for the
high-resolution data as for the low-resolution, but on smaller scales. The higher-resolution results in more large-scale emission being filtered out and the compact emission toward the source is more prominent. In the PV diagrams, the 13CO emission prominently shows the increased velocity at small radii. The C18O shows these features as well, but with lower S/ N. These data will be analyzed in more detail in Section3.4.
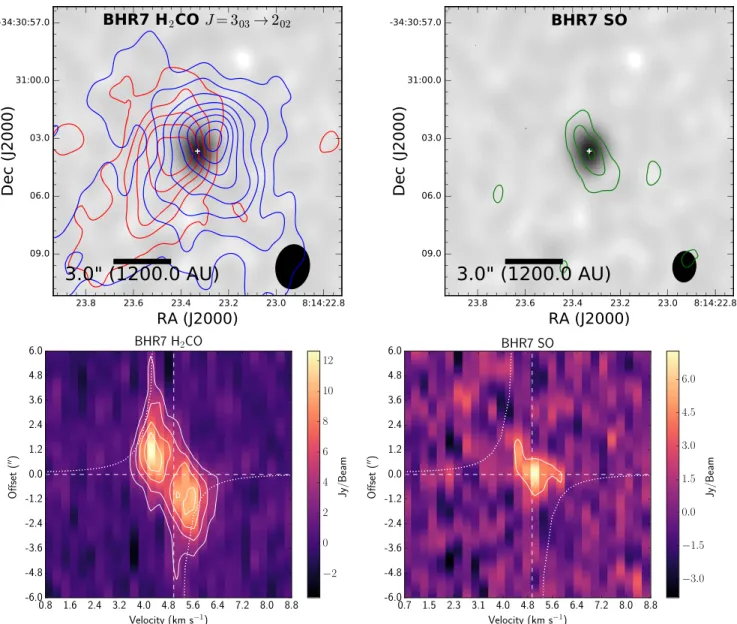
In addition to the CO isotopologues, we also examined the H2CO and SO molecular lines for indications of kinematic
structure on the scale of the inner envelope and disk. Sakai et al. (2014) detected SO toward L1527IRS that could be tracing an accretion shock in the outer disk and H2CO traced
both the inner infalling envelope and disk. The H2CO emission
shows a clear velocity gradient from the blue- and redshifted integrated intensity maps shown in Figure6; however, the PV diagram does not show the same high-velocity features toward the source position observed in the CO isotopologues Figure 4. BHR713CO and C18O blue- and redshifted integrated intensity maps (top panels) for the combination of SMA Extended and Compact observations,
overlaid on the continuum imaging from the Extended configuration (grayscale). The two CO isotopologues both clearly show a velocity gradient in the east–west direction, nearly orthogonal to the outflow PA. The dashed lines overlaid on the13CO integrated intensity map denote the region used for the PV diagram extraction for both13CO and C18O (12
″ length, 2 1 width). The PV diagrams are shown for the13CO and C18O (bottom panels), with a Keplerian rotation curve drawn for a
1.0M☉star. The dashed lines mark the source position and system velocity. The beams for the 13
CO and C18O observations are 2 53×1 92 and 2 39×1 82, respectively. For the13CO, the red contours start at 5.0σ and increase by 7.5σ and the blue contours start at 10.0σ and increase by 10.0σ, where σ
red=0.19K km s −1
(Figure5). The PV diagram shows a relatively linear change in velocity with position in the PV diagram, with some superposition of both red- and blueshifted emission at a given position. Furthermore, less emission is resolved-out at line center, indicating that H2CO emission is mainly coming from
the inner envelope and there is not significant large-scale H2CO
emission in the surrounding globule.
SO emission is detected at small radii and near the source velocity as shown in Figure 6. The integrated intensities are low, such that a separated blue- and redshifted integrated intensity map is not practical to generate. The brightest SO emission being near line center is consistent with the observations of L1527; however, there is a slight extension (beyond what is expected from the beam) along the direction of the outflow rather than orthogonal to it. While we cannot completely rule out an outflow shock component, an outflow shock is not expected to produce emission at the source
velocity without a higher-velocity component. Thus, we cannot firmly associate the SO emission of BHR7 to originate from small scales like L1527 at the resolution and sensitivity of the data in hand.
3.3.2. Outer Envelope
In addition to the probes of the inner envelope, we also observed N2D
+
(J= ), a tracer of cold dense gas3 2 (Crapsi et al. 2004; Emprechtinger et al. 2009; Tobin et al.
2013). The N2D
+
transitions, like the more abundant N2H
+molecule, have hyperfine structure. However, in the
(J= ) transition, many of the brightest hyperfine lines3 2 are at similar frequencies, and we only detect the main, blended lines well with the SMA and not the weaker, more widely separated hyperfine lines. We show integrated intensity maps of the N2D
+
emission in Figure 7, overlaid on the 1.3 mm continuum and near-infrared images. The emission is clearly Figure 5. BHR713CO and C18O blue- and redshifted integrated intensity maps from the SMA Extended configuration only (upper panels), overlaid on the continuum imaging from Extended configuration (grayscale). Like the lower-resolution data, both13CO and C18
O trace a smaller-scale velocity gradient orthogonal to the outflow direction, centered on the continuum position. The PV diagrams shown in the bottom panels for the13CO and C18O are extracted using the same region in Figure4, with a Keplerian curve for a 1.0M☉star drawn (dotted line). The dashed lines mark the source position and system velocity. The beams for the
13CO and C18O
observations are both 1 6×1 2. For the13CO, the red and blue contours start at and increase by 3.0σ, where σred=0.43K km s −1
and σblue=0.51Kkm s −1
. Then for the C18O, the red contours start at 3σ and increase by 2σ, and the red contours start at 3σ and increase by 1σ; σ
red=0.52K km s −1 and
coming from larger scales than the CO isotopologues, H2CO,
and SO emission. The PV diagram shows that there is a velocity gradient in the outer envelope that connects with the inner envelope velocities probed by the CO isotopologues and H2CO. The velocity gradient could reflect rotation on this scale,
but it has also been proposed that large-scale velocity gradients could also reflect infall of asymmetric envelope structures (Tobin et al. 2011,2012a).
The N2D +
appears to follow the direction of the dark lane observed in the near-infrared and it has a deficit of emission toward the protostar position. The deficit is expected because N2D
+
(and N2H +
)is destroyed by efficient reactions with gas-phase CO (Caselli et al. 1999; Bergin et al. 2001; Jørgensen
2004). The presence of gas-phase CO toward the inner regions of the envelope around BHR7-MMS is clear from Figures4and5. Moreover, temperatures around and above the sublimation point
of CO will also inhibit the formation of N2D +
by reversing the reaction that forms H2D
+
, the key molecule for low-temperature deuterium chemistry (e.g., Langer1985). The observed morph-ology of N2D
+
resembles other protostars with resolved observations of this molecule (e.g., L1157; Tobin et al.2013), but the N2D
+
emission peaks on either side of the protostar do not appear to be as symmetric as in L1157. The asymmetry could result from an asymmetric distribution of envelope material around the protostar.
3.4. Rotation Curve Analysis
While the signature of rotation is evident in the13CO and C18O moment maps and PV diagrams, further analysis is necessary to determine the radial dependence of the rotation curve. This will enable us to determine if the rotation curve reflects conservation of angular momentum (v∝R−1
), Figure 6. SMA H2CO (upper left) and SO (upper right) integrated intensity contours overlaid on the 1.3 mm continuum (grayscale). The H2CO is a combination of
Extended and Compact observations, while the SO is Extended configuration only. The H2CO clearly shows a velocity gradient, in the same sense as the CO
isotopologues, but with an apparent position angle that is slightly larger. The SO emission is compact and a clear blue- and redshifted separation is not evident at this resolution and sensitivity. The PV diagrams shown for H2CO and SO (bottom panels) are extracted using the same region shown in Figure4with a Keplerian curve
for a 1.0M☉star drawn (dotted line). The H2CO does not strongly trace the higher velocities of the inner envelope, but H2CO does trace the infalling/rotating
envelope beyond the extent of the13CO and C18O emission very well. The SO appears compact in velocity space. The dashed lines mark the source position and
system velocity. The H2CO beam is 2 3×1 75 and the SO beam is 1 6×1 2. The SO contours start and increase on 3σ intervals, where σ=0.7Kkm s −1
. For the H2CO, the contours start and increase on 3σ intervals and σred,blue=0.18Kkm s
Keplerian rotation (v∝R−0.5
), or both on different spatial scales. To examine the rotation curve, we measure the position of the13CO and C18O intensity peaks in each velocity channel by fitting a 2D Gaussian. We only select channels with S/N>4 and where the emission is not extended more than ∼3 resolution elements, enabling the emission peak to be traced as a function of radius. We have plotted the results with their associated velocities (relative to the source) in log–log space, yielding a more quantitative means to evaluate the kinematic structure (e.g., Tobin et al. 2012b; Yen et al. 2013; Ohashi et al.2014). We refer to this plot as the Peak PV-diagram. The Peak PV-diagram derived from the high-resolution 13CO and C18O data (see Figures4 and5)is shown in Figure8. As the data points lie on a line in log–log space, we fitted a power law using a Monte Carlo simulation and the least-squares fitting algorithm. The power of the best fit is −1.02±0.04, consistent with material rotating with conserved angular momentum down to a radius of ∼170 au, the smallest radial displacement measured in the molecular line data. Thus, we cannot identify a Keplerian rotation signature in the Peak PV-diagram, likely because the Keplerian region is found on smaller radii than we can examine with our observations. More sensitive observations will be required to probe the kinematics down to smaller radii to clearly identify a region of Keplerian rotation. We discuss the implications of the detected rotation further in Section4.
3.5. Subarcsecond Resolution SMA Data
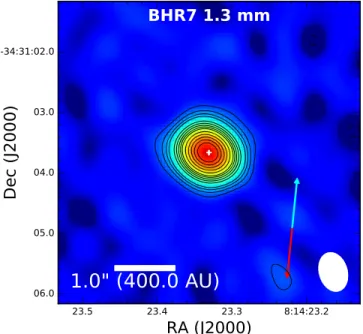
We observed BHR7-MMS at the highest resolution available at 1.3 mm from the SMA (0 6×0 45; 240 au×180 au) to determine if there was evidence of resolved structure on sub-500 au scales; the inclination of >60°helps simplify the interpretation of the continuum morphology. The SMA continuum image at the highest resolution is shown in Figure9; this image is produced using only the Very Extended data. The image shows a very strong 1.3 mm detection that is extended along the minor axis of the beam, orthogonal to the outflow direction (Section3.8).
The deconvolved size of the continuum source is 0 52±0.01×0 15±0.04 (208 au × 60 au) with a position angle of 91°±2°. This is suggestive of a compact, disk-like structure around BHR7-MMS with a radius of ∼104 au, at the assumed distance of 400 pc. If the continuum is tracing a symmetric, geometrically thin disk, we can estimate the inclination of the disk by taking the inverse cosine of the minor/major axis obtained from the Gaussian fit deconvolved from the synthesized beam. Note that this method will break down when the source inclination approaches 90° (edge-on) because the disk is not infinitely thin and the inherent thickness will never result in an inclination that is 90°. With these assumptions and caveats in mind, we estimate the system inclination to be 73°.2, which is consistent with the estimates Figure 7. SMA N2D
+
(J= ) observations from the combination of Extended and Compact observations; however, the data are tapered to the resolution of the3 2 Compact configuration to increase the sensitivity to large structures. The left panel shows the N2D
+
integrated intensity contours overlaid on the Ks-band image, highlighting the coincidence of the thick dark lane. The middle panel shows the N2D+integrated intensity contours overlaid on the 1.3 mm continuum. The N2D+
emission is tracing the cold outer envelope, where CO is frozen-out and formation of H2D +
and N2D +
is efficient. The peaks of the N2D +
emission are off the continuum source, as expected for a protostellar system with significant internal heating. The PV diagram for N2D+, shown in the far right panel, is extracted along
the same position angle denoted by the dashed lines in the middle panel (20″ length, 7 75 width). The PV diagram also shows a large-scale velocity gradient in the envelope surrounding BHR7, possibly tracing rotation on scales outside H2CO and CO isotopologue emission. The beam is 4 3×3 2 and the contours start at and
increase on 2σ intervals, where σ=0.1Kkm s−1.
Figure 8. The Peak PV diagram of BHR7-MMS, including the fitted power law (solid green line) using13CO and C18O data. The fit to the power law is −1.02±0.04 and thus is consistent with conservation of angular momentum (v∝r−1). The dashed line shows a broken power law assuming the break point at 120 au, 2.58km s−1, which is denoted by a green dot. With the adopted break point of 120 au the inferred mass of the protostar is ∼1±0.4M☉. Red
data points are redshifted, blue data points are blueshifted with respect to the source velocity.
based on the SED and image morphology. The integrated flux-density of the source is 197±2.2 mJy (127±1 mJy peak); these measurements also result from the Gaussian fit. The lower-resolution Compact data are more sensitive to the extended envelope emission and we observe an integrated flux density of 273±49 mJy.
3.6. Mass Estimates from Dust Continuum
The mass of the envelope and compact structure in BHR7 can be estimated using the flux density of the dust continuum emission observed toward it. Under the assumption that the dust emission is optically thin and isothermal, the dust mass is given by M D F B T . 1 dust 2 dust k = l l l( ) ( )
D is the distance (∼400 pc), Fλis the observed flux density, Bλ
is the Planck function, Tdustis the dust temperature, and κλis
the dust opacity at the observed wavelength. Tdustis assumed to
be 30K, consistent with temperature estimates on ∼100 au scales (Whitney et al. 2003b) and κλ is 0.899, taken from
Ossenkopf & Henning (1994). We then multiply the resulting value of Mdustby 100, assuming the canonical dust to gas mass
ratio of 1:100 (Bohlin et al. 1978).
The flux density from the Very Extended observations of 197±2.2 mJy translates to a mass of 0.42M☉ and the flux
density from the Compact observations of 273±49 mJy translates to 0.51M☉. Because the interferometer is missing
some flux, we also calculate the mass from the 1.2 mm SIMBA flux density measurement from SEST. The flux density was 0.76Jy at 1.2 mm, translating to a mass of 1.2M☉, assuming
the dust opacity spectral index of ∼1.8 from Ossenkopf &
Henning (1994). If we extrapolate the 1.2 mm flux density to 1.3 mm using the dust opacity spectral index of ∼1.8, the SIMBA flux density is ∼0.55Jy. This means that a bit less than half of the continuum emission is coming from subarcsecond scales (radii < 200 au), as traced by the Very Extended observations, and the rest is coming from the extended envelope. Furthermore, we had assumed a temper-ature of 30K in the previous calculations, if the average temperature traced in the SIMBA data was 20K rather than 30K, the corresponding mass would be 2.03M☉. The Herschel500 μm also traces cold dust from the envelope and if we assume T=20K and the same dust opacity spectral index, the mass is calculated to be 1.55M☉. The 500 μm data
may be more affected by opacity from scales near the disk and this could underestimate the total mass.
3.7. Visibility Amplitude Profile
The visibility amplitude data themselves can also reveal signatures of structure that are not readily apparent in the images. We show the visibility amplitude profile toward BHR7-MMS in Figure 10 for the combined Compact, Extended, and Very Extended data sets. We present three different views of the visibility amplitude data, standard circular averaging, a section of the uv-plane along the major axis of the source (orthogonal to the outflow) and a section along the minor axis of the source (along the outflow). There is a clear envelope component at short uv-distances, where the amplitudes steeply rise and then there is a more slowly declining component from about 30 to 300 kλ. At uv-distances >50kλ, the three points begin to diverge and visibility amplitudes along the major axis decline more rapidly than those along the minor axis; a similar analysis technique was also employed by Aso et al. (2017). The divergence of the three profiles is indicative of a flattened structure. This trend is Figure 9. SMA 1.3 mm continuum image of BHR7-MMS from the Very
Extended configuration. The image shows a resolved dust continuum source embedded within BHR7. The source is clearly extended orthogonal to the outflow direction, marked by the blue and red arrows. The width of the continuum source is substantially wider than the minor axis of the 0 6×0 45 (240 au× 180 au) beam. The deconvolved size of the continuum source is 0 52±0.01×0 15±0.04 (208 au × 60 au) with a position angle of 91°±2°. This is indicative of a compact, disk-like structure in BHR7.
Figure 10. Visibility amplitudes from the combined Compact, Extended, and Very Extended data sets. We show both the circularly averaged visibility amplitudes and cuts in the uv-plane along the major and minor axes of the envelope. The major axis decreases more rapidly, demonstrating that the system is more compact along the direction of the outflow than along the equatorial plane of the disk. We overlay visibility amplitudes from radiative transfer models of a rotating, infalling envelope (dotted line) (Ulrich1976; Cassen & Moosman1981)and a 100 au disk, having a surface density profile proportional to R−1(dashed line). The combination of these two components is
shown as the solid line. Assuming that all the emission is optically thin, the data are consistent with a 1.57 M☉envelope and a 0.47 M☉disk. We also
overlay an infalling envelope with a volume density profile proportional to R−2 (dotted–dashed line) and a rotationally flattened envelope (triple-dotted–dashed line). Both envelope models do not have an embedded disk included and they were scaled to match the shortest visibility amplitude. The imaginary plot on the bottom shows some hints of possible nonaxisymmetry (systematically nonzero values) but at low S/N.
evident to uv-distances >200 kλ (scales <1″). There is also a signal at the greatest uv-distance we measure, indicating that the structure in BHR7 is not fully resolved. The slowly declining component reflects a more compact structure, possibly a disk.
The imaginary visibility amplitudes also show some structure, a symmetric source would have an imaginary component with zero amplitude. Therefore, we are tracing some asymmetric structure in the envelope down to scales approaching the disk size. However, it is difficult to quantify the nature of the asymmetry with our S/N, but we can further analyze the real component using simple models for envelope and disk structure. In Figure 10, we also overlay model visibility amplitude profiles for several different density structures: a disk with a surface density profile of R−1
and radius of 100 au, an envelope undergoing rotating collapse (Ulrich 1976; Cassen & Moosman 1981) with a centrifugal radius of 100 au (the density profile inside the centrifugal radius is proportional to R−1/2
inside of the centrifugal radius and proportional to R−3/2
outside), a power-law envelope with a radial density profile proportional to R−2, and the combina-tion of a disk and the rotating collapse model.
These models are from the same set of Hyperion (Robitaille 2011)models used in Tobin et al. (2015), and we assume that the emission is optically thin such that we can freely scale and combine the two components without rerunning the radiative transfer model. The two envelope-only models are scaled to match the point with the smallest
uv-distance, but do not contain an embedded disk. This shows that an envelope-only model cannot describe the observational data without a disk component. Even if the envelope-only models were scaled up to come closer to matching the small-scale structure, the shape of visibility amplitude profiles are inconsistent with the profile observed from baselines longer than 50 kλ. Thus, the visibility amplitude profile for a 100 au disk provides the best match to the data.
The data are consistent with an envelope having a centrifugal radius of 100 au and a mass of 2.1 M☉, within the envelope an
embedded disk with a 100 au radius and a mass of 0.47 M☉is
needed to reproduce the visibility amplitude profile. This analysis demonstrates that the data cannot be fit with an envelope-only model, requiring a more compact component that is consistent with a disk. A self-consistent radiative transfer model of the disk and envelope, as well as the SED, is reserved for future work.
3.8. Outflow
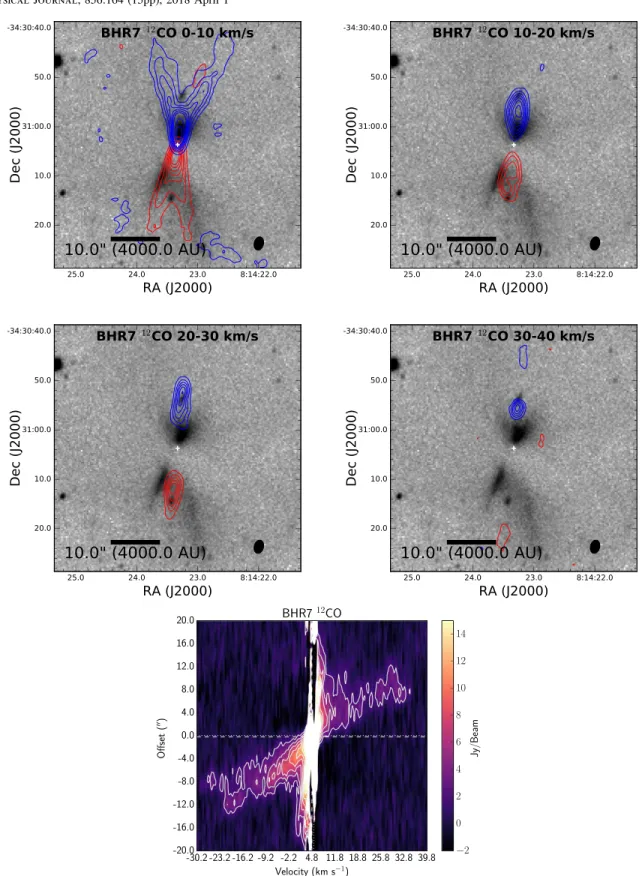
While the near-infrared and Spitzer data indicate the presence of an outflow carving out cavities observed in scattered light, the SMA observations provide the first direct measurements of the molecular outflow. The outflow from BHR7-MMS is clearly detected in 12CO and the integrated intensity maps of the red- and blueshifted sides of the outflow at different velocity ranges are shown in Figure11. The outflow exhibits a structure typical for some Class 0 protostars, a wide-angle component at low-velocity and a collimated high-velocity molecular jet (e.g., Hirano et al. 2010). From the orientation of the high-velocity jet, the outflow position angle (PA) is about −5°.9 east of north. The PV diagram taken along the outflow is also shown in Figure11. It shows the significant outflow emission out to±30 km s−1from the systemic velocity.
The near-infrared and Spitzer-IRAC images also show two bright knots of shocked molecular line emission. Their peak brightness at 4.5 μm is indicative of the line emission being dominated by shock-excited H2 emission. There is some
emission in the Ks band that also contains an H2line, but it is
not as bright and/or peaked as the 4.5 μm emission. This could result from the Ks-band feature being more affected by extinction than the 4.5 μm feature. The outflow knots are located at nearly symmetric positions along the outflow axis. The northern knot is 11 2 (4480 au) from the continuum source and the southern knot is 10 75 (4300 au) from the continuum source.
The maximum observed velocity with respect to the systemic velocity is ∼30 km s−1
; this is approximate because there may be emission below our sensitivity limit at higher velocities. Correcting this velocity for the approximate inclination of 73°.2 the true velocity of the highest velocity outflow is ∼104 km s−1. If the H2knots are traveling along this outflow with the same velocity, their time since ejection is ∼205years and would be moving at a rate of ∼22 auyr−1
(0 055 yr−1
). Thus, the proper motion of these knots should be detectable now or in the near future given that the images presented here were taken in 2008 (IRAC) and 2009 (JHKs).
We examined the outflow for indications of other shock-tracing species. We did detect SO emission, but it is centered toward the protostar position with a slight extension in the outflow direction and only detected at low velocities. SiO was not detected in our observations. This indicates that the SO emission is not being produced by shocks in the extended outflow and that the outflow shocks are not strong enough to produce detectable SiO emission.
4. Discussion
The data and results presented for BHR7 show a well-developed, isolated protostar system that appears prototypical in many ways. It has a well-defined outflow-carved cavity that is apparent in scattered light between 1.6 and 8 μm, and the outflow is also traced by CO emission, having a low-velocity, wide-angle cavity and a narrow, collimated higher-velocity flow that is aligned with the HH-knots apparent in the near-infrared. The features of the outflow strongly resemble other “prototype” systems like HH212 and L1448C (e.g., Zinnecker et al. 1998; Lee et al.2007; Hirano et al.2010). However, it remains unclear if shock-tracers like SiO are also associated with the jet; SiO was not detected in the current SMA data.
The velocity gradients, likely tracing rotation except at perhaps the largest scales, are exhibited in multiple mole-cular tracers (N2D
+
, C18O, 13CO, and H2CO). The C18O and 13
CO appear to trace the rotating, infalling envelope while conserving angular momentum, as evidenced by the R−1
velocity profile shown in Figure8. Thus, it bears remarkable similarity to the earlier data on L1527IRS from the SMA and Nobeyama Millimeter Array (Ohashi et al. 1997; Yen et al.
2013), but BHR7-MMS has a stronger indication of rotation. L1527IRS, and other sources that also showed conserved angular momentum (and/or rotation) in early data (e.g., VLA 1623, HH212, Lupus MMS3 Murillo et al. 2013; Lee et al. 2014; Yen et al. 2015,2017) were later found to have rotationally supported disks when viewed at higher resolution and sensitivity.
4.1. Does BHR7-MMS Contain A Rotationally Supported Disk?
The13CO, C18O, and H2CO all show indications of rotation
in the envelope and the high-resolution13CO and C18O, show
rotation down to hundreds of astronomical unit scales. The velocity profile also shows conserved angular momentum from thousands of astronomical units down to hundreds of Figure 11. SMA12CO integrated intensity contours in multiple velocity ranges overlaid on the Ks-band near-infrared image. The outflow clearly shows evidence for both a wide-angle (0−10 km s−1
)and a collimated high-velocity outflow (>10 km s−1). The high-velocity features also coincide with the knots of H
2emission within
the outflow cavity that are consistent with shocks. The bottom-most panel shows a position–velocity diagram extracted along the outflow axis, averages in a strip with an angular width of 10 25. The beam is drawn in the lower right corner of each panel and is 2 75×1 91. The contours in the 0−10 km s−1panel start at 5.0σ and
increase in 7.5σ intervals; σred=0.39K and σblue=0.38Kkm s−1. For the 10−20 km s−1and 20−30 km s−1panels, the contours start at and increase at 5σ, where
σred,blue=0.42Kkm s −1
. Lastly, for the 30–40 km s−1panel the contours start at 4σ and increase at 2σ intervals where σ
red,blue=0.42Kkm s −1.
astronomical units. The scales on which we observe rotation are small enough that magnetic braking will not be strong enough to reverse the increasing rotation velocities (e.g., Zhao et al.2018). Nevertheless, the current spectral line data do not yet have resolution and sensitivity to resolve and firmly identify the Keplerian region.
In addition to the strong rotation of the inner envelope, the SMA continuum observations at ∼0 5 resolution show that the dust emission is resolved orthogonal to the outflow direction with a radius of ∼104 au (deconvolved Gaussian half width at half maximum). The state at which we observe BHR7-MMS is remarkably similar to L1527IRS and VLA 1623, where both had resolved dust continuum orthogonal to the outflow and indications of rotation from lower-resolution kinematic data. The analyses presented in Sections 3.5 and 3.7, show that continuum data are consistent with the presence of a disk at the heart of the rotating envelope. However, we cannot conclu-sively conclude that such a continuum structure is tracing a rotationally supported disk around the protostar.
The molecular line kinematics do show rotation up to near the radius of the continuum emission. Thus, if the disk is rotationally supported, we can simplistically estimate the protostar mass by assuming a Keplerian radius. We adopt a Keplerian radius of 120 au from resolved dust continuum emission discussed in Section3.5. This radius corresponds to the radius of the 3σ contour and is slightly larger than the deconvolved half width at half maximum from the Gaussian fit. For a Keplerian radius of 120 au, we extrapolated the conserved angular momentum power law, finding a velocity of 2.58 km s−1 at the adopted Keplerian radius. We show in Figure 8 that this radius is just beyond the smallest radius detected by the 13CO and C18O data. Using the formula
v=(GM/R)0.5, we find that with the assumptions outlined
above, the protostar mass could be 1.0M☉. This estimate
incorporates the ∼73° inclination calculated in Section 3.5
from the Gaussian fit to the continuum.
This estimate of central protostar mass is contingent upon both the continuum tracing a fully Keplerian disk (which may not be the case). If the true Keplerian disk is smaller, then the protostar mass would be larger; the protostar mass will scale inversely with the Keplerian radius. For example, if the Keplerian radius is actually 60 au, then the protostar mass would be ∼2M☉. While there is considerable uncertainty in
the protostar mass, estimates substantially above ∼1M☉may
be overly large considering the bolometric luminosity of 9.3L☉.
4.2. Likelihood of Gravitational Instability
The mass of the postulated disk was found to be large from both the isothermal dust mass calculation (Mdisk=0.42 M☉)
and the visibility amplitude profile analysis (Mdisk=0.47 M☉)
in Sections3.5and3.7. However, both of these mass estimates assume a gas to dust mass ratio of 100:1, which can evolve (Ansdell et al. 2016), but it is unclear if any reduction of this ratio is expected in the protostellar phase. Assuming that both the Mdisk=0.42M☉value and M*=1.0M☉are accurate, we
can examine the likelihood of gravitational instability in the disk of BHR7-MMS.
The typical analytic criterion for stability of a rotating system is given by Toomre’s Q, calculating the ratio of thermal
pressure support and rotation shear to gravity in the form
Q c G. 2 s p = W S ( )
Values greater than 1 indicate that the disk is stable against self-gravity and values less than 1 indicate that the disk is unstable and may be prone to fragmentation.
This equation can be rewritten for a disk (Kratter & Lodato2016; Tobin et al.2016)in the form
Q M M H r 2 . 3 d * » ( )
H=cs/Ω is the disk scale height, csthe disk sound speed, and Ω the Keplerian angular velocity. Using the disk and star masses derived above, and a typical disk temperature of 30K (cs= 0.3 km s
−1)
at a radius of 50 au (Ω ∼ 5.6×10⁻¹⁰
s−1
),
Q≈0.4. We can also see from this equation that Q will scale
as M*0.5 from the angular velocity dependence on protostar
mass; therefore, if the current disk mass is accurate, it is possible that the disk is gravitationally unstable. However, another limiting factor may be the uncertainty in the distance (D)to this protostar because the disk mass from dust emission will scale as D2, but protostar mass measured from the spectral line emission will scale linearly with distance, making Q scale as D1.5. Thus, if BHR7 is somehow a factor of 2 closer than the adopted 400 pc distance, the disk mass will be 4× lower and the protostar mass will be 0.5M☉, making Q∼1.1. We also
note that it is possible that we are underestimating the mass in the disk component if it is optically thick.
Future high-resolution observations will be required to more accurately determine the disk and protostar mass to better assess its likelihood of gravitational instability. Moreover, higher-resolution continuum imaging may directly reveal fragments or spiral structure that have recently been uncovered in disks by ALMA (Pérez et al. 2016; Tobin et al. 2016). Finally, Gaia parallaxes of foreground/background stars will enable the distance of the BHR7 globule to be better constrained.
5. Conclusions
We have characterized the protostar within the isolated dark globule BHR7 from the near-infrared to the submillimeter using data from the CTIO 4 m, Spitzer, IRAS, Herschel, SEST SIMBA, and the SMA. We have made the first determination of bolometric luminosity 9.3 L☉ and bolometric temperature
(50.5 K) for this protostar, confirming that it is a Class 0 protostar with a luminosity that is higher than the ∼1L☉
median in the nearby star-forming regions (Dunham et al. 2014). The near-infrared at Ks band and Spitzer-IRAC bands show that the source has a well-defined outflow cavity separated by a dark lane. The outflow cavity is traced by an impressive CO outflow that shows both low-velocity wide-angle emission and a collimated, high-velocity jet that has an axis that is consistent with observed knots of shocked-excited H2gas.
We conducted further submillimeter interferometric observa-tions using the SMA in three configuraobserva-tions to examine both the molecular line emission from the envelope down to near the scale of the disk, as well as the small-scale continuum structure. The 13CO and C18O kinematics indicate clear rotation in the
inner envelope and the rotation curve in the the inner envelope is consistent with conserved angular momentum. The SMA continuum observations with ∼0 5 resolution resolve the continuum orthogonal to the outflow direction, possibly tracing a disk. The deconvolved size of the continuum indicates that the disk radius may be ∼100 au and have an inclination near 73°. Analysis of the visibility amplitude profile down to subarcsecond scales requires the presence of a compact structure other than a power law or rotationally flattened envelope. A disk plus a rotationally flattened envelope can reproduce the visibility amplitude profile The strong envelope rotation, coupled with the resolved continuum image and visibility amplitude profile are possible evidence for a rotationally supported disk within this system. We estimate the disk mass from the continuum emission to be ∼0.32M☉
and the gas kinematics (assuming a rotationally supported disk radius of ∼120 au) indicate that the protostar mass could be ∼1M☉. With these two pieces of information, we calculate Toomre’s Q, finding that if the observations reflect a rotationally supported disk, it may be gravitationally unstable.
Furthermore, H2CO and N2D +
observations from larger radii indicate that the envelope still exhibits a velocity gradient beyond 1000 au with a gradient direction consistent with the smaller-scale 13CO and C18Oemission; this possibly indicates bulk rotation of the outer envelope.
These observations as a whole demonstrate that BHR7 may be an excellent prototype source for studies of star formation, given its isolation from confusing, external influence and its classic outflow and inner envelope rotation profile. Future observations will reveal whether or not there is indeed a rotationally supported disk and if it is currently only forming a single star. However, despite its gifts, the ambiguity of the distance toward BHR7 must be resolved to more firmly characterize its properties, and forthcoming parallax data from
Gaiashould enable more firm constraints on its distance in the
near future.
J.J.T. acknowledges support from the Homer L. Dodge Endowed Chair and grant 639.041.439 from the Netherlands Organisation for Scientific Research (NWO). This work is based in part on observations made with Herschel, a European Space Agency Cornerstone Mission with significant participa-tion by NASA. The authors wish to thank the SMA staff for their tireless efforts in keeping the facility operational and conducting the observations. The Submillimeter Array is a joint project between the Smithsonian Astrophysical Observatory and the Academia Sinica Institute of Astronomy and Astro-physics and is funded by the Smithsonian Institution and the Academia Sinica. The authors wish to recognize and acknowl-edge the very significant cultural role and reverence that the summit of Maunakea has always had within the indigenous Hawaiian community. We are most fortunate to have the opportunity to conduct observations from this mountain.
Facilities: SMA, Herschel, Spitzer, Blanco (ISPI). ORCID iDs
John J. Tobin https://orcid.org/0000-0002-6195-0152
Michael M. Dunham https://orcid.org/0000-0003-0749-9505
Nienke van der Marel https://orcid.org/0000-0003-2458-9756
References
André, P., Ward-Thompson, D., & Barsony, M. 1993,ApJ,406, 122
Ansdell, M., Williams, J. P., van der Marel, N., et al. 2016,ApJ,828, 46
Aso, Y., Ohashi, N., Aikawa, Y., et al. 2017, arXiv:1707.08697
Bergin, E. A., Ciardi, D. R., Lada, C. J., Alves, J., & Lada, E. A. 2001,ApJ,
557, 209
Bohlin, R. C., Savage, B. D., & Drake, J. F. 1978,ApJ,224, 132
Bourke, T. L., Hyland, A. R., & Robinson, G. 1995a,MNRAS,276, 1052
Bourke, T. L., Hyland, A. R., Robinson, G., James, S. D., & Wright, C. M. 1995b,MNRAS,276, 1067
Caselli, P., Walmsley, C. M., Tafalla, M., Dore, L., & Myers, P. C. 1999,
ApJL,523, L165
Cassen, P., & Moosman, A. 1981,Icar,48, 353
Chen, H., Myers, P. C., Ladd, E. F., & Wood, D. O. S. 1995,ApJ,445, 377
Cieza, L. A., Casassus, S., Tobin, J., et al. 2016,Natur,535, 258
Codella, C., Cabrit, S., Gueth, F., et al. 2014,A&A,568, L5
Crapsi, A., Caselli, P., Walmsley, C. M., et al. 2004,A&A,420, 957
Dunham, M. M., Stutz, A. M., Allen, L. E., et al. 2014, in Protostars and Planets VI, ed. H. Beuther et al. (Tucson, AZ: Univ. of Arizona Press),195
Emprechtinger, M., Caselli, P., Volgenau, N. H., Stutzki, J., & Wiedner, M. C. 2009,A&A,493, 89
Evans, N. J., II, Allen, L. E., Blake, G. A., et al. 2003,PASP,115, 965
Fazio, G. G., Hora, J. L., Allen, L. E., et al. 2004,ApJS,154, 10
Fischer, W. J., Megeath, S. T., Furlan, E., et al. 2017,ApJ,840, 69
Furlan, E., Fischer, W. J., Ali, B., et al. 2016,ApJS,224, 5
Griffin, M. J., Abergel, A., Abreu, A., et al. 2010,A&A,518, L3
Hartley, M., Tritton, S. B., Manchester, R. N., Smith, R. M., & Goss, W. M. 1986, A&AS,63, 27
Hirano, N., Ho, P. P. T., Liu, S.-Y., et al. 2010,ApJ,717, 58
Ho, P. T. P., Moran, J. M., & Lo, K. Y. 2004,ApJL,616, L1
Jørgensen, J. K. 2004,A&A,424, 589
Kämpgen, K. 2002, Masterʼs thesis, Astronomisches Institut der Ruhr-Universität Bochum
Kämpgen, K., Chini, R., Nielbock, M., & Albrecht, M. 2004, in Proc. of the 4th Cologne-Bonn-Zermatt Symp., Vol. 91, The Dense Interstellar Medium in Galaxies, ed. S. Pfalzner et al. (Berlin: Springer),405
Kratter, K., & Lodato, G. 2016,ARA&A,54, 271
Kratter, K. M., Matzner, C. D., Krumholz, M. R., & Klein, R. I. 2010,ApJ,
708, 1585
Langer, W. D. 1985, in Protostars and Planets II, ed. D. C. Black & M. S. Matthews (Tucson, AZ: Univ. of Arizona Press),650
Lee, C.-F., Hirano, N., Zhang, Q., et al. 2014,ApJ,786, 114
Lee, C.-F., Ho, P. T. P., Hirano, N., et al. 2007,ApJ,659, 499
Lindberg, J. E., Jørgensen, J. K., Brinch, C., et al. 2014,A&A,566, A74
Looney, L. W., Tobin, J. J., & Kwon, W. 2007,ApJL,670, L131
McMullin, J. P., Waters, B., Schiebel, D., Young, W., & Golap, K. 2007, in ASP Conf. Ser. 376, Astronomical Data Analysis Software and Systems XVI, ed. R. A. Shaw, F. Hill, & D. J. Bell (San Francisco, CA: ASP),127
Murillo, N. M., & Lai, S.-P. 2013,ApJL,764, L15
Murillo, N. M., Lai, S.-P., Bruderer, S., Harsono, D., & van Dishoeck, E. F. 2013,A&A,560, A103
Ohashi, N., Hayashi, M., Ho, P. T. P., & Momose, M. 1997,ApJ,475, 211
Ohashi, N., Saigo, K., Aso, Y., et al. 2014,ApJ,796, 131
Ossenkopf, V., & Henning, T. 1994, A&A,291, 943
Pérez, L. M., Carpenter, J. M., Andrews, S. M., et al. 2016,Sci,353, 1519
Poglitsch, A., Waelkens, C., Geis, N., et al. 2010,A&A,518, L2
Robitaille, T. P. 2011,A&A,536, A79
Sakai, N., Oya, Y., Sakai, T., et al. 2014,ApJL,791, L38
Santos, N. C., Yun, J. L., Santos, C. A., & Marreiros, R. G. 1998, AJ,
116, 1376
Sault, R. J., Teuben, P. J., & Wright, M. C. H. 1995, in ASP Conf. Ser. 77, Astronomical Data Analysis Software and Systems IV, ed. R. A. Shaw, H. E. Payne, & J. J. E. Hayes (San Francisco, CA: ASP),433
Skrutskie, M. F., Cutri, R. M., Stiening, R., et al. 2006,AJ,131, 1163
Stutz, A. M., Rieke, G. H., Bieging, J. H., et al. 2009,ApJ,707, 137
Testi, L., Birnstiel, T., Ricci, L., et al. 2014, in Protostars and Planets VI, ed. H. Beuther et al. (Tucson, AZ: Univ. of Arizona Press),339
Tobin, J. J., Bergin, E. A., Hartmann, L., et al. 2013,ApJ,765, 18
Tobin, J. J., Dunham, M. M., Looney, L. W., et al. 2015,ApJ,798, 61
Tobin, J. J., Hartmann, L., Bergin, E., et al. 2012a,ApJ,748, 16
Tobin, J. J., Hartmann, L., Calvet, N., & D’Alessio, P. 2008,ApJ,679, 1364
Tobin, J. J., Hartmann, L., Chiang, H.-F., et al. 2011,ApJ,740, 45
Tobin, J. J., Hartmann, L., Chiang, H.-F., et al. 2012b,Natur,492, 83
Tobin, J. J., Hartmann, L., Looney, L. W., & Chiang, H.-F. 2010b, ApJ,
712, 1010
Tobin, J. J., Kratter, K. M., Persson, M. V., et al. 2016,Natur,538, 483
Ulrich, R. K. 1976,ApJ,210, 377
van der Bliek, N. S., Norman, D., Blum, R. D., et al. 2004, Proc. SPIE,
5492, 1582
Vorobyov, E. I., & Basu, S. 2006,ApJ,650, 956
Whitney, B. A., Wood, K., Bjorkman, J. E., & Cohen, M. 2003a,ApJ,598, 1079
Whitney, B. A., Wood, K., Bjorkman, J. E., & Wolff, M. J. 2003b,ApJ,
591, 1049
Woermann, B., Gaylard, M. J., & Otrupcek, R. 2001,MNRAS,325, 1213
Yen, H.-W., Koch, P. M., Takakuwa, S., et al. 2015,ApJ,799, 193
Yen, H.-W., Koch, P. M., Takakuwa, S., et al. 2017,ApJ,834, 178
Yen, H.-W., Takakuwa, S., Ohashi, N., & Ho, P. T. P. 2013,ApJ,772, 22
Zhao, B., Caselli, P., Li, Z.-Y., & Krasnopolsky, R. 2018,MNRAS,473, 4868