HAL Id: hal-03039936
https://hal.univ-lorraine.fr/hal-03039936
Submitted on 4 Dec 2020
HAL is a multi-disciplinary open access
archive for the deposit and dissemination of
sci-entific research documents, whether they are
pub-lished or not. The documents may come from
teaching and research institutions in France or
abroad, or from public or private research centers.
L’archive ouverte pluridisciplinaire HAL, est
destinée au dépôt et à la diffusion de documents
scientifiques de niveau recherche, publiés ou non,
émanant des établissements d’enseignement et de
recherche français ou étrangers, des laboratoires
publics ou privés.
Electron channelling contrast imaging: influence of
diffraction conditions on the dislocation contrast
Hana Kriaa, Antoine Guitton, Nabila Maloufi
To cite this version:
Hana Kriaa, Antoine Guitton, Nabila Maloufi. Electron channelling contrast imaging: influence of
diffraction conditions on the dislocation contrast. SF2M, 2017, Lyon, France. �hal-03039936�
Electron channelling contrast imaging: influence of diffraction conditions on the
dislocation contrast
Hana KRIAA, Antoine GUITTON, Nabila MALOUFI
Laboratoire d’Étude des Microstructures et de Mécanique des Matériaux (LEM3) – UMR CNRS 7239,
Laboratory of Excellence on Design of Alloy Metals for low-mAss Structures (DAMAS), University of
Lorraine, Metz, France.
E-mail:
[email protected]
Abstract
Electron Channeling Contrast Imaging (ECCI) is a non-destructive diffraction-based SEM technique that allows direct observations and comprehensive characterization of crystalline defects in the near-surface region (≈ 150 nm) of bulk materials. This technique takes advantage from the strong dependence between the backscattered electrons yield and the crystal orientation relative to the incident electron beam.
Dislocations for example can be characterized by ECCI using the well-known transmission electron microscopy g·b=0 and g·b×u=0 extinction criteria where g is the diffraction vector and b the Burgers vector. In this study, fundamental and experimental aspects of electron diffraction for characterizing dislocation by ECCI in SEM are reported. The �+g,-g� method is explored on several dislocation configurations in an Interstitial-Free steel sample. Moreover, a detailed characterization of a dislocation dipole by ECCI is presented.
Introduction
The electron-channelling phenomenon was discovered by Coates in 1967 [1], where the term “channelling” describes the electron propagation trough the crystal to a higher depth before scattering. Because this phenomenon is highly sensitive to the orientation of the crystal to the incident electron beam, Booker et al. suggested to use it for imaging subsurface defects such as dislocations and stacking faults…on bulk sample [2]. Therefore, an attractive technique called Electron Channelling Contrast Imaging (ECCI) was developed [3,4]. Moreover, the well know transmission electron microscopy extinction criteria – g·b=0 and g·b×u=0 where g is the diffraction vector, and u is the dislocation line direction – are still applicable [5,6].
Generally, to obtain nice ECC images of defects, the channeling conditions for a given family of planes have to be strictly satisfied, which corresponds to the incident beam oriented near a Kikuchi band edge where the BackScattered Electron (BSE) intensity is minimal. Moreover, it is reported that the thinnest dislocation appearance is obtained when the deviation parameter s of the primary electron beam from the exact Bragg’s position is slightly positive [7-9].
In this work, experimental aspects of electron diffraction for characterizing dislocations by ECCI in SEM are reported. Interstitial-Free steel (Fe − 1 % Si) is used as a model material for this study. Few articles [4,7,9] report the influence of the inversion of the diffraction vector g sign on the dislocation contrast. So, the potential of the ±g
diffraction is explored to observe and fully characterize a dislocation dipole.
Experimental observations and
characterization of individual
dislocation
Single dislocations
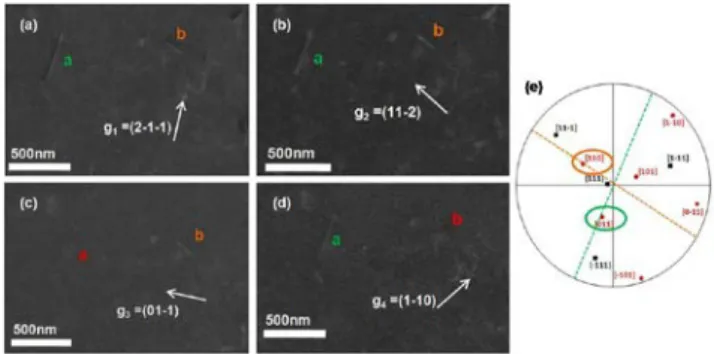
Fig.1 (a-d) shows ECC micrographs of two single dislocations labeled ’a’ and ‘b’. Both dislocations are observed with the same diffracting vector g1=�𝟐-1-1�, g2=�11-2�, g3=�01-1�, g4=�1-10�. The dislocation ’a’ and ‘b’ are out of contrast for g3 and g4 respectively. These extinction conditions are used to determine the Burgers vector, here ba=±
1
2�-111� and bb=± 1
2�11-1�. The
crystallographic orientations of both dislocations are estimated from the trace lines drawn as dashed lines on the stereographic projection of the {111} and {110} poles (Fig.1.e). Therefore, ‘a’ and ‘b’ are mixed dislocations with [011] and [110] trace direction respectively.
Dislocations dipole
To get the thinnest dislocation appearance, ECC observations are carried out with s slightly positive (s>0). The region of interest is observed with different diffraction conditions g: g1=(11�0), g2=(011�), g3=(21�1�), g4=(121�), g5=(101�) (Table1). Fig.2. presents a dislocation configuration observed with ±g1and ±g3. The comparison of these images shows that two separated dislocations are clearly identified and they are labeled 1 and 2. Both dislocations are out of contrast with the same diffraction vectors g2=(011�) and g4=(121�) (not shown here). Therefore, extinction conditions g∙b=0 (Table 1) lead to Burgers vectors equal to b=±1
2�-111�. Moreover, from
ECC images obtained with ±g1 and ±g3, one can see that the apparent intersection between the both dislocations is shifted (red dots are positioned on schemes of Fig.2.a-d) leading to a substantial change of the distance between these two dislocations images similarly to TEM observations concerning a dipole [10-11].Combining all these observations leads to the conclusion that dislocations 1 and 2 have Burgers vector b1=±
1
2�-111� and -b1
respectively consistent with a dislocation dipole (already observed by TEM in IF-steel). The crystallographic orientation of this dipole was also estimated from the trace line drawn on the stereographic projection (Fig.2.e). The
obtained dipole is then an edge dislocation dipole in the �10-1� plane with [101] direction line.
Figures and tables
Figure1.(a-d) ECC images of singles dislocations labelled ‘a’ and ‘b’ obtained with different diffractions condition g1=(2-1-1), g2=(11-2), g3=(01-1) and g4=(1-10). (e)
Stereographic projection showing the {111} and {110}-poles, the green and orange dashed lines correspond to the projection of the dislocation ‘a’ and ‘b’ direction line respectively.
Figure 2. Micrographs of dislocations 1 and 2 observed with (a) g1= (1-10), (b) -g1= (-110), (c) g3= (2-1-1) and (d)
-g3=(-211). (e) Stereographic projection showing the
{111} and {110}-poles, the dashed line corresponds to the projection of the dipole direction line.
Table1: Contrast of dislocation dipole under different diffraction conditions g1 (11�0) g2 (011�) g3 (21�1�) g4 (121�) g5 (101�) b u α (°) 1 ✓ ✗ ✓ ✗ ✓ [1�11] [101] 90 2 ✓ ✗ ✓ ✗ ✓ [111�] [101] 90
Note: 1 and 2: dislocations 1 and 2; ✓: visibility; ✗: invisibility; b: Burgers vector, u: dislocation line direction; α: angle between b and u.
Conclusion
To conclude, unlike TEM, ECCI is a nondestructive technique of SEM that allows comprehensive studies of dislocations on bulk samples. Moreover, the potential of ±g diffraction leads to a detailed analysis of dislocation configuration such as dislocation dipole.
Références
[1] Coates, D.G. Philos. Mag.16 (1967) 1179–1184. [2] Booker, G.R., Shaw, A.M.B., Whelan, M.J., Hirsch, P.B. Philos. Mag.16 (1967) 1185–1191.
[3] Morin. P., Pitaval. M., Vucario. E. and Fontaine. G. 2 (1979) 217-224.
[4] Morin. P., Pitaval. M., Besnard. D. and Fontaine. G. Philos. Mag. 40:4(1979) 511-524.
[5] Wilkinson, A., Anstis, G.R., Czernuszka, J.T., Long, N.J.,Hirsch, P.B. Philos. Mag.68 (1993) 59–80.
[6] Crimp, M. A., Simkin, B. A., Ng, B. C. Philos. Mag. 81 (2001) 833-837.
[7] Simkin, B.A., Crimp, M.A. Ultramicroscopy.77 (1999) 65-75.
[8] Mansour, H., Guyon, J., Crimp, M.A., Gey, N., Beausir, B., Maloufi, N. Scripta. Mater. 84–85 (2014) 11– 14.
[9] Kriaa, H., Guitton, A., Maloufi, N. Submission in progress
.
[10] Guitton, A., Joulain, A., Thilly, L., Tromas, C. Philos. Mag. (2012) 1-11.