HAL Id: hal-00301084
https://hal.archives-ouvertes.fr/hal-00301084
Submitted on 23 May 2003HAL is a multi-disciplinary open access
archive for the deposit and dissemination of sci-entific research documents, whether they are pub-lished or not. The documents may come from teaching and research institutions in France or abroad, or from public or private research centers.
L’archive ouverte pluridisciplinaire HAL, est destinée au dépôt et à la diffusion de documents scientifiques de niveau recherche, publiés ou non, émanant des établissements d’enseignement et de recherche français ou étrangers, des laboratoires publics ou privés.
Fine and ultrafine particles in the Zürich (Switzerland)
area measured with a mobile laboratory. An assessment
of the seasonal and regional variation throughout a year
N. Bukowiecki, J. Dommen, André Prévôt, E. Weingartner, Urs Baltensperger
To cite this version:
N. Bukowiecki, J. Dommen, André Prévôt, E. Weingartner, Urs Baltensperger. Fine and ultrafine particles in the Zürich (Switzerland) area measured with a mobile laboratory. An assessment of the seasonal and regional variation throughout a year. Atmospheric Chemistry and Physics Discussions, European Geosciences Union, 2003, 3 (3), pp.2739-2782. �hal-00301084�
ACPD
3, 2739–2782, 2003Fine and ultrafine particles in the Z ¨urich
(Switzerland) area N. Bukowiecki, et al. Title Page Abstract Introduction Conclusions References Tables Figures J I J I Back Close
Full Screen / Esc
Print Version
Interactive Discussion
c
EGU 2003
Atmos. Chem. Phys. Discuss., 3, 2739–2782, 2003 www.atmos-chem-phys.org/acpd/3/2739/
c
European Geosciences Union 2003
Atmospheric Chemistry and Physics Discussions
Fine and ultrafine particles in the Z ¨
urich
(Switzerland) area measured with a
mobile laboratory. An assessment of the
seasonal and regional variation
throughout a year
N. Bukowiecki, J. Dommen, A. S. H. Pr ´ev ˆot, E. Weingartner, and U. Baltensperger
Laboratory of Atmospheric Chemistry, Paul Scherrer Institut, CH-5232 Villigen PSI, Switzerland
Received: 24 March 2003 – Accepted: 1 May 2003 – Published: 23 May 2003 Correspondence to: A. S. H. Pr ´ev ˆot ([email protected])
ACPD
3, 2739–2782, 2003Fine and ultrafine particles in the Z ¨urich
(Switzerland) area N. Bukowiecki, et al. Title Page Abstract Introduction Conclusions References Tables Figures J I J I Back Close
Full Screen / Esc
Print Version
Interactive Discussion
c
EGU 2003 Abstract
On occasion of the project YOGAM (year of gas phase and aerosol measurements), the spatial and temporal variation of selected aerosol and gas phase parameters was assessed for the Z ¨urich (Switzerland) area with a new mobile pollutant measurement laboratory. This assessment based on on-road measurements along a specified route
5
on selected days during different seasons in 2001/2002, covering urban, suburban and rural regions. Special focus was put on the investigation and characterization of parti-cles in the fine (< 2.5 µm) and ultrafine (< 100 nm) size ranges. Analysis of Variance (ANOVA) showed that the variance of all considered fine and ultrafine aerosol param-eters (i.e. particle background and total number concentration for particles larger than
10
3 nm, number concentrations in the size ranges 7–30 nm and 80–140 nm, as well as the active surface area concentration) was considerably larger for day-to-day than for spa-tial variation. However, Principal Component Analysis (PCA) found a similar regional pollution pattern within every single measuring day. Lowest particle background levels were found in rural areas at higher elevation (15 000 cm−3), while corresponding mean
15
background values for urban and freeway-influenced areas were typically 35 000 cm−3 and > 80 000 cm−3, respectively. Meteorology, i.e. prevailing weather conditions not only governed the day-to-day concentration variations in the selected area, but also in-fluenced the formation of both primary (directly traffic-related) and secondary (biogenic or indirectly traffic-related) ultrafine particles. Overall, low temperatures regularly
en-20
hanced primary ultrafine particle formation in urban areas. There was however indica-tion for relatively low number concentraindica-tions of secondary ultrafine particles during only a few warm and sunny spring days. Mobile measurements as described in this study have been shown to be suitable for long-term pollutant assessments, to obtain good information on spatial variability and reasonable information on the temporal
variabil-25
ity. For aspects concerning spatial resolution, an experimental design using a mobile measurement may even be more appropriate than a network of stationary measuring sites.
ACPD
3, 2739–2782, 2003Fine and ultrafine particles in the Z ¨urich
(Switzerland) area N. Bukowiecki, et al. Title Page Abstract Introduction Conclusions References Tables Figures J I J I Back Close
Full Screen / Esc
Print Version
Interactive Discussion
c
EGU 2003 1. Introduction
In recent years the potential of particulate matter to cause adverse health effects has been investigated in numerous epidemiological and laboratory studies. For PM10 (mass concentration of particles with an aerodynamic diameter d < 10 µm) and PM2.5 (fine particles, d < 2.5 µm), a significant correlation with adverse health effects could
5
be shown (Dockery et al., 1993; Katsouyanni et al., 1997; Laden et al., 2001; Pope et al., 1995; Schindler et al., 2001). For ultrafine particles (Particle diameter d < 100 nm) extensive epidemiological studies have not been performed yet, but the few available investigations point to an increased health effect potential of particles in this size range due to their special interaction pattern in the human airways (Donaldson et al., 1998;
10
Oberd ¨orster and Utell, 2002; U.S. Health Effects Institute, 2002; Wichmann and Peters, 2000). In ambient aerosol research, strong efforts have been made in the last years to obtain a clearer picture not only on the spatial and temporal distribution of PM10 and PM2.5, but also on other aerosol parameters like particle number size distribu-tions, surface or volume. Ambient ultrafine particles have gained special attention in
15
the last years and typically show complex formation and occurrence patterns. So far, it has been recognized that ambient ultrafines can be split into primary and secondary ultrafine particles (Baltensperger et al., 2002). Primary ultrafines and nanoparticles (< 50 nm) are traffic-related and are rapidly formed by nucleation during the dilution and cooling of freshly emitted gaseous combustion exhaust in the atmosphere, depending
20
on the meteorological conditions. It has been shown that their formation is favored at low ambient temperatures and is lower for low-sulfur fuel vehicles (Abdul-Khalek et al., 1999, 2000; Kittelson et al., 2002). When formed, they show large number concen-trations in the area of emission, but have a limited lifetime (< 10 min in urban areas) and therefore a typical area of influence of 100 m–1 km (Capaldo and Pandis, 2001).
25
They are composed of hydrocarbons and a minor fraction of sulphuric acid and water, and are believed to partially originate from lube oil substances in vehicle engines (To-bias et al., 2001). On the other hand, secondary ultrafines describe ambient ultrafine
ACPD
3, 2739–2782, 2003Fine and ultrafine particles in the Z ¨urich
(Switzerland) area N. Bukowiecki, et al. Title Page Abstract Introduction Conclusions References Tables Figures J I J I Back Close
Full Screen / Esc
Print Version
Interactive Discussion
c
EGU 2003
particles that are not directly emitted, but are rather formed from gaseous precursors, i.e. by condensation of products from atmospheric reactions (M ¨akel ¨a et al., 2000). Nucleation bursts of secondary ultrafines have been reported to occur worldwide in remote rural and even urban areas and are strongly influenced by meteorological pa-rameters like solar radiation or temperature, but also by background concentrations
5
of other pollutants, i.e. the local particle background concentration (Baltensperger et al., 2002; Birmili and Wiedensohler, 2000; Boy and Kulmala, 2002a, b; McMurry and Woo, 2002). Their lifetime and composition is so far less elucidated, though there is evidence that they consist of mainly organics and that they persist longer (in the range of hours) in the atmosphere than primary ultrafines, mainly due to slower coagulation
10
with typically lower concentration levels of background aerosol (O’Dowd et al., 2002). However, for numerous regions no area-covering inventory of combined aerosol and other parameters exists for a longer period of time. Such monitoring is often restricted to PM10 or PM2.5 due to national regulation standards.
In an earlier publication (Bukowiecki et al., 2002) we showed a case study involving
15
mobile pollutant measurements in the Z ¨urich (Switzerland) area, in which we investi-gated spatial and temporal differences in pollutant levels for an autumn two-day period. While we focused on short-time signal variations and day/night differences in that case study, this paper will present an analysis of particulate pollution variation on a larger time scale. It is the goal of this study to obtain statistical information on both spatial
20
dependence and seasonality of particulate air pollution in the Z ¨urich area with help of mobile pollutant measurements, and also to have a closer look at the processes lead-ing to the formation of fine and ultrafine particles. A focus will be put on particle number size distributions, total particle number concentration, active surface area and carbon monoxide measurements. We evaluated whether the use of a mobile laboratory is a
25
promising approach to measure and study processes that normally are monitored by a network of stationary monitoring sites.
ACPD
3, 2739–2782, 2003Fine and ultrafine particles in the Z ¨urich
(Switzerland) area N. Bukowiecki, et al. Title Page Abstract Introduction Conclusions References Tables Figures J I J I Back Close
Full Screen / Esc
Print Version Interactive Discussion c EGU 2003 2. Methods 2.1. Experimental
On occasion of the research project YOGAM (Year of Gas Phase and Aerosol Mea-surements, 2001/2002), a mobile laboratory was constructed at the Paul Scherrer Insti-tute (Villigen, Switzerland), allowing for on-road measurements of a variety of aerosol
5
parameters and gas phase parameters, along with geographical information (GPS, Garmin IIplus) and meteorological data (temperature, pressure, humidity, global radi-ation and relative wind direction). The setup of the mobile laboratory is discussed in detail in Bukowiecki et al. (2002). Data included in this paper were measured by a scanning mobility particle sizer (SMPS, DMA TSI 3071 and CPC TSI 3010), a
con-10
densation particle counter (CPC, TSI UCPC 3025), an optical particle counter (OPC, Grimm 1.108), a diffusion charging sensor (DC, Matter Engineering LQ1-DC) and a carbon monoxide (CO) monitor (Aerolaser AL-5002). Since measurements could be performed while driving, highly time-resolved (1 s–3 min time resolution for most param-eters) and spatially resolved information (continuously) on the ground pollutant level in
15
the testing area was obtained. During YOGAM, a selected route in the Z ¨urich area (Fig. 1) was driven on a regular base throughout the course of a year, including down-town Z ¨urich (400 m a.s.l.), suburban areas (400–500 m a.s.l.) as well as rural sites (500–900 m a.s.l.). For the time frame chosen, additional data from official monitoring stations were available for comparison.
20
2.2. Data analysis strategy
The large number of parameters measured during YOGAM required a careful devel-opment of a suitable data analysis strategy. In contrast to stationary measurements, mobile measurements have a simultaneous signal variation in time and space. To find a way to categorize such data it is necessary to know the signal dynamics along both
25
ACPD
3, 2739–2782, 2003Fine and ultrafine particles in the Z ¨urich
(Switzerland) area N. Bukowiecki, et al. Title Page Abstract Introduction Conclusions References Tables Figures J I J I Back Close
Full Screen / Esc
Print Version
Interactive Discussion
c
EGU 2003
variations (< 5 min) of the measured parameters occurred more rapidly than temporal variation (< 4 h). Thus, a temporal classification of the data in morning and afternoon loops on the YOGAM route was appropriate. As shown in the next section, spatial classification of the data was achieved by binning the raw data into different location bins along our measuring route. This binning per location and measuring day allowed
5
for analysis of variance (ANOVA), which turned out to be especially suitable for looking at the whole-year data set with respect to signal variations at different locations and different days. However, this 3-dimensional measuring approach (signal vs. time and two-dimensional space) and the large number of parameters measured push the use of low-dimensional statistics to a limit. Hidden connections can essentially influence
10
and jeopardize the pure investigation of single dependencies. Multivariate statistical tools are often used in ambient aerosol research. Principal Component Analysis (PCA) and Factor Analysis (FA) are useful statistical methods to explore and explain relevant variations in large data sets. In source apportionment studies these techniques are often used for quantitative analysis and underlie a large number of critical boundary
15
conditions. For the YOGAM data set, a PCA was selected as an adequately simple multivariate tool to find unobvious patterns in the data and reveal hidden correlations between different parameters. The qualitative findings of PCA were then used as input for further process studies.
2.3. Data preparation
20
This section describes how raw data collected during YOGAM were processed to finally get appropriate input data for ANOVA and PCA. With help of GPS, every raw data point (1 s intervals) of the total aerosol number and surface area concentration as well as of the CO concentration measurements was assigned to a geographical position. In a first step, we defined a set of location bins along the YOGAM route, based on geography
25
and population density considerations. Thus, all raw data points were attributed to cor-responding location bins. In this way, 75 location bins were obtained (see Table 1 and Fig. 1), each containing approximately 180–360 raw data points, which corresponded
ACPD
3, 2739–2782, 2003Fine and ultrafine particles in the Z ¨urich
(Switzerland) area N. Bukowiecki, et al. Title Page Abstract Introduction Conclusions References Tables Figures J I J I Back Close
Full Screen / Esc
Print Version
Interactive Discussion
c
EGU 2003
to 3–6 min driving along the route with the mobile laboratory (except the Z ¨urich city bins, which also included mid-day stationary measurements during 30–60 min). Since local changes in location type occurred very quickly while driving along the YOGAM route (often within a few minutes, which is faster than the average day-to-day deviation from the route schedule (±1.5 h)), the concept of forming location bins was found to
5
be more reliable than a time-averaging approach. All parameters were corrected for instrument and sampling time delays (see Bukowiecki et al., 2002), and all data were checked for plausibility and validity. Next, the data in each location bin were statisti-cally treated according to Table 2. For the CPC, both average concentrations and 5% percentile values were formed. The latter statistical parameter has been shown to be
10
suitable to eliminate plumes originating from single vehicles and thus to estimate the local particle background (see Bukowiecki et al., 2002). For all meteorological parame-ters and carbon monoxide, average values per location bin were calculated, except for the global radiation. Since numerous low values resulting from bridges, buildings, trees or tunnels biased the measured global radiation throughout a measuring day, the use of
15
95% percentiles was shown to be appropriate to get the regional daily variation of this parameter. Average values were also calculated for the active surface area, since the measured DC signal included too much noise for reasonable percentile calculations. For all parameters, standard deviations were calculated for every location bin. Further-more, SMPS and OPC particle size distributions were linked, to obtain an average size
20
distribution from 7 nm to 10 micrometer for every location bin. Based on the focus of interest of this study, we calculated several comprehensive integrated sum parameters for different size ranges from the size distribution data (see Table 2). The result of the above procedure is a data set consisting of a [parameter x location bin] matrix for every measuring day. A summary of measuring days selected for YOGAM, including
meteo-25
rological conditions, is given in Table 3. Although the YOGAM campaigns also included measurements made during spring and summer 2001, they were not used for ANOVA and PCA due to problems with SMPS and DC measurements (high signal scattering due to sampling problems and calibration problems, respectively). Summer data for
ACPD
3, 2739–2782, 2003Fine and ultrafine particles in the Z ¨urich
(Switzerland) area N. Bukowiecki, et al. Title Page Abstract Introduction Conclusions References Tables Figures J I J I Back Close
Full Screen / Esc
Print Version
Interactive Discussion
c
EGU 2003
the rest of the measured parameters (Ntot, Nbkg, CO) are however considered on other occasions in this paper and mentioned in the specific context.
3. ANOVA tests – does variation in season exceed spatial variation?
In our previous case study (Bukowiecki et al., 2002) we showed that on a specific mea-suring day the background particle number concentration in our testing area differed
5
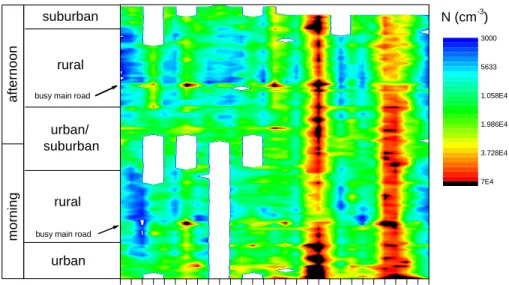
by up to more than one order of magnitude between urban and rural areas. Taking all the data from the whole year into account, the question arises how this urban/rural variation is quantitatively related to the day-to-day variation due to different meteoro-logical conditions in the Z ¨urich area. Figure 2 shows a date vs. location contour plot for the 5% percentile (background) values of the total particle number concentration.
10
It is clearly seen that rural and urban regions, but also locations influenced by heavy traffic, show different levels throughout the year (horizontal stripes). However, there are days/periods in which the overall particle background concentration is much higher than during other days or periods, exceeding the regional variation. To quantify these variations in time and location, the statistical model of choice was analysis of
vari-15
ance (ANOVA) based on a two-way layout (Chambers and Hastie, 1992; Voss, 2000) with replicates: Every particle background value (and also all other parameters) in our database described in Sect. 2 is uniquely characterized by a specific date (date vari-able= factor A), a specific location bin (location variable = factor B) and one morning and one afternoon measurement per date (giving 2 repeated measurements per day,
20
i.e. two replicates). The elements of such A vs. B matrices are termed levels. The use of a layout with replicates also takes into account the variability of morning and afternoon values per day. Equation (1) gives an analytical expression for the model used:
yi j = µ + αAi + αjB+ αi jAB+ εi j, (1)
ACPD
3, 2739–2782, 2003Fine and ultrafine particles in the Z ¨urich
(Switzerland) area N. Bukowiecki, et al. Title Page Abstract Introduction Conclusions References Tables Figures J I J I Back Close
Full Screen / Esc
Print Version
Interactive Discussion
c
EGU 2003
where yi j is the overall model response (in our case the measured parameter), µ the overall mean, αiAthe effect of the i-th level of factor A (location bin i per date, i = 1..I, I = number of location bins), αjB the effect of the j-th level of factor B (date j of a specific location bin, j = 1...J, J = number of days), αi jAB an interaction term between A and B (see below) and εi j a residual error term. Since ANOVA assumes normal
5
distributions of the considered parameters, the variables were transformed to be nor-mally distributed according to Table 2. In the following the performance of the selected statistical model is illustrated with the particle background number concentration. Fig-ure 3 shows values of the sample means and medians for each level of each factor (location and date). The horizontal lines indicate the sample means and medians of
10
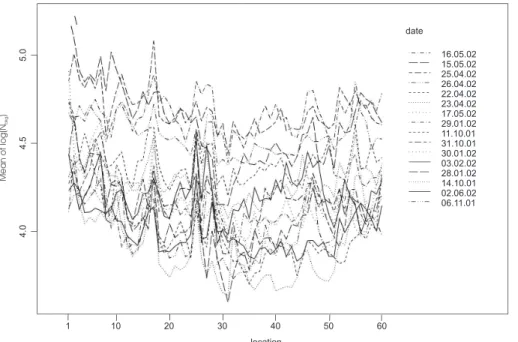
all data. There is no striking difference between the mean and the median plot, so it is assumed that outliers will not significantly bias the subsequent calculations. To use the above model it has to be checked whether there possibly is an interaction between the two factors. Figure 4 clearly shows that this is the case, since the levels (individual dates) of the date factor track in approximately parallel ways. Therefore, the interaction
15
term in Eq. (1) is not negligible. With these preconditions, ANOVA was carried out for the above model using the SPLUS 6.0 software (Insightful Inc., Seattle, Washington). The formalism of ANOVA includes a square sum decomposition algorithm and yields a variance v 1 for the signal variation between the levels of one factor (e.g. between different days) and a variance v2 for the signal variation within the individual factor
lev-20
els (i.e. within every measuring day). Using F-test statistics, an F-value (F=v1/v2) is then calculated for every factor to test the null hypothesis. For a true null hypothesis, F-values are close to 1 and indicate that the variance between different groups of levels is approximately equal to the variance within the individual levels, resulting in an equal variance for all levels and the entire sample population. F 1 thus indicates that the
25
variance (i.e. the effect on the signal) between the level groups is significantly larger than the variance within the groups. The probability for a true null hypothesis, p(F), is in this case close to zero. Table 4 shows ANOVA results for the normally transformed data for particle background number concentration (Nbkg), Ntot, N(<30), N(80–140), CO and
ACPD
3, 2739–2782, 2003Fine and ultrafine particles in the Z ¨urich
(Switzerland) area N. Bukowiecki, et al. Title Page Abstract Introduction Conclusions References Tables Figures J I J I Back Close
Full Screen / Esc
Print Version
Interactive Discussion
c
EGU 2003
the active surface area.
It is seen from Table 4 that for basically every parameter the null hypothesis both for date and location has to be rejected. Among all F-values, the one for the location variance of the particle background concentration (Nbkg) sticks out to be the only value below 10 and thus is not too far away from significance. For this parameter, the low
5
F-value of 4.21 assigned to location and the high F-value of 73.5 assigned to the date indicate that compared to the day-to-day variation, a change in spatial position had only a minor influence on the measured signal (Ratio of F-values= 17.5). Thus, the ANOVA model also quantitatively confirms the qualitative finding drawn from Fig. 2. Figure 5 shows additional ANOVA quality assurance plots for the particle background number
10
concentration results. The residual histogram is normally distributed and the plot of the residuals vs. quantiles of standard normal shows only a slight deviation from a linear relationship, indicating that the used model was appropriate. Figure 6 finally shows the deviation of the particle background number concentration from the annual average in the YOGAM area (as it is already shown in a more abstract way in Fig. 3). On average,
15
a clear differentiation for urban, rural and heavy- trafficked areas is recognized on a per-route base, and the standard error of mean is higher for stronger polluted areas. Beside Nbkg, also Ntot, N(80–140) and the active surface area have high F-value ratios (≥6), indicating the same strong influence of daily meteorological conditions on the concentration and atmospheric accumulation of particles in the considered size range.
20
In contrast, the temporal (day-to day) variation of N(<30) is not exceeding the spatial variation to the same extent (F-value ratio= 2.1). It is suspected that this is due to the regularly observed formation of relatively short-lived primary ultrafine particles (see Introduction) in heavy-trafficked areas, which will also be further discussed in Sects. 4 and 5. CO does not show a clear trend. The null hypothesis has to be rejected both for
25
date and location, but the similar F-values indicate that both factors have a similar effect on the measured signals, giving a more uniform distribution in the area throughout the year.
ACPD
3, 2739–2782, 2003Fine and ultrafine particles in the Z ¨urich
(Switzerland) area N. Bukowiecki, et al. Title Page Abstract Introduction Conclusions References Tables Figures J I J I Back Close
Full Screen / Esc
Print Version
Interactive Discussion
c
EGU 2003
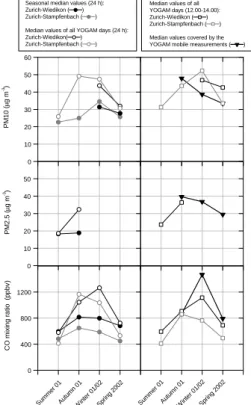
whether the measuring days selected during YOGAM could be considered to be rep-resentative for the corresponding seasons, since the meteorology of the selected days possibly differed from the seasonal average and rainy days were entirely excluded from the YOGAM measurements. In Fig. 7, PM10, PM2.5 and CO mean and median val-ues (weighted by day) estimated from mobile laboratory measurements in downtown
5
Z ¨urich (typically 15 min in the morning and one hour at noon on every measuring day, plus one 24-h period in every season) are compared to the corresponding parameters measured by the Z ¨urich city authorities at one/two downtown stationary measuring sites for CO and PM, respectively. For YOGAM data, PM10 and PM2.5 were estimated from V10 and V2.5, respectively, assuming a particle density of 1.7 g cm−3. This is
10
only a rough approximation, since bulk material density, particle shape and ambient humidity have a large influence on the exact value (Hand and Kreidenweis, 2002). For PM10, the curves showing the stationary measurement 24-h medians (left column in Fig. 7) suggest that the selection of measuring days was reasonably representing seasonality in summer and spring, while the selection of campaign days strongly
over-15
estimated the seasonal medians for autumn (and to a minor extent for winter). The YOGAM median data for PM10 (right column in Fig. 7), mainly influenced by mid-day measurements, agree rather well with the medians measured by the official monitoring site at noon on the selected days, except for winter. For PM2.5 only autumn data exist for comparison, showing similar values for the YOGAM data and mid-day data from
20
the monitoring stations. CO values were again reasonably well represented by the se-lection of measuring days in summer and spring, and similarly to PM the winter and autumn campaigns overestimated the seasonal medians. Again, YOGAM winter data did not match the midday median values of the official monitoring sites. Overall, the selected YOGAM measuring days underestimated seasonal medians during 2001 and
25
2002. However, the YOGAM mobile laboratory measurements matched the mid-day stationary measurements at the official monitoring sites reasonably well, despite a few counterexamples (mainly winter cases).
ACPD
3, 2739–2782, 2003Fine and ultrafine particles in the Z ¨urich
(Switzerland) area N. Bukowiecki, et al. Title Page Abstract Introduction Conclusions References Tables Figures J I J I Back Close
Full Screen / Esc
Print Version
Interactive Discussion
c
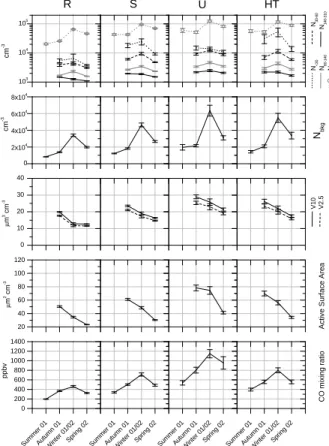
EGU 2003
N(30–80) and N(140–310)), resolved by location category (rural, suburban, urban and heavy-traffic areas) as defined in Table 1. Roughly, CO and most number based aerosol parameters (N) on the one hand and V10, V2.5 and the active surface area on the other hand show similar seasonal trends. According to the estimation of sea-sonal representation described in the previous paragraph, winter data are too high for
5
the first group (CO, N), while the second group (V10, V2.5, active surface area) pri-marily overestimates the autumn data. On average, rural (R) and suburban (S) areas showed lower concentration levels than urban (U) and heavy-traffic (HT) regions for all considered parameters except N(<30). Overall, higher levels were found during au-tumn and winter for the size range <310 nm, for V10, 2.5 and for the active surface
10
area. In contrast, winter and spring dominated the seasonal variation of Ntot, Nbkg and CO.
4. PCA – exploratory data analysis
Principal component analysis is first of all a data reduction technique (see e.g. text-books by Jolliffe (1986) or Mardia et al. (1979)). Figuratively, it extracts the directions
15
in which a cloud of data points is maximally stretched, i.e. has a maximal variance. The most relevant information of the data set (J variables with K observations) is con-tained in these directions (i.e. principal components, in the following termed PCs). The PCs represent orthogonal and therefore independent linear combinations PCi of the J original variables v (Eq. 2):
20 PC(i ) = J−1 X j=1 bi j· vj, (2)
where bi j are the component loadings and indicate how strongly a specific original variable vj contributes to PCi and vj is the original variable. PCs are found by calcu-lating the eigenvectors and corresponding eigenvalues of the correlation matrix formed
ACPD
3, 2739–2782, 2003Fine and ultrafine particles in the Z ¨urich
(Switzerland) area N. Bukowiecki, et al. Title Page Abstract Introduction Conclusions References Tables Figures J I J I Back Close
Full Screen / Esc
Print Version
Interactive Discussion
c
EGU 2003
by the input data. The projection of the original data on the eigenvectors defines the PCs, and the eigenvalue of every eigenvector indicates the contribution of the specific PC to the total data set variance. By definition, there are J − 1 principal components, with the first ones containing the most relevant information. Taking only these PCs, the original data set can be stored and compressed with a lower amount of variables, and
5
the original data can be restored with only a minor loss of information.
For the YOGAM data, PCA was individually performed for the [location bin × mea-sured parameter] matrix of every measuring day showing no data gaps, using the SPLUS 6.0 software. This strategy of analyzing single days individually was selected because an annual analysis of all the data is already covered by the previous
sec-10
tion and would therefore possibly yield redundant information. The goal was rather to obtain individual “footprints” for every day, telling more about the influence of e.g. meteorological conditions on the spatial and daily variation of the pollutants. From the input matrix, the correlation matrix was calculated. Both original data and data trans-formed to normality (see Table 2) were tested as input for PCA. No significant changes
15
in the loading pattern were observed, so we decided to use the original data to avoid interpretation artifacts due to distortion of the original data. The signal-to-noise ratio was larger than 3 for all variables, so no down-weighing of noisy variables had to be taken into account (Paatero and Hopke, 2003). A further issue regarding our input data is the fact that although several parameters in our input matrices are not in linear
20
relationship, they are in a square relationship to each other (especially the N, S and V variables). Testing the influence of the number of dependent parameters in the input matrix on the PCA results again showed that the PCs and their loading patterns did not relevantly change. A change occurred however in the relevance of the individual PCs, i.e. the eigenvalues of the components decreased with a decreasing number of
25
dependent parameters. With a minimal set of parameters, different criteria for evaluat-ing the relevance of PCs (see PCA textbooks) suggest that mainly the two first PCs are relevant. Overall, it was therefore decided to use the full set of variables for the further qualitative analysis of the first two principal components. With this analytical design,
ACPD
3, 2739–2782, 2003Fine and ultrafine particles in the Z ¨urich
(Switzerland) area N. Bukowiecki, et al. Title Page Abstract Introduction Conclusions References Tables Figures J I J I Back Close
Full Screen / Esc
Print Version
Interactive Discussion
c
EGU 2003
the first PC explained 60±5% of the total variance, whereas the second PC accounted for 15±5%. Respective values for the further PCs 3 and higher were lower than 10%.
Standardized component loadings ci j (Eq. 3) and the standardized values of PCs, xi j k, (Eq. 4) are the most useful parameters for a qualitative PCA analysis:
ci j = bi j
pEVi (3)
5
bi j: loading value of PCi for variable vj; E Vi: eigenvalue of PCi.
xi j k = J−1 X j=1 vj(k) − vj(k) s(vj) · ci j (4)
vj(k): k-th value of variable vj; s(vj): standard deviation of variable vj.
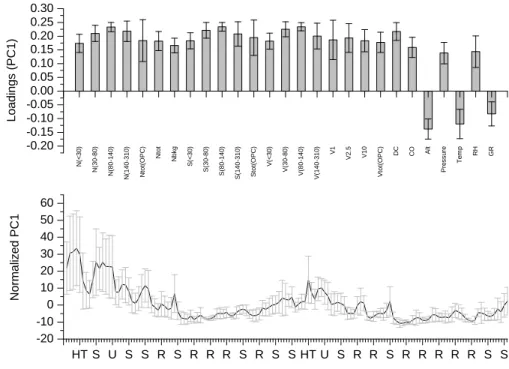
Figure 9 shows the annual average of the first principal component, along with its loading pattern. Obviously, the loading pattern for the first component shows relatively
10
little variation throughout the year (see standard deviation bars). All loadings except for global radiation, altitude and temperature have positive values. The parameters that are contributing most to the first PC are those in the middle of the considered size spectrum, i.e. N, S, V(80–140) or N, S, V(140–310), as well as CO and the active sur-face area. At the same time they showed a minimal contribution to PC2 (loading values
15
< 20% of the maximum PC2 values). This suggests that this component represents a general degree of pollution. The standardized PC1 (lower graph in Fig. 9) shows high values in urban regions and regions with heavy traffic and low values in rural areas far away from anthropogenic activity. This leads to the conclusion that the largest varia-tion in our daily data sets is caused by the degree of anthropogenic influence on the
20
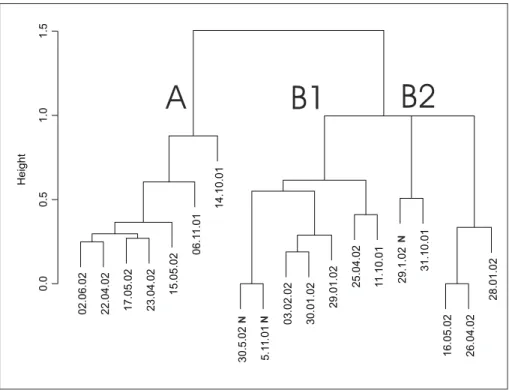
respective measuring locations. In contrast to PC1, PC2 showed no uniform loading pattern throughout the year. Since N, S, V(80–140) or N, S, V(140–310) hardly con-tribute to PC2 (see above), other factors than anthropogenic influence had to be found. To reveal similarities in the loading patterns of PC2, a cluster analysis was performed.
ACPD
3, 2739–2782, 2003Fine and ultrafine particles in the Z ¨urich
(Switzerland) area N. Bukowiecki, et al. Title Page Abstract Introduction Conclusions References Tables Figures J I J I Back Close
Full Screen / Esc
Print Version
Interactive Discussion
c
EGU 2003
Both for PC1 and PC2 the loading values of N, S and V differed by less than 10% within the particle size ranges 7–80 nm, 80–310 nm and 310 nm–10 µm. Therefore, average values AN, S, V7−80 , AN, S, V80−310 and AN, S, V310−10 000were used for cluster analysis of the PC2 load-ings. The input for the cluster analysis was a [parameter x date] matrix consisting of the PC2 loading patterns, with the 12 parameters CO, active surface area, Ntot, Nbkg,
5
AN, S, V7−80 , AN, S, V80−310 and AN, S, V310−10 000, altitude, pressure, temperature, relative humidity and
global radiation for the 19 YOGAM measuring days (matrix dimension 12 × 19). A hier-archical tree with euclidean distances (Fig. 10) was obtained using a divisive clustering algorithm (Kaufman and Rousseeuw, 1990). A clear split into two main branches (A and B) is seen, while branch B is divided in two major sub-branches (B1 and B2) on
10
the second highest hierarchical level. Within these three categories (A, B1 and B2) we searched for meteorological/geographical variables that were significantly different in the three individual cluster categories. Figure 11 shows that despite a few outlier days global radiation seems to be a main divider for category A and B, and that the wind speed at high altitudes is significantly split by all three categories. In contrast,
temper-15
ature is only insignificantly different. In categories B1 and B2 the main wind direction was SW (> 80%), while the prevailing wind direction for category A was NE and SW in an approximately 1:1 ratio. Concluding this section, the following statements and questions arise from the PCA and cluster analysis:
– Within one day, the distance to anthropogenic pollution sources caused the
20
largest variation (65%) in the measured pollutant parameters. This contribution to the total data variance was in all cases larger than influences from meteorology (on a one-day base). In the selected area, most of the locations that are least influenced by anthropogenic activity are located at higher altitudes.
– Beside anthropogenic activity, meteorological conditions are suspected to explain
25
further 15% of the total pollutant variation. Namely differences in global radiation and in the wind speed at high altitudes split the YOGAM days into different cate-gories, each possibly reflecting a particular meteorological situation. In this case
ACPD
3, 2739–2782, 2003Fine and ultrafine particles in the Z ¨urich
(Switzerland) area N. Bukowiecki, et al. Title Page Abstract Introduction Conclusions References Tables Figures J I J I Back Close
Full Screen / Esc
Print Version
Interactive Discussion
c
EGU 2003
it is expected that particle number size distributions will show differences for these individual categories.
5. Using PCA results as input for further data analysis
As stated in the previous section, anthropogenic air pollution can roughly be assigned to high levels of particles in an intermediate size range (80–310 nm) and high CO
lev-5
els. Indeed, it is already known from gas phase chemistry that CO is a good indicator for anthropogenic activity. Furthermore, we already showed in Bukowiecki et al. (2002) that the particle number concentration in the size range 80–140 nm is strongly con-nected to anthropogenic activity. PM10 or PM2.5 in areas surrounding an urban region are further parameters often discussed in this context (see Introduction). To carry on
10
the discussion of the previous section’s findings, the YOGAM database (see Sect. 2) was therefore used to classify data in the two following ways.
5.1. Location-dependent pollution
For all database entries (i.e. 1 morning and 1 afternoon value per date and location, except location bins 1–9) of N(80–140), V2.5 (representing PM2.5) and CO, the
per-15
centile within the individual parameter was calculated. Categorizing these percentiles by location and parameter yielded an average percentile for every location and every parameter. Figure 12 shows this average percentile for every location bin and param-eter, in chronological order according to the YOGAM route. Additionally, the altitude profile is shown. It is confirmed that most of the locations that are least influenced by
20
anthropogenic activity are located at higher altitudes. The only exceptions are loca-tions influenced by busy main roads. The relaloca-tionship between the percentiles and the altitude is reasonably linear for all three parameters (R2= 0.6 ± 0.1).
ACPD
3, 2739–2782, 2003Fine and ultrafine particles in the Z ¨urich
(Switzerland) area N. Bukowiecki, et al. Title Page Abstract Introduction Conclusions References Tables Figures J I J I Back Close
Full Screen / Esc
Print Version
Interactive Discussion
c
EGU 2003
5.2. Event-based pollution
To study the influence of meteorological parameters, a classification of the individual measurements (in the following termed events), rather than a classification per location bin was considered to be reasonable. Again, the percentile of every single value was calculated individually for N(80–140), V2.5 and CO. In contrast to above, the average
5
of the percentiles over the three parameters was then formed for every date and loca-tion in the database. These average percentiles per event were assigned to one of 5 categories: Category 1 included average percentile values of 0–20%, category 2 20– 40%, category 3 40–60%, category 4 60–80% and category 5 80–100%. In this way, high-pollution events would fall into category 5, while clean-air events were assigned
10
to category 1. Figure 13 shows annual mean and median SMPS particle number size distributions for the individual categories. There is a remarkable difference between the median and the mean distributions especially for category 5, indicating that extreme sit-uations within this category strongly influence mean distributions. Here, extraordinarily high number concentrations of ultrafine particles are found, which were regularly
ob-15
served in the morning hours on a route stretch near a busy freeway (location bin num-bers 4 and 5 in Table 1). This level of primary ultrafines is typical for freeways (Kittelson et al., 2001; Zhu et al., 2002) and is much larger than for other, non-freeway urban con-ditions that statistically were more frequent during YOGAM. This is also reflected in the median size distribution, which is less influenced by freeway situations. The trend from
20
categories 1 to 5 shows, beside an increase in the integrated number concentration and the number concentration in the combustion aerosol accumulation mode, an es-pecially noticeable increase in ultrafine number concentration. This confirms that the formation of primary ultrafines was enhanced in situations of high anthropogenic (and especially traffic-related) air pollution. There is however no evidence from these data
25
that a large number concentration of accumulation mode particles, which shortens the lifetime of ultrafine particles due to higher coagulation rates, suppresses the nucleation of primary ultrafines.
ACPD
3, 2739–2782, 2003Fine and ultrafine particles in the Z ¨urich
(Switzerland) area N. Bukowiecki, et al. Title Page Abstract Introduction Conclusions References Tables Figures J I J I Back Close
Full Screen / Esc
Print Version
Interactive Discussion
c
EGU 2003
Figure 14 shows temperature-resolved mean and median number size distributions for category 5 and confirms the previous findings in literature stating that the forma-tion of primary ultrafine particles is enhanced at cold temperatures (Abdul-Khalek et al., 2000), as it is seen both in mean and median number size distributions. The dif-ferences in the mean and median distributions can be assigned to the same reasons
5
as discussed for Fig. 13. Figures 15 and 16 show particle number size distributions resolved by cluster categories A, B1 and B2 (see Sect. 4) for the pollution categories 5 and (1,2), respectively. Additionally, the size distributions are split into morning and afternoon cases. OPC size distributions are included in graphs. The slight disconti-nuities in the combined SMPS and OPC number distributions are likely to result from
10
the fact that in the OPC the individual particles are classified according to their light scattering behavior, which depends on the particle size, morphology and refractive in-dex. Since the OPC was calibrated with spherical Latex particles, the observed shift towards smaller diameters is most probably due to the different refractive index and complex morphology of the measured particles in the range 300–1000 nm. In Fig. 15,
15
presenting the highest pollution event category (downtown Z ¨urich and morning free-way episodes), the striking difference in the morning median and mean distributions once more suggests an occurrence of heavy primary (directly traffic-related) ultrafine particle formation during strongly polluted morning events, enhanced by cold tempera-tures (comparable to Fig. 14). This phenomenon is strongest for category B1 (mainly
20
cold winter days) and weakest for category A (mainly spring days), but clearly occurs in all cluster categories. In the afternoon distributions no evident differences between median and mean distributions are observed. In all cases, especially in category A, a concentration decrease in the 80–140 nm size range is seen. This is usually caused by increases in the mixed boundary layer height in the afternoon. Figure 16 shows the
25
corresponding plots for data in the lowest pollution categories (1 and 2), mainly found at rural, elevated areas (see also Fig. 12). For cluster category A (mainly spring days with high global radiation), a remarkable difference between median and mean distri-butions is seen for the afternoon distridistri-butions, which does not occur that obviously in
ACPD
3, 2739–2782, 2003Fine and ultrafine particles in the Z ¨urich
(Switzerland) area N. Bukowiecki, et al. Title Page Abstract Introduction Conclusions References Tables Figures J I J I Back Close
Full Screen / Esc
Print Version
Interactive Discussion
c
EGU 2003
the corresponding morning distributions and the entire rest of the cluster categories. This might be an indication that locally elevated concentrations of secondary ultrafine particles occurred in low polluted areas under these conditions, triggered by higher photochemical activity. Furthermore, these particles are probably not primary because they are found in the afternoon at higher temperatures than in the morning. Similar
5
to Fig. 15, concentrations in the 80–140 nm size range decrease from morning to af-ternoon, in this case suggesting that the rural locations were influenced by pollution also in the morning. Due to vertical mixing and dilution the concentrations decreased throughout the day. Category B2 (low global radiation and strong winds at high alti-tudes) is characterized by extraordinarily low number and surface concentrations for
10
particles larger than 300 nm, yielding low values of Stot and S(OPC). This indicates a generally clean atmosphere, associated with the high wind speeds from the west with a low residence time over the continent, and possibly resulting from precipitation on the previous hours/days causing below-cloud scavenging of large particles. The third category, B1 (low global radiation, cold temperatures), shows low concentration levels
15
for large particles in the mornings (see also Stot and S(OPC)) but a large increase in the afternoon. At the same time there is a rather high number concentration (compared to the other situations) for both the median and mean distributions in the ultrafine size range in the mornings, which decreases in the afternoon. Daily morning concentra-tions of N(<30) and CO were correlated in this category, and the morning average
20
temperature was low (7.5◦C). This suggests that the observed ultrafine particles were primary.
6. Summary and conclusions
It was the goal of this study to evaluate the suitability of a mobile measurement ap-proach for a seasonal and spatial assessment of fine and ultrafine particles in the
25
Z ¨urich area, and to obtain an integral picture on the annual variation of aerosol levels in this area. We already showed earlier that mobile measurements are useful for
short-ACPD
3, 2739–2782, 2003Fine and ultrafine particles in the Z ¨urich
(Switzerland) area N. Bukowiecki, et al. Title Page Abstract Introduction Conclusions References Tables Figures J I J I Back Close
Full Screen / Esc
Print Version
Interactive Discussion
c
EGU 2003
term air pollution investigations that allow investigating and distinguishing between day and night situations but also between urban and rural areas within the same experi-ment involving a single mobile laboratory. Using appropriate multivariate statistics the same has been shown in this study to be possible also for seasonal investigations. Overall, the total particle background number concentration was lowest at elevated
ru-5
ral sites. The annual average of the particle background covering all area types was 25 000 ± 20 000 cm−3 (mean ± standard deviation). In downtown Z ¨urich, the annual background concentration level was 35 000 ± 30 000 cm−3, while the corresponding value for rural areas was 15 000 ± 12 000 cm−3. This agrees with the ranges that we presented in our previous YOGAM case study. It has been shown with Principal
Com-10
ponent Analysis (PCA) that this trend was always true within one measuring day, and that N(80–140), V2.5, carbon monoxide and the active surface area are good indica-tors for the level of anthropogenic air pollution. Analysis of Variance (ANOVA) showed that the day-to-day and seasonal variation of N(<30), N(80–140), particle background number concentration and the active surface area was clearly larger than the
spa-15
tial (urban vs. rural) concentration variation of these parameters. Thus, meteorology governs the major annual variance of fine and ultrafine particulate air pollution in the selected area and exceeds the annual spatial pollution variation. Therefore, it is for example suggested for epidemiological studies to relate health effects not only to an exposure location type, but also to the influence of weather conditions at a specific
lo-20
cation. Based on PCA and cluster analysis it has also been shown that primary (directly traffic-influenced) ultrafine particles regularly occurred in highly polluted areas, with an increased forming potential at cold temperatures, which was typically the case during winter inversion episodes. Ultrafine number concentrations along a freeway stretch were consistently much higher (usually > 80 000 cm−3 in average) and more regularly
25
observed than in other urban area types. These observations agree well with previous literature. A suppression of nucleation has not been observed for high concentrations of combustion accumulation mode aerosol. There was evidence for secondary (indi-rectly traffic-influenced or biogenic) ultrafines in clean rural areas in the afternoons of
ACPD
3, 2739–2782, 2003Fine and ultrafine particles in the Z ¨urich
(Switzerland) area N. Bukowiecki, et al. Title Page Abstract Introduction Conclusions References Tables Figures J I J I Back Close
Full Screen / Esc
Print Version
Interactive Discussion
c
EGU 2003
warm and sunny days, mainly in spring. Their occurrence was however generally low, and number concentrations were considerably lower than for primary ultrafines. This agrees with other studies found in literature. Nucleation events characterized by a “ba-nana” shape of size distribution contour plots, as for example described by (Boy and Kulmala, 2002b) , were not captured by this experiment, due to the mobile approach in
5
this complex terrain.
These findings lead us to the conclusion that, with an appropriate testing pattern, mobile measurements as described in this study are suitable for long-term pollutant as-sessments to obtain good information on spatial variability and reasonable information on the temporal variability. For aspects concerning spatial resolution an experimental
10
design using a mobile measurement may even be more appropriate than a network of stationary measuring sites.
Acknowledgement. We thank the canton of Z ¨urich, the BUWAL (Swiss Agency for the Environ-ment, Forests and Landscape) and the Z ¨urich city authorities for their support and funding. We also would like to acknowledge E. Pretsch (ETH Z ¨urich) for his valuable statistical advice. Last 15
but not least we thank R. Richter for his great help during the planning and experimental phase of the project and M. Tinguely for providing meteorological and geographical data.
References
Abdul-Khalek, I. S., Kittelson, D. B., and Brear, F.: The influence of dilution conditions on diesel exhaust particle size distribution measurements, SAE Technical Paper Series, 1999-20
01-1142, 1999.
Abdul-Khalek, I. S., Kittelson, D. B., and Brear, F.: Nanoparticle growth during dilution and cool-ing of diesel exhaust: Experimental investigation and theoretical assessment, SAE Technical Paper Series, 2000-01-0514, 2000.
Baltensperger, U., Streit, N., Weingartner, E., Nyeki, S., Pr ´ev ˆot, A. S. H., Van Dingenen, R., 25
Virkkula, A., Putaud, J. P., Even, A., ten Brink, H., Blatter, A., Neftel, A., and G ¨aggeler, H. W.: Urban and rural aerosol characterization of summer smog events during the PIPAPO field campaign in Milan, Italy, J. Geophys. Res.-Atmos., 107, 10.1029/2001JD001292, 2002.
ACPD
3, 2739–2782, 2003Fine and ultrafine particles in the Z ¨urich
(Switzerland) area N. Bukowiecki, et al. Title Page Abstract Introduction Conclusions References Tables Figures J I J I Back Close
Full Screen / Esc
Print Version
Interactive Discussion
c
EGU 2003 Birmili, W. and Wiedensohler, A.: New particle formation in the continental boundary layer:
Meteorological and gas phase parameter influence, Geophys. Res. Lett., 27, 3325–3328, 2000.
Boy, M. and Kulmala, M.: Influence of spectral solar irradiance on the formation of new particles in the continental boundary layer, Atmos. Chem. Phys. Discuss., 2, 1317–1350, 2002a. 5
Boy, M. and Kulmala, M.: Nucleation events in the continental boundary layer: Influence of physical and meteorological parameters, Atmos. Chem. Phys., 2, 1–16, 2002b.
Bukowiecki, N., Dommen, J., Pr ´ev ˆot, A. S. H., Richter, R., Weingartner, E., and Baltensperger, U.: A mobile pollutant measurement laboratory - measuring gas phase and aerosol ambient concentrations with high spatial and temporal resolution, Atmos. Environ., 36, 5569–5579, 10
2002.
Capaldo, K. and Pandis, S.: Lifetime of ultrafine diesel aerosol – Report for the University of Minnesota and the Coordinating Research Council under the E-43 project Diesel Aerosol Sampling Methodology, Carnegie Mellon University, Pittsburgh PA, 2001.
Chambers, J. M. and Hastie, T. J.: Statistical Models in S, Chapman and Hall, London, 1992. 15
Dockery, D. W., Pope, C. A., Xu, X. P., Spengler, J. D., Ware, J. H., Fay, M. E., Ferris, B. G., and Speizer, F. E.: An association between air pollution and mortality in six United- States cities, N. Engl. J. Med., 329, 1753–1759, 1993.
Donaldson, K., Li, X. Y., and MacNee, W.: Ultrafine (nanometre) particle mediated lung injury, J. Aerosol. Sci., 29, 553–560, 1998.
20
Hand, J. L. and Kreidenweis, S. M.: A new method for retrieving particle refractive index and effective density from aerosol size distribution data, Aerosol Sci. Technol., 36, 1012–1026, 2002.
Jolliffe, I. T.: Principal Component Analysis, Springer-Verlag, New York, 1986.
Katsouyanni, K., Touloumi, G., Spix, C., Schwartz, J., Balducci, F., Medina, S., Rossi, G., Woj-25
tyniak, B., Sunyer, J., Bacharova, L., Schouten, J. P., Ponka, A. and Anderson, H. R.: Short term effects of ambient sulphur dioxide and particulate matter on mortality in 12 European cities: Results from time series data from the APHEA project, Br. Med. J., 314, 1658–1663, 1997.
Kaufman, L. and Rousseeuw, P. J.: Finding Groups in Data: An Introduction to Cluster Analysis, 30
John Wiley & Sons, New York, 1990.
Kittelson, D. B., Watts, W., and Johnson, J.: Diesel Aerosol Sampling Methodology – CRC E-43 Final Report, University of Minnesota, Minneapolis, 2002.
ACPD
3, 2739–2782, 2003Fine and ultrafine particles in the Z ¨urich
(Switzerland) area N. Bukowiecki, et al. Title Page Abstract Introduction Conclusions References Tables Figures J I J I Back Close
Full Screen / Esc
Print Version
Interactive Discussion
c
EGU 2003 Kittelson, D. B., Watts, W. F., and Johnson, J. P.: Fine particle (nanoparticle) emissions on
Minnesota highways, Minnesota Department of Transportation, 2001-12, 2001.
Laden, F., Schwartz, J., Speizer, F. E., and Dockery, D. W.: Air pollution and mortality: A continued follow-up in the Harvard six cities study, Epidemiology, 12, 437, 2001.
M ¨akel ¨a, J. M., Koponen, I. K., Aalto, P., and Kulmala, M.: One-year data of submicron size 5
modes of tropospheric background aerosol in Southern Finland, J. Aerosol. Sci., 31, 595– 611, 2000.
Mardia, K. V., Kent, J. T., and Bibby, J. M.: Multivariate Analysis, Academic Press, London, 1979.
McMurry, P. H. and Woo, K. S.: Size distributions of 3–100-nm urban Atlanta aerosols: Mea-10
surement and observations, J. Aerosol Med., 15, 169–178, 2002.
Oberd ¨orster, G. and Utell, M. J.: Ultrafine particles in the urban air: To the respiratory tract – And beyond?, Environ. Health Perspect., 110, A440–A441, 2002.
O’Dowd, C. D., Aalto, P., H ¨ameri, K., Kulmala, M., and Hoffmann, T.: Aerosol formation – Atmospheric particles from organic vapours, Nature, 416, 497–498, 2002.
15
Paatero, P. and Hopke, P. K.: Discarding or downweighting high-noise variables in factor ana-lytic models, Anaana-lytica Chimica Acta, In Press, 2003.
Pope, C. A., Thun, M. J., Namboodiri, M. M., Dockery, D. W., Evans, J. S., Speizer, F. E., and Heath, C. W.: Particulate air pollution as a predictor of mortality in a prospective study of United-States adults, Am. J. Respir. Crit. Care Med., 151, 669–674, 1995.
20
Schindler, C., K ¨unzli, N., Bongard, J. P., Leuenberger, P., Karrer, W., Rapp, R., Monn, C., and Ackermann-Liebrich, U.: Short-term variation in air pollution and in lung function among never-smokers – The Swiss study on air pollution and lung diseases in adults (SAPALDIA), Am. J. Respir. Crit. Care Med., 163, 356–361, 2001.
Tobias, H. J., Beving, D. E., Ziemann, P. J., Sakurai, H., Zuk, M., McMurry, P. H., Zarling, D., 25
Waytulonis, R., and Kittelson, D. B.: Chemical analysis of diesel engine nanoparticles using a nano- DMA/thermal desorption particle beam mass spectrometer, Environ. Sci. Technol., 35, 2233–2243, 2001.
U.S. Health Effects Institute: Understanding the health effects of components of the particulate matter mix: Progress and next steps, HEI Perspectives, 2002.
30
Voss, W.: Taschenbuch der Statistik, Fachbuchverlag Leipzig im Carl Hanser Verlag, Leipzig, 2000.
ACPD
3, 2739–2782, 2003Fine and ultrafine particles in the Z ¨urich
(Switzerland) area N. Bukowiecki, et al. Title Page Abstract Introduction Conclusions References Tables Figures J I J I Back Close
Full Screen / Esc
Print Version
Interactive Discussion
c
EGU 2003 Wichmann, H. E. and Peters, A.: Epidemiological evidence of the effects of ultrafine particle
exposure, Philos. Trans. R. Soc. Lond. Ser. A-Math. Phys. Eng. Sci., 358, 2751–2768, 2000. Zhu, Y. F., Hinds, W. C., Kim, S., Shen, S., and Sioutas, C.: Study of ultrafine particles near a
ACPD
3, 2739–2782, 2003Fine and ultrafine particles in the Z ¨urich
(Switzerland) area N. Bukowiecki, et al. Title Page Abstract Introduction Conclusions References Tables Figures J I J I Back Close
Full Screen / Esc
Print Version
Interactive Discussion
c
EGU 2003
Table 1. Classification of individual stretches of the YOGAM route into 75 location bins regard-ing altitude and vicinity to anthropogenic activity. R: Rural, S: Suburban: U: Urban (downtown Z ¨urich), HT: Heavy traffic area. Altitudes are indicated in meters above sea level. The bins are sorted chronologically, in the order how they were passed while driving on the route. A normal measuring day included the access route from Paul Scherrer Institute to the loop starting point (1–9), followed by two subsequent runs along bins 10–75
Bin No. 1 2 3 4 5 6 7 8 9 10 11 12 13 14 15 Altitude 356 364 398 432 446 497 576 577 564 515 527 428 424 433 482 Type R S S HT HT S S S S S S U U U U Bin No. 16 17 18 19 20 21 22 23 24 25 26 27 28 29 30 Altitude 539 579 485 446 459 463 464 449 469 485 503 534 529 542 540 Type U S S S R R R R S HT HT HT R R R Bin No. 31 32 33 34 35 36 37 38 39 40 41 42 43 44 45 Altitude 593 588 550 570 638 776 887 830 768 793 732 696 665 666 696 Type S S S S S R R R R R R R R R R Bin No. 46 47 48 49 50 51 52 53 54 55 56 57 58 59 60 Altitude 694 643 633 626 615 602 615 590 544 525 555 598 632 642 590 Type R R R R R R R R S S HT S R R R Bin No. 61 62 63 64 65 66 67 68 69 70 71 72 73 74 75 Altitude 468 543 467 428 428 446 453 485 465 458 503 438 418 420 467 Type R S S S S S S S S HT HT S S HT HT 2763
ACPD
3, 2739–2782, 2003Fine and ultrafine particles in the Z ¨urich
(Switzerland) area N. Bukowiecki, et al. Title Page Abstract Introduction Conclusions References Tables Figures J I J I Back Close
Full Screen / Esc
Print Version
Interactive Discussion
c
EGU 2003
Table 2. Parameters measured during YOGAM used for the assessment presented in this paper. For every parameter it is indicated a) how raw data was treated to obtain the location bin values, b) how individual parameters are connected to other parameters and c) how they eventually were transformed in this study to become normally distributed (sqrt= square root). N: Number concentration, S: Surface area concentration, V: Volume concentration. Numbers in brackets indicate size ranges (in nm)
Parameter time resolutionRaw data Treatment Dependencies Transformation N(<30) 3 min average - log10
N(30-80) 3 min average - log10
N(80-140) 3 min average - log10
N(140-310) 3 min average - log10
Ntot(OPC) 6 s average - sqrt
Ntot ≡ CPC(mean) 1 s average - log10
Nbkg ≡ CPC(background) 1 s 5% percentile - log10
S(<30) 3 min average ~ ND2 log 10
S(30-80) 3 min average ~ ND2 log 10
S(80-140) 3 min average ~ ND2 log 10
S(140-310) 3 min average ~ ND2 log 10
Stot(OPC) 6 s average ~ ND2 sqrt
V(<30) 3 min average ~ ND3 log10
V(30-80) 3 min average ~ ND3 log 10
V(80-140) 3 min average ~ ND3 log 10
V(140-310) 3 min average ~ ND3 log 10
V1 ≡ V(<1000) 3 min average ~ ND3 sqrt
V2.5 ≡ V(<2500) 3 min average ~ ND3 sqrt
V10 ≡ V(<10000) 3 min average ~ ND3 sqrt
Vtot(OPC) 6 s average ~ ND3 sqrt
DC 1 s average - sqrt CO 1 s average - log10
Altitude (Alt) 1 s average - log10
Pressure (Press) 1 s average ~ Alt-1 log10
Temperature (temp) 1 s average - - Relative Humidity (RH) 1 s average - log10
Global Radiation (GR) 1 s 95% percentile - -
ACPD
3, 2739–2782, 2003Fine and ultrafine particles in the Z ¨urich
(Switzerland) area N. Bukowiecki, et al. Title Page Abstract Introduction Conclusions References Tables Figures J I J I Back Close
Full Screen / Esc
Print Version
Interactive Discussion
c
EGU 2003
Table 3. Overview over the YOGAM measuring days discussed in this study. Summer 2001 data (5 measuring days) were not used for this study except for CO due to problems with SMPS and DC measurements. Temperature and global radiation represent daily averages plus standard deviation of the (day-time) values measured with the mobile laboratory
Date Day type Temperature (oC) Global Radiation (W m-2) 11.10.01 Weekday 12.9 ± 2.6 300 ± 114 14.10.01 Sunday 15.6 ± 3.0 320 ± 92 31.10.01 Weekday 14.4 ± 1.7 214 ± 132 05.11.01 Night 4.6 ± 1.0 - Autu mn 2001 06.11.01 Weekday 5.9 ± 1.1 138 ± 92 28.01.02 Weekday 9.9 ± 1.1 214 ± 102 29.01.02 Weekday 5.1 ± 2.1 156 ± 52 29.01.02 Night 1.2 ± 2.0 - 30.01.02 Weekday 6.8 ± 3.3 218 ± 90 Wi nter 2001 /02 03.02.02 Sunday 8.6 ± 3.1 254 ± 100 22.04.02 Weekday 10.7 ± 2.8 510 ± 130 23.04.02 Weekday 13.1 ± 2.3 528 ± 136 25.04.02 Weekday 12.2 ± 2.9 480 ± 180 26.04.02 Weekday 14.5 ± 1.6 314 ± 214 15.05.02 Weekday 15.5 ± 2.5 626 ± 90 16.05.02 Weekday 18.8 ± 3.3 612 ± 96 17.05.02 Weekday 22.1 ± 2.8 624 ± 80 30.05.02 Night 10.0 ± 2.0 - Spr ing 2 002 02.06.02 Sunday 18.0 ± 2.0 640 ± 100 2765
ACPD
3, 2739–2782, 2003Fine and ultrafine particles in the Z ¨urich
(Switzerland) area N. Bukowiecki, et al. Title Page Abstract Introduction Conclusions References Tables Figures J I J I Back Close
Full Screen / Esc
Print Version
Interactive Discussion
c
EGU 2003
Table 4. Results of the two-way replicated ANOVA analysis for the 19 YOGAM measuring days, during which the location bins 10–75 (see Table 1) were covered twice by one route loop in the morning and one in the afternoon. Parameters and values are discussed in the text. The third line in each parameter indicates interactions between factors. All interactions indicated in the table are significant. The F-value ratios represent the ratio of F(date) to F(location) per parameter
Parameter Factor Degrees of freedom
Sum of Sq Mean Sq F-Value p(F) F-value
ratio date 15 114.7 7.65 73.5 < 0.001 location 59 25.8 0.438 4.21 < 0.001 date:location 885 20.6 0.023 0.224 0.999 Nbkg residuals 960 99.8 0.104 - - 17.5 date 15 153.9 10.3 264.6 < 0.001 location 59 49.5 0.840 21.7 < 0.001 date:location 885 37.5 0.042 1.093 0.089 Ntot residuals 960 37.2 0.039 - - 12.6 date 15 60.4 4.02 196.6 < 0.001 location 59 21.1 0.358 17.5 < 0.001 date:location 885 15.8 0.018 0.87 0.982 Ac tiv e su rf ac e residuals 960 19.7 0.02 -11.2 date 15 62 4.13 151.9 < 0.001 location 59 40.5 687 25.2 < 0.001 date:location 885 22 0.025 0.915 0.911 N( 80-140) residuals 960 26.1 0.027 - - 6.0 date 15 66 4.4 35.9 < 0.001 location 59 120.7 2.05 16.7 < 0.001 date:location 885 92.6 0.105 0.854 0.991 N( < 30) residuals 960 117.6 0.123 - -2.1 date 14 17.9 1.28 19.5 < 0.001 location 59 44 0.746 11.4 < 0.001 date:location 826 20.7 0.025 0.381 0.999 CO residuals 900 59 0.066 - -1.7 2766
ACPD
3, 2739–2782, 2003Fine and ultrafine particles in the Z ¨urich
(Switzerland) area N. Bukowiecki, et al. Title Page Abstract Introduction Conclusions References Tables Figures J I J I Back Close
Full Screen / Esc
Print Version Interactive Discussion c EGU 2003 660 670 680 690 700 710 720 Swiss X (km) 230 240 250 260 270 Sw is s Y (k m ) S
Fig. 1. Main (solid black line) and access (thin black line) route of the YOGAM project. Dark gray filled areas represent lakes, and the contours show the altitude profile (z, meters above sea level). The two main cities in the selected area, Z ¨urich and Winterthur, are also indicated. Swiss X and Y designate the coordinates in the official Swiss kilometer grid. Additionally, location bin classifications according to Table 1 (R: rural, S: suburban, U: urban, HT: heavy-traffic areas) and official meteorological monitoring stations (M1–M7) are shown.
ACPD
3, 2739–2782, 2003Fine and ultrafine particles in the Z ¨urich
(Switzerland) area N. Bukowiecki, et al. Title Page Abstract Introduction Conclusions References Tables Figures J I J I Back Close
Full Screen / Esc
Print Version Interactive Discussion c EGU 2003 10.0 5.01 11.0 5.01 13.0 5.01 21.0 5.01 22.0 5.01 23.0 5.01 20.0 6.01 10.0 7.01 11.0 7.01 23.0 7.01 26.0 7.01 11.1 0.01 12.1 0.01 14.1 0.01 31.1 0.01 06.1 1.01 28.0 1.02 29.0 1.02 30.0 1.02 03.0 2.02 22.0 4.02 23.0 4.02 25.0 4.02 26.0 4.02 15.0 5.02 16.0 5.02 17.0 5.02 31.0 5.02 02.0 6.02 a ft e rn o o n m o rn in g N (cm-3)
busy main road busy main road
rural rural suburban urban urban/ suburban 3000 5633 1.058E4 1.986E4 3.728E4 7E4
Fig. 2. Seasonal and spatial particle background variation for the Z ¨urich (Switzerland) area. A contour plot of the particle background number concentration (N>3 nm) is shown, calculated with the 5% percentile of the CPC total particle number concentration (see Bukowiecki et al., 2002b). The x-axis represents the days selected for YOGAM measurements (including spring and summer 2001), while the y-axis depicts a morning and afternoon loop along the YOGAM route (in chronological order).
ACPD
3, 2739–2782, 2003Fine and ultrafine particles in the Z ¨urich
(Switzerland) area N. Bukowiecki, et al. Title Page Abstract Introduction Conclusions References Tables Figures J I J I Back Close
Full Screen / Esc
Print Version Interactive Discussion c EGU 2003 Factors 4. 04 .2 4. 44 .6 11.10.01 14.10.01 31.10.01 06.11.01 28.01.02 29.01.02 30.01.02 03.02.02 22.04.02 23.04.02 25.04.02 26.04.02 15.05.02 16.05.02 17.05.02 02.06.02 location date Factors 4.0 4. 2 4.4 4.6 11.10.01 14.10.01 31.10.01 06.11.01 28.01.02 29.01.02 30.01.02 03.02.02 22.04.02 23.04.02 25.04.02 26.04.02 15.05.02 16.05.02 17.05.02 02.06.02 location date M ea n of log( N ) bk g M ed ia n of lo g( N ) bk g Mean Median
Fig. 3. Overview over the mean and median levels of the particle background number con-centrations (Nbkg, 5% percentile values of location binned values of Ntot) measured at different locations on different dates during YOGAM. For ANOVA with location and date as input factors, the normally transformed Nbkgdata was used.