HAL Id: hal-01273272
https://hal.archives-ouvertes.fr/hal-01273272
Submitted on 12 Jan 2021HAL is a multi-disciplinary open access archive for the deposit and dissemination of sci-entific research documents, whether they are pub-lished or not. The documents may come from teaching and research institutions in France or abroad, or from public or private research centers.
L’archive ouverte pluridisciplinaire HAL, est destinée au dépôt et à la diffusion de documents scientifiques de niveau recherche, publiés ou non, émanant des établissements d’enseignement et de recherche français ou étrangers, des laboratoires publics ou privés.
Distributed under a Creative Commons Attribution - NonCommercial| 4.0 International License
Inherent Optical Properties from Satellite Observations
in the Inner and Mid-Shelves of the South of Buenos
Aires Province (Argentina)
Ana L. Delgado, Hubert Loisel, Cédric Jamet, Vincent Vantrepotte, Gerardo
Perillo, M. Cintia Piccolo
To cite this version:
Ana L. Delgado, Hubert Loisel, Cédric Jamet, Vincent Vantrepotte, Gerardo Perillo, et al.. Seasonal and Inter-Annual Analysis of Chlorophyll-a and Inherent Optical Properties from Satellite Obser-vations in the Inner and Mid-Shelves of the South of Buenos Aires Province (Argentina). Remote Sensing, MDPI, 2015, 7 (9), pp.11821-11847. �10.3390/rs70911821�. �hal-01273272�
remote sensing
ISSN 2072-4292
www.mdpi.com/journal/remotesensing Article
Seasonal and Inter-Annual Analysis of Chlorophyll-a and
Inherent Optical Properties from Satellite Observations in the
Inner and Mid-Shelves of the South of Buenos Aires
Province (Argentina)
Ana L. Delgado 1,2*, Hubert Loisel 3, Cédric Jamet 3, Vincent Vantrepotte 3,
Gerardo M.E. Perillo 1,4 and M. Cintia Piccolo 1,2
1 Instituto Argentino de Oceanografía (IADO-CONICET), Camino La Carrindanga km 7,
8000 Bahía Blanca, Argentina; E-Mails: gmeperillo@criba.edu.ar (G.M.E.P.); ofpiccol@criba.edu.ar (M.C.P.)
2 Departamento de Geografía y Turismo, Universidad Nacional del Sur, 12 de Octubre y San Juan,
8000 Bahía Blanca, Argentina
3 Laboratoire d’Océanologie et de Géosciences, UMR 8187 CNRS/ULCO, Av. Foch 32,
62930 Wimereux, France; E-Mails: Hubert.Loisel@univ-littoral.fr (H.L.); Cedric.Jamet@univ-littoral.fr (C.J.); Vincent.Vantrepotte@univ-littoral.fr (V.V.)
4 Departamento de Geología, Universidad Nacional del Sur, San Juan 670,
8000 Bahía Blanca, Argentina
* Author to whom correspondence should be addressed; E-Mail: aldelgado@iado-conicet.gob.ar;
Tel.: +54-291-486-1112 (ext. 154); Fax: +54-291-486-1112.
Academic Editors: Deepak R. Mishra, Eurico J. D’Sa, Sachidananda Mishra and Prasad S. Thenkabail
Received: 5 June 2015 / Accepted: 25 August 2015 / Published: 15 September 2015
Abstract: The aim of this study is to describe and understand the seasonal and inter-annual
physical and biological dynamics of the inner and mid shelves of the Southwestern Buenos Aires Province (Argentina). We used chlorophyll-a (chl-a) concentrations and inherent optical properties (IOPs), derived from ocean color products between 2002 and 2010, as a proxy for the physical and biological parameters of interest. This study focuses on the absorption by phytoplankton, aph(443), particulate backscattering, bbp(443), and absorption
due to dissolved and particulate detrital matter, adg(443), and chl-a derived from a
multiband quasi-analytical algorithm (QAA). A regionalization based on the coefficient of variation and the Census X-11 method were applied to define regions and to analyze the inter-annual and seasonal variability of the ocean color parameters, with regards to climate
variability. The coastal zone presents the highest values of chl-a with two maxima in winter and autumn, while the mid-shelf shows a strong spring chl-a maximum. After 2009, all parameters under study shifted their seasonality and their magnitude changed over the entire area. In the coastal zone, mean values of aph(443) and bbp(443) increased, while in
the mid-shelf, chl-a and aph(443) decreased. The observed inter-annual and seasonal
behavior of the parameters is tightly related to climate variability of the study area.
Keywords: MODIS-Aqua; inherent optical properties; chlorophyll-a; QAA algorithm;
coastal zone; El Rincón; climate variability
1. Introduction
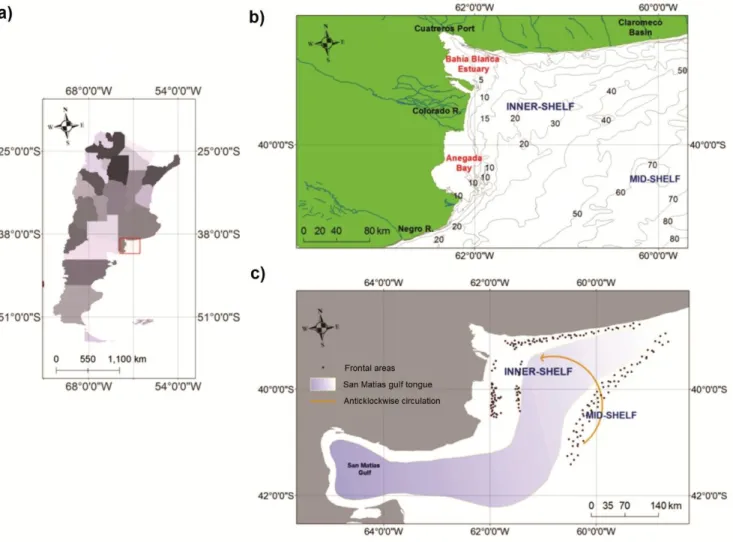
The inner-shelf of the southwestern Buenos Aires Province, usually called “El Rincón” (Figure 1), is a highly complex oceanographic and ecological system, characterized by large inputs of continental run-offs, locally-generating cells of high-salinity, and winds that dominate the inner-shelf dynamics [1,2]. Marrari et al. [3] reported that the availability of adequate food (high presence of phytoplankton and zooplankton), suitable thermal and salinity ranges, the presence of marine fronts [1,4], and the oceanic circulation that favors a retention mechanism, produce an appropriate environment for successful larval fish development. Therefore, the physical and biological characteristics of the El Rincón area generate a rich habitat of valuable commercial species, which are very important for the local artisanal fisheries [5]. Unfortunately there are not many studies in the area about the interaction of the physical-ecological processes, which have become critical for reaching a responsible management of the natural resources.
The existence of a salinity and a thermal front in the study area are generated by bathymetry changes and dilution effects, combined with the northern advection of San Matías Gulf waters, particularly in winter [2,4] (Figure 1c). These waters are characterized by high salinity values due to the dominance of evaporation over the precipitation in the water balance of the Gulf [2]. In addition, the whole coastal area is influenced by continental freshwater supplies, mainly through the Negro River, which provides 90% of the freshwater entering the system, with maximum discharge in spring (1210 m3·s−1) and in winter (1130 m3·s−1). The Colorado River is the second source of freshwater, with peak discharge in late spring (215 m3·s−1) [1,6]. The oceanic circulation is characterized by the
development of an anticlockwise gyre during winter and its dissolution during spring and summer [7] (Figure 1c). Cuadrado et al. [8] described the northward propagation of the Colorado River plume, from the river mouth to the mouth of the Bahía Blanca Estuary. The river plume has typically high suspended matter concentrations and relatively low salinity. The constant winds, prevailing from the north and northwest (speeds between 22 and 24 km·h−1), allow a mixing of the water column all year around [1].
Figure 1. Location of the study area. (a) south of Buenos Aires Province, Argentina;
(b) Bathymetry map of the study area; (c) scheme of the main physical oceanographic processes in the study area accordingly to[2,4].
The environmental complexity of El Rincón is further enhanced by the influence of El Niño Southern Oscillation (ENSO), which is regarded as a major influence on the inter-annual climate variability of South America [9,10]. The ENSO negative (El Niño) and positive phases (La Niña) were related to rainfall and Sea Surface Temperature (SST) anomalies in the main oceanic currents (Brazil and Malvinas). Several studies have related, for the Buenos Aires province, the occurrence of extreme wet (dry) events with negative (positive) ENSO phases [9–13]. Phytoplankton blooms are the main sign of enhancement of the pelagic activity [14], and their occurrence is tightly related to biogeochemical fluctuations in sea water, and the variability in the annual recruitment of fishes (e.g., [15,16]). Thus, the environmental changes that occur in the sea, linked to ENSO events, could affect phytoplankton dynamics and, in consequence, the artisanal fisheries of El Rincón waters.
Remote sensing has been recently used in order to acquire physical and biological data of the ocean system with high spatial and time resolutions. The inherent optical properties (IOPs), retrieved from Ocean Color imagery, may provide information about the concentration of the chlorophyll-a, sediments and dissolved organic matter at the ocean surface. While the absorption coefficient by phytoplankton is driven by the Chl-a concentration and size of phytoplankton cells [17,18], the particulate backscattering coefficient, bbp, is driven by the bulk suspended particulate matter
concentration, size and chemical nature [19]. The absorption coefficient by colored detrital matter, adg,
provides information about detrital matter, which is mainly driven by colored dissolved organic matter in offshore waters. These three coefficients can be used to classify surface water masses [20], water composition assessment [21–25], oceanic primary production [16,26] and, in consequence, timing of the seasonal biological cycle of fishes (i.e., [27,28]) and potential fishing zones (i.e., [29–31]). Further, the derived products of ocean color imagery are a valuable source of data for ecosystem modeling, which provide forecasts of the development of plankton blooms, being useful warnings of harmful algal blooms and eutrophication risk (i.e., [31,32]).
Regarding field estimates of bio-optical parameters in the inner and mid shelves of the south of Buenos Aires Province, the information remains null, and the lack of economic resources for oceanographic campaigns has become a major shortcoming for research. In this scenario, satellite estimations of the inherent optical properties and chlorophyll-a concentration are a valuable tool to make an early description of the seasonal and inter-annual physical and biological dynamics of the marine environment, in spite of the limitations clearly imposed by the lack of field data. Remote sensing techniques have been increasingly used for environmental research in South America. However, most studies focused on the temporal variability of chlorophyll-a, with low spatial resolution, in the Patagonian shelf [33–35], as well as in the continental shelf region [36–38]. Other studies compared in situ and satellite estimates of chlorophyll-a obtaining reasonable results [39–42]. Dogliotti et al. [43], based on satellite estimations from the SeaWiFS sensor, evaluated the chl-a dynamics in the north-Patagonian coastal zone (over 47°S), and found relatively high values and low seasonal variability. The influence of the Colorado and Negro rivers was clearly denoted by higher chl-a concentrations all year round. However, given the available information and the bio-optical algorithm applied in the study, interferences by suspended sediments and Colored Dissolved Organic Matter (CDOM) could not be separated from the signal, and the obtained chl-a values may be biased and imprecise [43].
To study the variability of chl-a and IOPs in our study of interest (Figure 1), we decided to use the quasi-analytical Algorithm (QAA) [44]. The QAA is based on the relationship between the below-surface remote-sensing reflectance and the IOPs (absorption and backscattering), and uses remote-sensing reflectance models derived from the radiative transfer equation [44]. The ocean color products we used have been validated in several coastal waters around the globe, showing accurate results [45,46] Using in situ data from the Taiwan Strait, Shang et al. [47] studied the performance of the quasi-analytical Algorithm (QAA) for the aph coefficient, and concluded that this is a superior
index to depict phytoplankton abundance on optically complex waters (coastal). Similar results were also obtained by Du et al. [48], who used QAA to derive adg from MODIS-Aqua, and compared
estimations with in situ measurements in coastal waters. Based on their results, they established that adg is an appropriate coefficient to estimate CDOM concentrations. The particulate backscattering (bbp)
coefficient derived from the QAA, has been widely used to estimate the concentrations of suspended solids in the ocean surface, and comparisons with in situ data from the Arabian Sea also showed the index potential to estimate the size and biogeochemical composition of the suspended material [49]. According to this study, the error of estimations is lower at short wavelengths (470 nm), even though there is a tendency for overestimation (19%).
The simplicity in implementation of the QAA became a key factor for processing large dataset as ten years of daily satellite imagery in the study area. Considering the promising results obtained in other coastal waters, and aware of the shortcomings imposed by the lack of local in situ measurements, we decided to apply QAA to Ocean Color imageries from MODIS-Aqua sensor to derive the IOPs and chl-a. Using these products as a proxy of bio-physical parameters would be a first approach to illuminate and understand the seasonal and inter-annual dynamics of the El Rincón waters. The aim of this work is (i) to determine for the first time the inter-annual and seasonal variability of the inherent optical properties (IOPs) and chlorophyll-a, used as a proxy of biogeochemical parameters (suspended sediments, CDOM, phytoplankton) obtained from Ocean Color imagery in El Rincón and (ii) to understand the spatial and temporal distribution of these parameters, in relation to the geophysical setting and the climate variability.
2. Data and Methods
2.1. Satellite Data
Satellite data were obtained from the Moderate Resolution Imaging Spectroradiometer (MODIS) on board Aqua. Daily level 1A data at 1 km spatial resolution from 2002 until 2010 were downloaded from the Ocean Color web site (http://oceancolor.gsfc.nasa.gov). The subset L1A daily files were processed using the SeaDAS software, version 7 [50] to obtain the L2 products. The standard NASA atmospheric correction algorithm was applied [51–53]. Numerous studies have shown that this algorithm generally provides the best overall performances over optically-complex coastal waters (i.e., [54–57]). Chlorophyll-a (Chl-a), absorption due to phytoplankton (aph443), absorption due to dissolved (gelbstoff
or CDOM) and particulate non-phytoplanktonic (detrital) matter (adg443), and particulate backscatter
(bbp443) were derived using the quasi-analytical algorithm (QAA) [44]. This algorithm was chosen for
its simple implementation on large datasets, and also for the good performance reported in other coastal areas. A detailed explanation of the algorithm is found in Lee et al. [44]. We additionally used the SST product downloaded from the Ocean Color web site as well. The SST is retrieved from the infrared bands of the MODIS-Aqua sensor using the non-linear sea-surface temperature (NLSST) algorithm [58]. Finally, L3 monthly products were processed from the daily L2 (1 km) products, using arithmetic averaging as recommended in [59,60] in MERCATOR projection.
2.2. Regionalization
A regionalization was performed to define regions that are similar in terms of temporal behaviour. To address the spatio-temporal variations of the IOPs and chl-a, we used the monthly L3 MODIS-Aqua composite between 2002 and 2010 and the variability coefficient (i.e., standard deviation/mean) for Chl-a, SST, bbp(443), adg(443) and aph(443). Based on these latter values, and the physically- and
biologically-known characteristics of the area, three main regions were determined: the coastal zone, inner-shelf zone, and mid-shelf zone.
Since the study area encloses diverse ecological systems which are influenced by different physical forcing, sub-areas of interest were determined inside each zone to understand the behavior of the El
Rincon dynamics. Two coastal regions of interest were considered: (1A) East of Bahia Blanca estuary, (1B) North of Colorado River discharge, (2A) The inner shelf, and (3A) The mid shelf.
2.3. Climate Variability
In order to determine the influence of the El Niño Southern Oscillation (ENSO) on the study area, in situ precipitation data, river discharges, and the Oceanic Niño Index (ONI) were compared to the IOPs and chl-a. Annual precipitation data were provided by the Instituto Nacional de Tecnología Agropecuaria (INTA) and the Centro de Recursos Naturales Renovables de la Zona Semiárida (CERZOS). Records covered the continental coastal zone of the study area (northeast, center and southwest region) for the period 2002–2010 (Figure 2). Annual discharges of the Colorado and Negro River were provided by the Cooperación de Fomento del Valle Bonaerense del Río Colorado (CORFO) and the Autoridad Interjuridiccional de las Cuencas de los Ríos Limay, Neuquén y Negro (AIC), respectively (Figure 2). ONI values were downloaded from the Climate Prediction Center webpage of the National Oceanic and Atmospheric Administration (NOAA) (http://www.cpc.ncep.noaa.gov). The index is calculated from the sea surface temperature (SST) anomalies as the three months running average in the region Niño 3.4 (Equatorial Pacific). When the anomaly is positive (>0.5 °C) a warm (El Niño) event occurs and when it is negative (<0.5 °C) a cold (La Niña) event occurs. The intensity of the events is defined by the magnitude of the anomaly; thus, weak events occur when the SST anomaly is between 0.5 and 0.9 °C; moderate events between 1 and 1.4 °C; and strong events are those which overcome 1.5 °C.
Figure 2. Location of the in situ stations of precipitation and river discharges in the study area.
2.4. Statistical Analysis
The L3 monthly products of the IOPs (aph(443), bbp(443), and adg(443)) and chl-a, as well as the
2002–December 2010 were analyzed in order to define their spatial and seasonal climatology behavior in the study area. The monthly time series were decomposed using the Census X-11 method [61], whose application to time-series analysis of satellite ocean color data has been extensively documented [62–64]. The statistical analysis is conducted at the level of each grid point, considering the spatial variations in the temporal coverage of the data record [64]. The missing data, due to the absence of satellite cover, are filled with the eigenvector filtering method that is based on the use of orthogonal components, and thus reflects the main temporal patterns of the original data [64,65].
Census X-11 method is based on an iterative bandpass filtering procedure that allows for the definition of a non-periodical seasonal term, in order to specifically assess the year to year variation in the time series seasonality (in terms of period and amplitude). The relative part of the variance of the components is estimated for each grid point, to identify the spatial patterns of the temporal variability in the series. This method aims at decomposing a time series X(t) (here monthly L3 products) into three additive components:
[X(t)=S(t)+T(t)+I(t)] (1) where S is the seasonal signal, T the trend cycle signal and I the irregular or residual signal [62,66].
The detailed Census X-11 applied to ocean color images is documented in Vantrepotte and Mélin [63]. Three successive steps are applied: (1) an estimation of the trend-cycle component is obtained from the annual-centered running average, and a seasonal running mean is applied to the trend series to acquire the seasonal component. Then, the series are normalized by subtracting the annual-centered running mean; (2) the revised estimates are obtained, applying a Henderson filter of weight to the seasonal adjusted series (X(t)−S(t)); and (3) final estimates of the trend and irregular components are calculated, repeating the application of the seasonal running mean and the Henderson filter on the revised trend-adjusted series.
In addition, the presence of significant monotonic long-term change in the time series was evaluated using the non-parametric seasonal Kendall statistics. The test relies on the computation of a suite of Mann-Kendall statistics applied monthly which finally is combined to detect the presence of long term monotonic changes in the original time series [64]. The amplitude of the changes was assessed using the non-parametric Sen’s slope estimator expressed in % yr−1 [65,67].
3. Results
3.1. Spatial Distribution of Chl-a and IOP’s
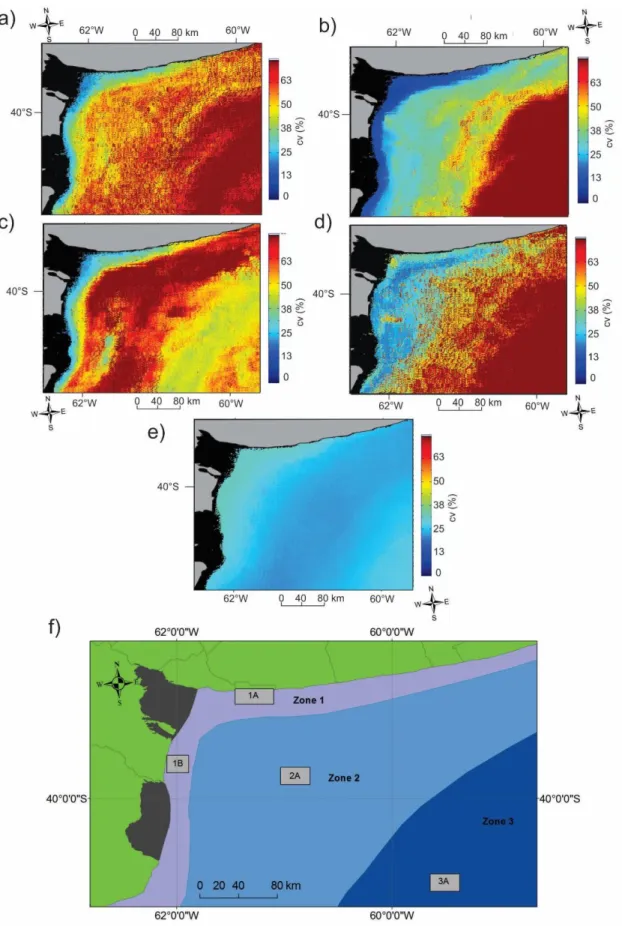
The regionalization adopted in the present study, and based on the spatial patterns of the variation coefficient, exhibits three distinct provinces (Figure 3). The coastal zone (Zone 1) extends as a fringe along the coastal Buenos Aires Province, with its outer limit close to the isobath of 15 m. The area has low coefficients of variation for all parameters (15% in chl-a, 35% in aph(443), 30% in bbp(443), and
25% in adg(443)), and also the highest mean values (Figure 4). Zone 2 is the inner-shelf, a transitional
zone between the coastal zone and the mid-shelf, with high coefficient of variation for bbp(443) (75%),
aph(443) (70%), and adg(443) (70%) (Figure 3). Zone 3 is the mid-shelf where chl-a, aph(443) and
Figure 3. Variability coefficient of the parameters in the study area. (a) aph(443); (b) chl-a;
(c) bbp(443); (d) adg(443); (e) SST; and (f) regionalization map and selected ‘regions of
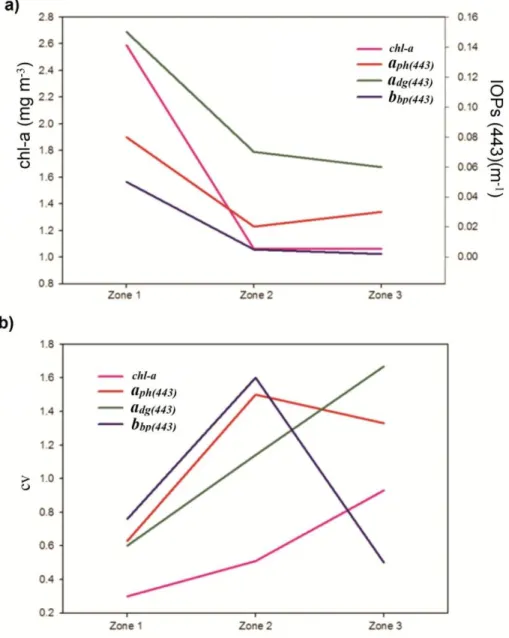
Figure 4. Climatology of the IOPs in the study area. (a) Mean values; (b) coefficient of variation.
The bio-optical parameters for zones 2 (inner-shelf) and 3 (mid-shelf) are very similar in terms of mean values (Figure 4). Some differences are, however, noticeable in the coefficients of variability, especially for bbp(443), which is two times higher in zone 2 than in zone 3, and for chl-a, which is
much more variable in zone 3 than in zone 2. The average seasonal behavior of these parameters presents differences depending on the area (Figure 5). In zones 1 and 2 aph(443), bbp(443), and adg(443)
showed the highest values in autumn and winter, and the lowest values in summer, with a noticeable difference on the mean values between the coastal zone and the inner- and mid-shelf (Figure 5). During spring, Zone 3 showed the highest values of chl-a and aph(443), possibly related to a higher
phytoplankton biomass, but also adg(443), which may indicate higher concentrations of CDOM and
non-pigmented particles. For all these parameters, minimum values were observed in late summer. In this area, mean values of bbp(443) does not present significant seasonal variations.
Figure 5. Climatology of the bio-optical parameters in the (a) coastal zone; (b) the
3.2. Description of the Temporal Patterns of the Bio-Optical Parameters in the Rsegions
3.2.1. General Seasonal and Trend Terms
Figure 6 presents the spatial distribution of the relative contribution of the variance associated with the Census X-11 seasonal (
p
S2) and trend (p
T2) cycle terms to the total variance of the products. The significant long-term monotonic changes over the 10 years period are expressed in % yr−1. Over most of the region and for most parameters the temporal variability is mainly dominated by the seasonal term S withp
S2 representing up to 60% of the overall variance (Figure 6).aph(443) and chl-a showed a dominant seasonal signal in the frontal area between the inner- and
mid-shelf waters (
p
2S > 75%); meanwhile on the frontal area between zone 1 and 2 the trend term (p
T2 > 65%) is the dominant source of temporal variability (Figure 6). aph(443) showed a strongpositive monotonic trend in the entire coastal and inner-shelf zones (> 5% yr−1). Chl-a also presented a positive linear trend between zone 1 and 2 from the Claromecó basin up to San Blas Bay (+3% yr−1). On the contrary, a negative monotonic tendency was observed through the east of the inner-shelf and in the mid-shelf (−3% to −5% yr−1, respectively).
For adg(443), the seasonal term (S variance) prevailed in zone 1 and 3 (
2
S
p
60–80%), meanwhile in the inner-shelf the trend term (T variance) was more important (p
T2 > 50%) (Figure 6). A negative adg(443) monotonic trend was detected in the entire study area, increasing from the coast to themid-shelf (−3% to −5% yr−1). bbp(443) seasonal component prevailed over the coastal zone, inner and
mid shelf (
p
S260–80%), though in the frontal areas (between zone 1 and 2 and zone 2 and 3) the trend signal was dominant (p
T240–60%) (Figure 6). The bbp(443) monotonic trend was positive in the frontalarea between zone 1 and 2, showing the highest values in front of Anegada bay and from the mouth of the Bahía Blanca Estuary up to the Claromecó basin (>5% yr−1). In contrast, most of the shelf region exhibits a negative tendency of −3% yr−1
.
3.2.2. Patterns within Regions of Interest and Trend Shape
As mentioned above, since the study area is diverse and is a highly-complex natural system, different sub-regions were examined to analyze the temporal variability of the bio-optical parameters. The region’s choice was based on the relevant signals detected, and also to emphasize the environmental variables affecting the biological processes on the diverse ecosystem of the Buenos Aires southern shelf. There were determined two regions in the coastal zone (1A and 1B), one in the inner shelf (2A), and one in the mid-shelf (3A) (Figure 3f).
(1) Coastal Zone
In region 1A (east of the mouth of Bahía Blanca Estuary) the seasonal trend was the dominant signal for all the parameters (
p
S2 > 75%) (Figure 6). aph(443) and bbp(443) showed, between 2002 andaph(443) S term substantially increased (20%), and the seasonality changed to a very strong maximum
Figure 6. Seasonal Relative contribution of the total variance of the IOPs signal. In the left
column is represented the seasonal component
( )
p
S2 and the right column the trend component( )
p
T2 of the Census X-11 temporal decomposition analysis (in %).Figure 7. X-11 terms statistics of aph(443), bbp(443), adg(443), and chl-a in the zone of
interest 1A. (a) S(t) (seasonal term); (b) T(t) trend term.
Chl-a S term presented high amplitude during all of the periods, with a strong maximum in late autumn-winter followed by a small one in spring. The amplitude of the signal became weaker in 2009–2010, though the seasonality did not change. Similarly, adg(443) showed a pronounced S term
amplitude for the period 2002–2008, with maximum values in winter followed by a very small peak in spring. During the period 2009–2010 the amplitude of the signal decreased (−50%) and seasonality shifted to a signal without an observed seasonal maxima.
The relative contribution of the trend term was not significant for any of the parameters in this region (Figure 7b). bbp(443) and aph(443) presented a decrease of the mean values of about 60% in
2004 and maxima in 2009. adg(443) showed a decrease in 2010.
In zone 1B (north of Colorado River discharge), all parameters showed, between 2002–2008, relatively low seasonal amplitude, with maxima mainly occurring in late-spring/early-summer and autumn; meanwhile, minimum values were observed in late-winter (Figures 1, 3 and 8a). The years presenting a minimum for aph(443) and chl-a were found in 2005 and 2008 (Figure 8b). The increase
of the trend term observed from 2009 (>50%) is associated with an increase of the amplitude of the seasonal fluctuations. In addition, seasonality changed with maximum values observed in winter, followed by a weaker autumn maximum. The highest peak of bbp(443) T(t) signal was found in
2002–2003 related to high seasonal amplitude (S(t)). The period 2005–2009 presents a variable signal, in concordance with the aph(443) and chl-a, with a peak in 2009. The seasonal signal became stronger
for all of them in 2009–2010, having the maxima in winter, followed by a smaller peak in late-summer/autumn. Even though the adg(443) trend term did not have as much variability as the other
parameters, the mean values followed the behavior of the other ones.
Figure 8. X-11 terms statistics of aph(443), bbp(443), adg(443), and chl-a in the zone of
interest 1B. (a) S(t) (seasonal term); (b) T(t) trend term.
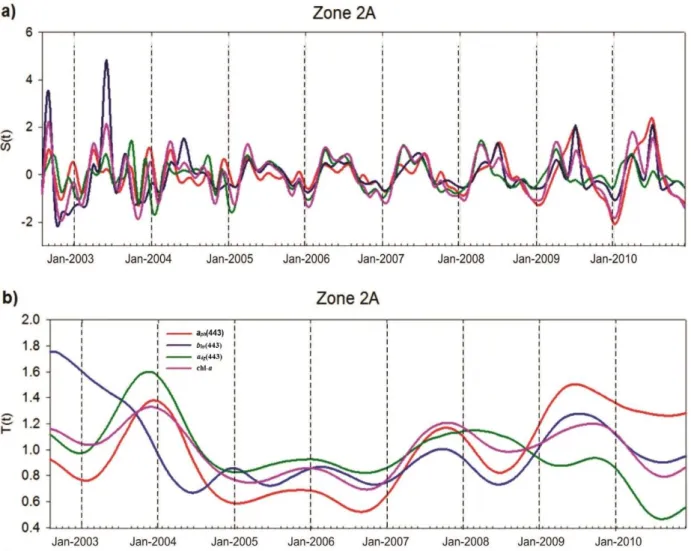
(2) Inner Shelf
The inner shelf (zone 2A) parameters showed a variable behavior, as expected as it is a transitional zone between the coastal and mid-shelf waters (Figure 1-3). The seasonal signal prevailed over the trend cycle signal for bbp(443) and chl-a (60%–70%); meanwhile, the temporal variance of aph(443)
and adg(443)products were both equally explained by the T(t) and S(t) signals (Figure 6). bbp(443)
seasonality was determined by maximum values in winter and in autumn. The amplitude of the signal was 80% higher in 2002–2003 coincidently with the maxima peak of the T(t) trend. Chl-a highest values were mainly detected in late autumn and winter with slightly higher amplitude in 2002–2003 and 2009–2010 (Figure 9a).
aph(443) seasonal signal was not clearly defined until 2009 when it shifted from having several
minor peaks during the year, to a strong winter maximum with a S signal amplitude 20% higher (Figure 9a). The trend term cycle of adg(443) presented a steep peak of almost 100% in 2003, even
though an increment on the S signal was not observed. A steady decay of the trend cycle signal from 2008 was detected, which caused the already mentioned negative tendency of the monotonic trend (−3% yr−1) (Figure 9b).
Figure 9. X-11 terms statistics of aph(443), bbp(443), adg(443), and chl-a in the zone of
interest 2A. (a) S(t) (seasonal term); (b) T(t) trend term.
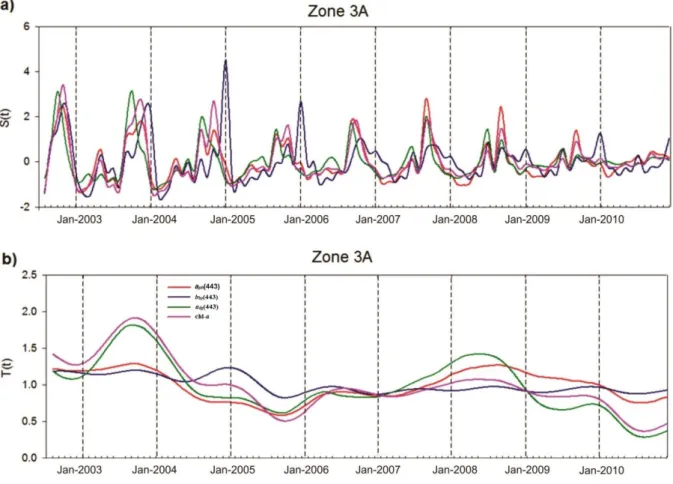
(3) Mid-Shelf
The temporal variability of the parameters in the mid-shelf (zone 3A) was clearly dominated by the seasonal signal (60%–80%), being the most intense of the whole area (Figure 6). aph(443), adg(443) and
chl-a presented up to 2008 a strong maximum in spring, followed by a smaller one in autumn or winter, depending on the year (Figure 10a). From 2009, a change in the seasonal signal was observed for all parameters, from a strong peak in spring to almost no peak in the whole year. Those three variables were in phase through all the period, showing a strong maximum in chl-a, adg(443), and aph(443) in 2003
(Figure 10b). After this maximum there was a decreasing tendency up to 2005, reaching the minimum for this latter year. From 2005 till 2008, aph(443) showed a positive trend tendency and from 2009 there
was decay in the aph(443), adg(443), and chl-a values. bbp(443) trend term variability was not significant,
though it presented a strong seasonality between 2002–2005 with maximum values in late-spring and summer. From 2005 till 2010 the amplitude of the signal has decreased.
Figure 10. X-11 terms statistics of aph(443), bbp(443), adg(443) and chl-a in the zone of
interest 3A. (a) S(t) (seasonal term); (b) T(t) trend term.
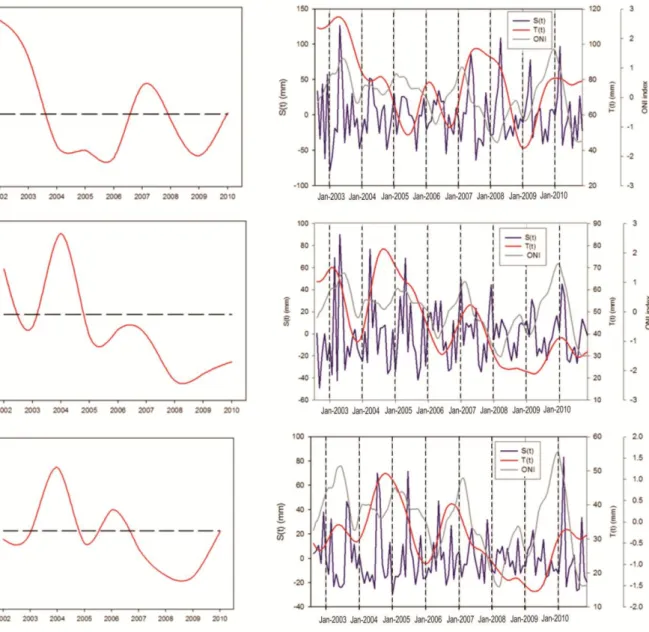
3.3. Inter-Annual Variability of Precipitations and Discharge of the Main Rivers Linked to Enso Events
Air temperature, wind speed and direction, precipitations, and river discharges of Colorado and Negro rivers’ inter-annual variability had been analyzed with regards to El Niño Southern Oscillation phenomenon between 2002 and 2010 [68]. As expected, the only parameters which seem to have significant inter-annual variations and a linkage with ENSO events were the precipitations and the discharge of the rivers. Thus, these parameters were considered for this study.
Maximum precipitations in the Northeast station were registered in 2002 and 2003 (Figure 2), with records 80 and 40% higher than the mean values respectively; meanwhile, in 2005–2006, and in 2008–2009, the precipitation presented a considerable decay (<20%), with minimum rainfall amounts (Figure 11a). Census X-11 analysis indicates high variability in the trend term, with maximum values in 2002, 2003, and 2006, and minimum values between 2007 and 2009. The seasonal term showed that rainfall mainly occurred in autumn and spring. Center station presented maximum precipitations in 2002 and 2004, with values up to 55% higher than the mean annual precipitation (Figure 11b). From 2005, the total precipitation decayed reaching the minimum amounts in 2008 (<50%). The seasonal term had high amplitude between 2002 and 2005, with precipitations occurring mainly in autumn. From 2006, the amplitude of the signal decreased and the rain occurred in summer or early autumn. In
Southwest station maximum precipitations were observed in 2004 and minimum precipitations in 2007 until 2009, with values up to 50% lower than the mean values (Figure 11c).
Figure 11. Precipitation variability between 2002 and 2010. The left column is for the total
annual precipitation (in situ) (red line) and the mean historical precipitation (dashed line). Right column stands for the Census X-11 statistics and the ONI. (a) Northeast station; (b) Center station; and (c) Southwest station.
The Colorado and Negro rivers discharges presented high inter-annual variability (Figure 12). In 2003 there was an increase of 54% and 100% in the discharge of both rivers, respectively. The Colorado River values also increased in 2006 and 2007 compared to the mean values. On the contrary, for the period 2007–2009, the Negro River annual discharges were considerably lower (30%–55%), meanwhile the Colorado River presented, for the period 2008–2009, 65% less discharge. The Colorado River S(t) term indicated that, for the period 2002–2005, the maxima were in spring, though from 2006 maximum discharges were registered in autumn. It is worth highlighting a decay in the amplitude of the signal in 2007–2008. Negro River discharge suffered a change in the seasonality as the maximum
was in summer between 2002 and 2005, in spring between 2006 and 2007 and, finally, in winter after 2008.
Figure 12. Main river causal variability between 2002 and 2010. The left column is for the
total annual discharge (in situ) (grey bars) and the mean historical discharge (dashed line). Right column stands for the Census X-11 statistics and the ONI. (a) Colorado River; and (b) Negro River.
As mentioned before, the climate variability of the Buenos Aires Province is not only explained by the Southern Oscillation, though it has a significant influence on precipitations and main rivers discharge. The El Niño (EN) (2002–2003) and La Niña (LN) (2007–2008) moderate events (ONI 1.3 and −1.5, respectively) clearly affect the rainfall and main river inputs on the studied area, with maximum records of rain and discharges in 2002 and minimum in 2008 (Figure 11–12). The strong events EN 2009 (ONI 1.6) and LN 2010 (ONI −1.6) produced also an increase and decrease of the precipitations and discharge of the rivers, respectively. Conversely, weak events (EN 2004, LN 2006, and EL 2006) seem to have no direct impact on the precipitations and river inter-annual variability over the study area.
4. Discussion
The regionalization based on the coefficient of variability and the previous knowledge of the area determined three regions. The zone 1 representing the near-coastal zone with high values of chlorophyll-a concentration and absorption of phytoplankton (chl-a: 2.6 mg·m−3; aph(443): 1.9 m−1),
suggesting that high biomass of phytoplankton is present all year round, with low coefficients of variation. In this frame, it is important to mention that chl-a estimates in the coastal zone could be
influenced by the high scattering of particulate material. This area is characterized by a shallow slope of the bottom, reaching 15 m depth at 80 km from the coast line [2], which is responsible for the SST high seasonal amplitude, ranging from 23 °C (summer) to 7 °C (winter), with a maximum year amplitude of 15 °C [69]. The coastal zone is highly influenced by the discharge of the rivers, mainly the Negro and Colorado and the plume of the Bahía Blanca Estuary. The rivers of the area provide fresh water, sediments, and nutrients to the system. Colorado River plays also a main role in sediment contribution, providing plumes of high suspended matter concentration up to the mouth of Bahía Blanca Estuary [8]. Though the general mean values observed in the coastal zone indicated that the maximum phytoplankton biomass would be in autumn and winter and that they are driven by the factors mentioned above, some differences between the areas of interest were found.
Zone 1A is mainly influenced by presence of the water plume coming from the Bahía Blanca Estuary (west) during all the year and could be the reason for the high values of all parameters. It is characterized by very warm summer and very cold winter, and high concentrations of suspended matter and nutrients all the year round [70]. SST is thought to be the main driver of the phytoplankton seasonal behavior. In this region maximum estimates of aph(443) and chl-a were found in winter or late
autumn and minimum in summer, in agreement with the dominant seasonal factor of the temperature variability (SST = 8 °C, 10 °C, 22 °C, respectively [69]). There could be an error in the satellite estimation of suspended sediment, since maximum values of bbp(443) were observed in winter and
autumn. On the contrary, it is expected that the turbidity reaches maximum values in spring and summer, when stronger winds blow and maximum significant wave heights are found, producing resuspension and, consequently, an increase of suspended particulate matter (SPM) [71]. Furthermore, in the Bahía Blanca Estuary, maximum (minimum) SPM concentrations were observed during spring (winter) [72], which is expected to influence zone 1A.
In zone 1B the seasonality of the bio-optical parameters is tightly linked with the discharge of the Negro River. Maximum values of aph(443), chl-a, and adg(443) were observed in late-spring/early
summer, as well as in autumn, corresponding to the time of the maximum discharges of the main rivers. Accordingly with our study, Garibotti et al. [73] have observed, from in situ data, that the maximum of the Negro River discharge is related with the maximum phytoplankton abundance in the Anegada Bay. Furthermore, the change in 2009 of the seasonal distribution of the parameters is in agreement with the shift of the periodicity of the Negro River, i.e., maximum discharge and estimates of aph(443), chl-a were observed in winter, instead of summer and autumn.
The entire coastal zone presented seasonality changes from 2009 as well as an increase in the mean values of the IOPs between 20% and 50%, depending of the zone. Phytoplankton is very sensitive to environmental changes, and shifts in cyclical behavior are reported to occur because of changes (such as ENSO events), that modify the climate and meteorological forces, at short and long time scales [74]. The decrease of rainfall in 2007–2008 (La Niña) generated a reduction in the freshwater and nutrients inputs and also an increase in the salinity, which could possibly cause deep changes in phytoplankton community composition [75,76]. This drought produced intense soil losses in the south of Buenos Aires Province, and increases of suspended sediments in the air were reported [77], as well as a strong dust advection from northern Patagonia in 2009 [78]. During that year, Northern Patagonia became one of the most worldwide active dust sources, as a result of poor livestock management and drought conditions [79,80]. The combination of diminution of freshwater inputs, which are source of fresh
water and nutrients and the turbidity variability which influence the light availability, could be the origin of the changes in the optical and physical characteristics of the water affecting, in turn, phytoplankton ecology and the associated bio-optical properties.
The transitional area between zone 1 and 2 overlaps with a coastal front produced by changes in bathymetry and dilution effects [5]. Frontal regions are known for the physicochemical discontinuities that are favorable for the development and survival of nekton larvae. These zones also perform as retention areas, enhancing concentration and production of phytoplankton and zooplankton organisms [81]. The positive bbp(443) linear tendency observed in the frontal area is mainly due to the peak of 2009–2010,
which could be associated to the possible aeolian dust deposition described before. Interestingly, bbp(443)
and Chl-a trends presented the same spatial patterns, which may be due to (i) a fertilization effect caused by nutrient inputs by the presence of an increase concentration of suspended sediment and (ii) to an over-estimation of Chl-a due to the presence of highly-scattering material in the water [82].
In zone 2 (inner-shelf) a variable behavior of every parameter is observed. This area is transitional between the very coastal diluted mixed waters and the stratified mid-shelf waters. This region presents the highest variability in terms of bbp(443), which could be explained by a very variable pool of
particles, and/or by complex physical and biogeochemical processes driving the dynamics of suspended marine particles. Lucas et al. [2] reported that the El Rincón system varies between 10,000 km2 (autumn-winter) and 15,000 km2 (spring-summer), since it is highly influenced by the
dynamics of the main rivers (Negro and Colorado rivers), and during two different La Niña events the spring area only covered 5000 km2. During 2002–2003, when the maximum rivers discharge was
observed, the parameters of the inner shelf presented a similar seasonal behavior of the coastal zone 1B. It is also suggested that the adg(443) maximum in 2003 could be related to the extraordinary
phytoplankton bloom observed in the mid-shelf [83]. Even if the seasonality of the parameters was not clearly defined, the maxima generally occurred in autumn-winter, which might be influenced by the warm and saline San Matías Gulf waters during this season. Similarly to the coastal zone, from 2009, an increase in the seasonal signal was detected with a strong winter maximum.
The limit between zone 2 and zone 3 remarkably corresponds with the position of the thermal front described in Romero et al. [34]. The mid-shelf region (3A) presented a seasonal signal characterized by high absorption values in spring, and minimum values in summer, probably related to the phytoplankton bloom dynamics described by in [34]. These authors associated the spring mid-shelf bloom of El Rincón, to the mid-shelf temperature front that separates coastal to seasonal stratified shelf waters which becomes stronger in spring.
In the mid-shelf, aph(443), chl-a, and adg(443) were in phase through all the period, showing a
strong maximum, in 2003. This maximum was explained by Signorini et al. [83] and Piola et al.[84], who documented that, in November 2003, there was an intrusion of the Malvinas current inside the mid-shelf, between 41°S and 42°S, generating a low temperature and high salinity anomaly. This inshore intrusion produced a peak in phytoplankton growth with chlorophyll-a values higher than 3 mg·m−3, and in some cases over 25 mg·m−3. The physical reasons for these intrusions are still yet unknown, but they are not permanent [84].
In mid-shelf waters there was also a change of seasonality in 2009, presenting an evident decrease of the seasonal trend amplitude. ENSO events produce alterations in main frontal forces such as wind and run-off configurations [85]. In this sense, the alteration of the river discharges that diminished the input
of fresh water to the system could change the hydrological balance, weakening the intensity of the mid-shelf front, since the inner-shelf waters became saltier, reassembling as the mid-shelf waters. As a consequence, the characteristic spring enhanced marine productivity of the mid-shelf front declined.
5. Conclusions
In the present study for the first time the inherent optical properties and chlorophyll-a provided by MODIS-Aqua have been used as proxies of the physical-biological dynamics in the inner-mid shelves of the south of Buenos Aires Province, Argentina. Despite the lack of in situ measurements validating the IOPs and chl-a estimates, the results found in this paper are in concordance with the not so abundant in situ studies settled in the study area. This research is unique as it presents the marine bio-physical characteristics of the complex study area, its temporal variability and their relationship with continental and atmospheric processes, which were unknown until now. The results presented in this paper are a useful basis for future studies concerning marine environmental variables.
Clearly, two mainly different physical and biological behaviors are observed: the coastal and mid-shelf waters. The coastal zone presented winter and autumn maxima of the estimated parameters, driven mainly by SST and the Negro River seasonal cycle. The inner-shelf is a transitional zone which, depending on climate variability and extraordinary events on mid-shelf waters, has a behavior similar to the coastal or to the stratified waters. The mid-shelf waters IOPs and chl-a dynamics are characterized by a high chl-a and aph values in spring, possibly caused by the presence of the thermal
front that separates coastal to seasonal stratified shelf waters which becomes stronger in that season. The linkage between the climate variability and the IOPs as proxies of the biological and physical parameters of the region is remarkable. The strong drought produced by La Niña event in 2007–2009 had a huge impact on the distribution of the parameters in the entire area, since changes in seasonality and a steep increase in annual concentrations had been observed. The climate variability is one of the main factors to consider when understanding long term evolution of the marine system of the study area. Furthermore, special attention should be given to the influence of ENSO, since its magnitude has increased in the last decades and global warming will lead to more extreme events (i.e., [86,87]).
Acknowledgments
This study was possible thanks to the grant provided by EADIC II (ERASMUS MUNDUS Action 2 Lot 13A). This research has been done in the frame of the GlobCoast project (www.foresea.fr/globcoast) which is funded by the French Agence Nationale de la Recherche (ANR 2011 BS56018 01). The GlobCoast project is affiliated to the LOICZ and AQUIMER. We thank also INTA and CERZOS for providing precipitation data and to the Ocean Color group of NASA for the distribution MODIS-Aqua data.
Author Contributions
As part of her PhD thesis, Ana Laura Delgado did the image processing, analyzed of the time series of chl-a, IOPs and climatological variability data, finding the linkage between the variables. Hubert Loisel design the research, guided the methodological part focusing on the analysis of the IOPs and also analyzed the results and discussion. Cédric Jamet guided the MODIS-Aqua imaging processing methods
and contributed with the analysis of the results. Vincent Vantrepotte was responsible of applying the Census X-11 method to the satellite and in situ data. Gerardo Perillo and Cintia Piccolo assisted the team with their knowledge of the oceanographic and climatological conditions of the study area. Ana Laura Delgado and Hubert Loisel prepared the manuscript with contributions of the other authors.
Conflicts of Interest
The authors declare no conflict of interest.
References
1. Piccolo, M.C. Oceanography of the western south Atlantic continental shelf from 33 to 55°S. Coastal segment (S,W). In The Sea; Robinson, A.R., Brink, K.H., Eds.; John Wiley & Sons, Inc: New York, NY, USA, 1998; Volume 11, pp. 253–271.
2. Lucas, A.J.; Guerrero, R.A.; Maizan, H.W.; Acha, E.M.; Lasta, C.A. Coastal oceanographic regimes of the Northern Argentine Contienental Shelf (34–43°S). Estuar. Coast. Shelf Sci. 2005, 65, 405–420.
3. Marrari, M.; Delia Viñas, M.; Martos, P.; Hernández, D. Spatial patterns of mesozooplankton distribution in the Southwestern Atlantic Ocean (34–41°S) during austral spring: relationship with the hydrographic conditions. ICES J. Mar. Sci. 2004, 61, 667–679.
4. Rivas, A.L.; Pisoni, J.P. Identification, characteristics and seasonal evolution of surface thermal fronts in the Argentinean Continental Shelf. J. Mar. Syst. 2009, 79, 134–143.
5. Carroza, C.; Aráoz, N.F.; Pájaro, M. Variado costero y su interacción con especies pelágicas. Informe Asesor. Transf. INIDEP 2009, 2/09, 6.
6. Guerrero, R.A. Oceanografía física del estuario del Río de la Plata y el sistema costero El Rincón. Noviembre 1994. INIDEP Informe Técnico 1998, 21, 29–54.
7. Palma, E.D.; Matano, R.P.; Piola, A.R. A numerical study of the Southwestern Atlantic Shelf circulation: stratified ocean response to local and offshore forcing. J. Geophys. Res. 2008, 113, doi:10.1029/2007JC004720.
8. Cuadrado, D.G.; Piccolo, M.C.; Perillo, G.M.E. Hydrography of the inner shelf offshore Bahia Blanca Estuary, Argentina. Thalassas 2002, 18, 45–56.
9. Aceituno, P. On the functioning of the Southern Oscillation in the South American Sector. Part I: Surface climate. Mon. Weather Rev. 1988, 116, 505–524.
10. Grimm, A.M.; Barros, V.R.; Doyle, M.E. Climate variability in Southern South America associated with El Niño and La Niña events. J. Clim. 2000, 13, 35–58.
11. Lentini, C.A.D.; Podestá, G.G.; Campos, E.J.D.; Olson, D.B. Sea surface temperature anomalies on the Western South Atlantic from 1982 to 1994. Cont. Shelf Res. 2001, 21, 89–112.
12. Severov, D.N.; Mordecki, E.; Pshennikov, V.A. SST anomaly variability in Southwestern Atlantic and El Niño/Southern oscillation. Adv. Space Res. 2004, 33, 343–347.
13. Scian, B.; Labraga, J.C.; Reimers, W.; Frumento, O. Characteristics of large-scale atmospheric circulation related to extreme monthly rainfall anomalies in the Pampa Region, Argentina, under non-ENSO conditions. Theor. Appl. Climatol. 2006, 85, 89–106.
15. Cloern, J.E. Phytoplankton bloom dynamics in coastal ecosystems: A review with some general lessons from sustained investigation of San Francisco Bay, California. Rev. Geophys. 1996, 34, 127–168.
16. Behrenfeld, M.J.; Boss, E.; Siegel, D.A.; Shea, D.M. Carbon-based ocean productivity and phytoplankton physiology from space. Global Biogeochem. Cy. 2005, doi:10.1029/2004GB002299. 17. Bricaud, A.; Claustre, H.; Ras, J.; Oubelkheir, K. Natural variability of phytoplankton absorption
in oceanic waters: Influence of the size structure of algal populations. J. Geophys. Res. 2004, doi:10.1029/2004JC002419.
18. Ciotti, A.M.; Bricaud, A. Retrievals of a size parameter for phytoplankton and spectral light absorption by colored detrital matter from water-leaving radiances at SeaWiFS channels in a continental shelf region off Brazil. Limnol. Oceanogr. Methods 2006, 4, 237–253.
19. Neukermans, G.; Loisel, H.; Mériaux, X.; Astoreca, R; McKee, D. In situ variability of mass-specific beam attenuation and backscattering of marine particles with respect to particle size, density, and composition. Limnol. Oceanogr. 2012, 57, 24–144
20. Arnone, R.A.; Wood, A.M.; Gould, R.W. The evolution of optical water mass classification. Oceanography 2004, 17, 14–15.
21. Stramski, D.; Reynolds, R.A.; Kahru, M.; Mitchell, B.G. Estimation of particulate organic carbon in the ocean from satellite remote sensing. Science 1999, 285, 239–242.
22. Loisel, H.; Bosc, E.; Stramski, D.; Oubelker, K.; Deschamps, P.-Y. Seasonal variability of the backscattering coefficients in the Mediterranean Sea based on Satellite SeaWIFS imagery. Geophys. Res. Lett. 2001, 28, 4203–4206.
23. Loisel, H.; Nicolas, J.M.; Deschamps, P-Y.; Frouin, R. Seasonal and inter-annual variability of the particulate matter in the global ocean. Geophys. Res. Lett. 2002, doi:10.1029/2002GL015948. 24. Siegel, D.A.; Maritorena, S.; Nelson, N.B.; Hansell, D.A.; Lorenzi-Kayser, M. Global distribution
and dynamics of colored dissolved and detrital organic materials. J. Geophys. Res. 2002, doi:10.1029/2001JC000965.
25. Balch, W.M.; Gordon, H.R.; Bowler, B.C.; Drapeau, D.T.; Booth, E.S. Calcium carbonate measurements in the surface global ocean based on Moderate-Resolution Imaging Spectroradiometer data. J. Geophys. Res. 2005, doi:10.1029/2004JC002560.
26. Lee, Z.; Lance, V.P.; Shaoling Shang, S.; Vaillancourt, R.; Freeman, S.; Lubac, B.; Hargreaves, B.R.; Del Castillo, C.; Miller, R.; Twardowski, M.; et al. An assessment of optical properties and primary production derived from remote sensing in the Southern Ocean (SO GasEx). J. Geophys. Res. 2011, doi:10.1029/2010JC006747.
27. Platt, T.; Fuentes-Yaco, C.; Frank, K.T. Spring algal bloom and larval fish survival. Nature 2003, 423, 398–399.
28. Fuentes-Yaco, C.; Koeller, P.A.; Sathyendranath, S.; Platt, T. Shrimp (Pandalus borealis) growth and timing of the spring phytoplankton bloom on the Newfoundland-Labrador Shelf. Fish. Oceanogr. 2007, 16, 116–129.
29. Solanki, H.U.; Dwivedi, R.M.; Nayak, S.R. Application of ocean colour monitor chlorophyll and AVHRR SST for fishery forecast: Preeliminary validation results off Guajara coast, northwest coast of India. Indian J. Mar. Sci. 2001, 30, 132–138.
30. Chen, I.-C.; Lee, P.-F.; Tzeng, W.-N. Distribution of albacore (Thunnus alalunga) in the Indian Ocean and its relation to environmental factors. Fish. Oceanogr. 2005, 14, 71–80.
31. Platt, T.; Hoepffner, N.; Stuart, V.; Brown, C. Why Ocean Colour? The Societal Benefits of Ocean-Colour Technology; Reports of the International Ocean-Colour Coordinating Group No.7; IOCCG: Dartmouth, NS, Canada, 2008.
32. Svendsen, E.; Skogen, M.; Albretsen, J.; Søiland, H.; Hackett, B. ; Pettersson, L.; Johannessen, J.; Lars Petter Røed, L.P. Capacity to Monitor and Model Harmful Algae Blooms, and Feasibility to Produce Assessment Products for Eutrophication; Report on Tasks 5.1 and 5.2 of EU Framework 5 Project MERSEA Strand 1; Nansen Environmental and Remote Sensing Centre: Bergen, Norway, 2004.
33. Gregg, W.W.; Casey, N.W.; McClain, C.R. Recent trends in global ocean chlorophyll. Geophys. Res. Lett. 2005, 32, doi:10.1029/2004GL021808.
34. Romero, S.I.; Piola, A.R.; Charo, M.; Eiras Garcia, C.A. Chlorophyll-a variability off Patagonia based on SeaWiFS data. J. Geophys. Res. 2006, 111, doi:10.1029/2005JC003244.
35. Rivas, A.L.; Dogliotti, A.I.; Gagliardini, D.A. Seasonal variability in the satellite-measured surface chlorophyll in the Patagonian Shelf. Cont. Shelf Res. 2006, 26, 703–720.
36. Brown, C.W.; Podesta, G.P. Remote sensing of coccolitosphore blooms in the western South Atlantic Ocean. Remote Sens. Environ. 1997, 60, 83–91.
37. Garcia, C.A.E.; Sarma, Y.V.B.; Mata, M.M.; Garcia, V.M.T. Chlorophyll variability and eddies in the Brazil-Malvinas Confluence region. Deep Sea Res. Part II 2004, 51, 159–172.
38. Garcia, C.A.E.; Garcia, V.M.T. Variability of chlorophyll-a from ocean color images in the La Plata continental shelf región. Cont. Shelf Res. 2008, 28, 1568–1578.
39. Dogliotti, A.I.; Schloss, I.R.; Almandoz, G.O.; Gagliardini, D.A. Evaluation of SeaWiFS and MODIS chlorophyll-a products in the Argentinean Patagonian continental shelf (38°S–55°S). Int. J. Remote Sens. 2009, 30, 251–273.
40. Lutz, V.A.; Segura, V.; Dogliotti, A.I.; Gagliardini, D.A.; Bianchi, A.A.; Balestrini, C.F. Primary production in the Argentine Sea during spring estimated by field and satellite models. J. Plankton Res. 2010, 32, 181–195.
41. Williams, G.N.; Dogliotti, A.I.; Zaidman, P.; Solis, M.; Narvarte, M.A.; Gonzalez, R.C.; Estevez, J.L.; Gagliardini, D.A. Assessment of remotely-sensed sea-surface temperature and chlorophyll-a concentration in San Matias Gulf (Patagonia, Argentina). Cont. Shelf Res. 2012, 52, 159–171. 42. Dogliotti, A.I.; Lutz, V.A.; Segura, V. Estimation of primary production in the southern Argentine
continental shelf and the shelf break regions using field and remote sensing data. Remote Sens. Environ. 2014, 140, 497–508.
43. Dogliotti, A.I. Estimación de la biomasa fitoplanctónica mediante el sensoramiento remoto del color del mar y datos de campo en la Plataforma Continental Patagónica. Ph.D. Thesis, Universidad de Buenos Aires, Buenos Aires, Argentina, 2007.
44. Lee, Z.; Carder, K.L.; Arnone, R.A. Deriving inherent optical properties from water color: A multiband quasi-analytical algorithm for optically deep waters. Appl. Opt. 2002, 41, 5755–5772. 45. Lee, Z.-P. Remote Sensing of Inherent Optical Properties: Fundamentals, Tests of Algorithms and
Applications; Reports of the International Ocean Colour Coordinating Group No.5; IOCCG: Dartmouth, NS, Canada, 2006.
46. Nechad, B., Ruddick, K. Round Robin—Harmonised Comparison of Algorithms; Version 2.2; Brockman Consult: Hamburg, Germany, 2012.
47. Shang, S.; Dong, Q.; Lee, Z.; Li, Y.; Xie, Y.; Behrenfeld, M. MODIS observed phytoplankton dynamics in the Taiwan Strait: An absorption-based analysis. Biogeosciences 2011, 8, 841–850. 48. Du, C.; Shang, S.; Dong, Q.; Hu, C.; Wu, J. Characteristics of chromophoric dissolved organic
matter in the nearshore waters of western Taiwan Strait. Estuar. Coast. Shelf Sci. 2010, 88, 350–356.
49. Sahay, A.; Chauhan, P.; Nagamani, P.V.; Sanwalani, N.; Dwivedi, R.M. Backscattering of light by coastal waters by using hyperspectral in-situ measurements: A case study off Veraval, Gujarat, India. Indian J. Mar. Sci. 2011, 40, 762–769.
50. Fu, G.; Baith, K.S.; McClain, C.R. SeaDAS: The SeaWiFS data analysis system. In Proceedings of the 4th Pacific Ocean Remote Sensing Conference, Qingdao, China, 28–31 July 1998; pp. 73–79. 51. Gordon, H.R.; Wang, M. Retrieval of water-leaving radiance and aerosol optical thickness over
the oceans with SeaWiFS: A preminilary algorithm. Appl. Opt. 1994, 33, 443–452.
52. Stumpf, R.P.; Arone, R.A.; Gould, R.W.; Ransibrahmanakul, V. A partially coupled ocean-atmosphere model for retrieval of water-leaving radiance from SeaWiFS in coastal waters. In SeaWiFS Postlaunch Technical Report Series Chap.9, NASA/TM-2003-206892; Hooker, S.B., Firestone, E.R., Eds.; NASA Goddard Space Flight Center: Greenbelt, MD, USA, 2003; Volume 22, pp. 51–59.
53. Bailey, S.W.; Franz, B.A.; Werdell, P.J. Estimations of near-infrared water-leaving reflectance for satellite ocean color data processing. Opt. Express 2010, 18, 7521–7527.
54. Jamet, C.; Loisel, H.; Kuchinke, C.P.; Ruddick, K.; Zibordi, G.; Feng, H. Comparison of three SeaWiFS atmospheric correction algorithms for turbid waters using AERONET-OC measurements. Remote Sens. Environ. 2011, 115, 1955–1965.
55. Goyens, C.; Jamet, C.; Schroeder, T. Evaluation of four atmospheric correction algorithms for MODIS-Aqua images over contrasted coastal waters. Remote Sens. Environ. 2013, 131, 63–75. 56. Zibordi, G.; Holben, B.; Hooker, S.B.; Mélin, F.; Berthon, J.-F.; Slutsker, I.; Giles, D.;
Vandemark, D.; Feng, H.; Rutledge K.; et al. A network for standardized ocean color validation measurements. EOS Trans. Am. Geophys. Union 2006, 87, 293–297
57. Zibordi, G.; Mélin, F.; Berthon, J.-F.; Holben, B.; Slutsker, I.; Giles, D.; D’Alimonte, D.; Vandemark, D.; Feng, H.; Schuster, G.; et al. AERONET-OC: A network for the validation of ocean color primary products. J. Atmos. Ocean. Technol. 2009, 26, 1634–1651.
58. Brown, O.B.; Minnet, P.J. MODIS Infrared Sea Surface Temperature Algorithm; Technical Report ATBD25; University of Miami: Coral Gables, FL, USA, 1999.
59. Campbell, J.W.; Blaisdell, J.M.; Darzi, M. Level-3 SeaWiFS data products: Spatial and temporal binning algorithms. In NASA Technical Memorandum 1995-104566; Hooker, S.B., Firestone, E.R., Acker, J.G., Eds.; SeaWiFS Technical Report Series; NASA-GSFC: Greebelt, MD, USA, 1995; Volume 32, p. 73.
60. Antoine, D. Guide to the Creation and Use of Ocean-Colour, Level-3, Binned Data Products; Reports of the International Ocean-Colour Coordinating Group No.4; IOCCG: Dartmouth, NS, Canada, 2004.
62. Vantrepotte, V.; Loisel, H.; Mélin, F.; Desailly, D.; Duforêt-Gaurier, L. Global particulate matter pool temporal variability over the SeaWiFS period (1997–2007). Geophys. Res. Lett. 2011, doi:10.1029/2010GL046167.
63. Vantrepotte, V.; Mélin, F. Temporal variability of 10-year global SeaWiFS time-series of phytoplankton chlorophyll a concentration. ICES J. Mar. Sci. 2009, 66, 1547–1556.
64. Vantrepotte, V.; Mélin, F. Inter-annual variations in the SeaWiFS global chlorophyll-a concentration (1997–2007). Deep Sea Res. Part I 2011, 58, 429–441.
65. Ibanez, F.; Conversi, A. Prediction of missing values and detection of ‘exceptional events’ in a chronological planktonic series: A single algorithm. Ecol. Model. 2002, 154, 9–23.
66. Shiskin, J. Seasonal adjustment of sensitive indicators. In Seasonal Analysis of Economic Time Series; Zeller, A., Ed.; US Department of Commerce, Bureau of the Census: Washington, DC, USA, 1978; pp. 97–103.
67. Gilbert, R.O. Statistical Methods for Environmental Pollution Monitoring; John Wiley: New York, NY, USA, 1987.
68. Delgado, A.L. Estudio integrado ambiental de la plataforma continental interior y media de la zona de El Rincón, Argentina. Ph.D. Thesis, Universidad Nacional del Sur, Bahía Blanca, Argentina, 2013.
69. Delgado, A.L.; Jamet, C.; Loisel, H.; Vantrepotte, V.; Perillo, G.M.E.; Piccolo, M.C. Evaluation of MODIS-Aqua Sea-Surface temperature product in the inner and mid-shelves of southwest Buenos Aires Province, Argentina. Int. J. Remote Sens. 2014, 35, 306–320.
70. Perillo, G.M.E.; Cuadrado, D.G. Nearsurface suspended sediments at Monte Hermoso Beach, Argentina: I. Descriptive characteristics. J. Coast. Res. 1990, 6, 981–990.
71. Delgado, A.L.; Vitale, A.J.; Perillo, G.M.E.; Piccolo, M.C. Preliminary analysis of waves in the coastal zone of Monte Hermoso and Pehuén Co, Argentina. J. Coast. Res. 2013, 28, 843–852. 72. Guinder, V.A.; Popovich, C.A.; Perillo, G.M.E. Particulate suspended matter concentrations in the
Bahía Blanca Estuary, Argentina: Implication for the development of phytoplankton blooms. Estuar. Coast. Shelf Sci. 2009, 85, 157–165.
73. Garibotti, I.A.; Ferrario, M.E.; Almandoz, G.O.; Castanos, C. Seasonal diatom cycle in Anegada Bay, El Rincon estuarine system, Argentina. Diatom Res. 2011, 26, 227–241.
74. Winder, M.; Cloern, J.E. The annual cycles of phytoplankton biomass. Philos. Trans. R. Soc. B
2010, 365, 3215–3226.
75. Popovich, C.A.; Guinder, V.A.; Pettigrosso, R.E. Composition and dynamics of phytoplankton and aloricate ciliate communities in the Bahía Blanca Estuary. In Perspectives on Integrated Coastal Zone Management in South America; Neves, R., Baretta, J., Mateus, M., Eds.; IST Press, Scientific Publishers: Lisboa, Portugal, 2009; pp. 257–272.
76. Guinder, V.A.; Popovich, C.A.; Molinero, J.C.; Perillo, G.M.E. Long-term changes in phytoplankton phenology and community structure in the Bahia Blanca Estuary, Argentina. Mar. Biol. 2010, 157, 2703–2716.
77. Ferrelli, F. La sequia 2008–2009 en el Sudoeste de la provincia de Buenos Aires. Bachelor's Thesis, Universidad Nacional del Sur, Bahía Blanca, Argentina, 2010.
78. Johnson, M.S.; Meskhidze, N.; Kiliyanpilakkil, V.P.; Gasso, S. Understanding the transport of Patagonian dust and its influence on marine biological activity in the South Atlantic Ocean. Atmos. Chem. Phys. 2011, 11, 2487–2502.
79. Geist, H.J.; Lambin, E.F. Dynamic causal patterns of desertification. Bioscience 2004, 54, 817–829. 80. McConnell, J.R.; Aristarain, A.J.; Banta, J.R.; Edwards, P.R.; Simoes, J.C. 20th-Century doubling
in dust achieve in an Antarctic Peninsula ice core parallels climate change and desertification in South America. Proc. Natl. Acad. Sci. USA 2007, 104, 5743–5748.
81. Gabric, A.J.; Cropp, R.; Ayers, G.P.; McTanish, G.; Braddock, R. Coupling between cycles of phytoplankton biomass and aerosol optical depth as derived from SeaWiFS time series in the Subantartic Southern Ocean. Geophys. Res. Lett. 2002, doi:10.1029/2001GL013545.
82. Loisel, H.; Lubac, B.; Dessailly, D.; Duforêt-Gaurier, L.; Vantrepotte, V. Effect of inherent optical properties variability on the chlorophyll retrieval from ocean color remote sensing: An in situ approach. Opt. Express 2010, 18, 20949–20959.
83. Piola, A.R.; Martinez Avellaneda, N.; Guerrero, R.A.; Jardon, F.P.; Palma, E.D.; Romero, S.I. Malvinas-slope water intrusions on the northern Patagonia continental shelf. Ocean. Sci. 2010, 6, 345–359.
84. Signorini, S.R.; Garcia, V.M.T.; Piola, A.R.; Evangelista, H.; Mc-Clain, C.R.; Garcia, C.A.E.; Mata, M.M. Further Studies on the Physical and Biogeochemical Causes for Large Interannual Changes in the Patagonian Shelf Spring-Summer Phytoplankton Bloom Biomass; NASA/TM-2009-214176, 200900836; NASA Goddard Space Flight Center: Greenbelt, MD, USA, Feburary 2009.
85. Acha, E.M.; Mainzan, H.W.; Guerrero, R.A.; Favero, M.; Bava, J. Marine fronts at the continental shelves of austral South America Physical and ecological processes. J. Mar. Syst. 2004, 44, 83–105. 86. Dai, A.; Fung, I.Y.; Del Genio, A.D. Surface observed global land precipitation variations during
1900–88. J. Clim. 1997, 10, 2943–2962.
87. Hansen, J.; Sato M.; Ruedy, R.; Lo, K.; Lea, D.W.; Medina-Elizade, M. Global temperature change. Proc. Natl. Acad. Sci. USA 2006, 103, 14288–14293.
© 2015 by the authors; licensee MDPI, Basel, Switzerland. This article is an open access article distributed under the terms and conditions of the Creative Commons Attribution license (http://creativecommons.org/licenses/by/4.0/).