Open Archive TOULOUSE Archive Ouverte (OATAO)
OATAO is an open access repository that collects the work of Toulouse researchers and
makes it freely available over the web where possible.
This is an author-deposited version published in :
http://oatao.univ-toulouse.fr/
Eprints ID : 11556
To link to this article :
DOI:10.1016/j.jnoncrysol.2014.03.022
URL :
http://dx.doi.org/10.1016/j.jnoncrysol.2014.03.022
To cite this version :
Carponcin, Delphine and Dantras, Eric and Dandurand, Jany and
Aridon, Gwenaëlle and Levallois, Franck and Cadiergues, Laurent
and Lacabanne, Colette Discontinuity of physical properties of
carbon nanotube/polymer composites at the percolation threshold.
(2014) Journal of Non-Crystalline Solids, vol. 392-393 . pp. 19-25.
ISSN 0022-3093
Any correspondance concerning this service should be sent to the repository
administrator:
[email protected]
Discontinuity of physical properties of carbon nanotube/polymer
composites at the percolation threshold
Delphine Carponcin
a, Eric Dantras
a,⁎
, Jany Dandurand
a, Gwenaëlle Aridon
b, Franck Levallois
b,
Laurent Cadiergues
c, Colette Lacabanne
baPhysique des Polymères, CIRIMAT, UMR CNRS 5085, Université Paul Sabatier, 31062 Toulouse Cedex, France bEADS Astrium Satellites, 31 avenue des Cosmonautes, Toulouse 31401, France
cCentre National d'Etudes Spatiales, 18 avenue Edouard Belin, Toulouse 31401, France
a b s t r a c t
Keywords:
Carbon nanotubes; Polymer-matrix composites; Electrical percolation threshold; Glass temperature depression
Evolution of DC conductivity with double-walled carbon nanotube concentration in a polyamide 11 matrix displays the electrical percolation phenomenon. The percolation threshold is observed for this composite at 0.85 wt.%. Thermal, mechanical and dielectric manifestations of the glass transition have been investigated as a function of carbon nanotube content. Thermal and mechanical analyses have shown a depression of the glass transition temperature or its mechanical manifestation at the percolation threshold. Regarding the dielectric modulus, three distinct behaviors (below, at, and above percolation threshold) have been observed. A discussion about the interactions between the polymer matrix and the conductive fillers will be proposed to further the understanding of the discontinuity of physical properties at the percolation threshold.
1. Introduction
In the past decades, introducing fillers in a polymer matrix has been a promising challenge to obtain multifunctional materials. Several routes have been tried for obtaining a conductive behavior: the intro-duction of conductive polymers such as polypyrrole[1,2]or conductive particles such as carbon black[3,4], carbon nanofibers[5], carbon nanotubes[6–10], graphene[11], metallic particles[12], and metallic nanowires[13,14]. Polymer based nanocomposites offer the advantage to keep the mechanical properties of the matrix while acquiring inter-esting conductive properties. With the highest aspect ratio, carbon nanotubes are particularly attractive. Discovered by Iijima[15], CNTs enable the dissipation of electrostatic charges for antistatic applications
[16]at a very low filler concentration. Indeed, the insulator–conductor transition, also called percolation threshold[17], can be reached with this type of particle in a semi-crystalline polymer matrix with less than 1% in weight[18]. This percentage depends mainly on polymer matrix, particle dispersion state and particle apparent aspect ratio
[19]. A lot of work has been devoted to the evolution of the glass transition temperature (Tg) with filler content. Ash has shown a 20 °C
decrease of Tgin poly(methylmethacrylate)/alumina composites[20].
This decrease disappears when the particles are coated, thus making them compatible with the matrix. The influence of interactions between
particle and matrix has been confirmed by Sun[21]and Rittigstein and Torkelson[22]. Saiter has highlighted a confinement effect of polymer chains in the galleries of clay (intercalated nanocomposite) inducing a strong reduction of the cooperativity and of the glass transition temperature of the polymer matrix[23]. By varying on the interactions between different particles and polymers, they have shown that Tgcan
increase, stay stable or decrease with particle concentration. An increase of Tgvalues has also been pointed out in other polymer based
com-posites[24–26]. All these authors agreed on the origin of the Tg
fluctuations: strong interactions between particles and polymer matrix result in a decrease of polymer chain mobility and an increase of glass transition temperature. In contrast, weak interactions enable an increase of free volume accessible by the polymer chains which lead to a decrease of composite Tgvalues. Only several authors
have highlighted a depression (decrease followed by an increase) in their glass transition temperature values. It has only been observed with conductive fillers. Barrau et al.[27]examined on the characteriza-tion of glass transicharacteriza-tion temperature evolucharacteriza-tion in polyepoxy/polypyrrole and polyepoxy/CNTs composites by using thermal and mechanical anal-yses. A depression of Tghas been observed in both systems. Tg
depres-sion is larger for polypyrrole particles: 15 °C instead of 5 °C for composites with CNTs. A 5 °C depression was also observed in a com-posite of polycarbonate/CNTs at the percolation threshold[28]. This phenomenon is still misunderstood; however some explanations have been put forward. The influence of fillers on polymer chain mobility can explain a decrease or an increase in Tgbut considering the shape ⁎ Corresponding author.
E-mail address:[email protected](E. Dantras).
of the Tgdepression (a decrease follows by an increase) at the electrical
percolation threshold, further investigation is required to gain a full understanding of this phenomenon.
A previous work[18]describes the introduction of double-walled carbon nanotubes (DWCNTs) in a semi-crystalline thermoplastic polymer, polyamide 11, by solvent way and by an extrusion process. This polymer matrix has been chosen for its good mechanical prop-erties and its low hydrophilicity (2–3% of water absorption) which implies a good stability of the physical properties whatever environ-mental conditions. The dispersion of the conductive nanofillers have been optimized following the electrical conductivity and a satisfac-tory dispersion has been reached since the value of the electrical percolation threshold has been found as one of the lowest for a semi-crystalline thermoplastic matrix.
In this work, three sets of polyamide 11/DWCNT nanocomposites are studied and the evolution of their glass transition temperature with DWCNT content is followed through thermal measurements. These experiments are completed by dynamic mechanical analysis led on one set of nanocomposite; the evolution of the dielectric modulus with DWCNT concentration is also examined. The influence of the conductive fillers on the polymer physical properties will be explored. 2. Experimental
2.1. Materials and processing
The Polyamide 11 (PA 11) polymer matrix was provided either in granules or in a powder (30 μm) by Arkema (France). The carbon nanotubes were supplied by Marion Technologies (MT) (France) and by the CIRIMAT (Université Paul Sabatier — France). They were synthe-sized by catalytic chemical vapor deposition and are both mainly double-walled (around 80%)[29]. Double-walled carbon nanotubes (DWCNTs) are of key interest because they offer the possibility of functionalizing the outer wall which may ensure the connection with the external environment while retaining the remarkable mechanical and electronic properties of the inner nanotube with the lowest density as possible. For this study, both DWCNTs are used as received without any functionalisation.
Two methods of composite elaboration have been used: the solvent and the extrusion way. For the first one, PA 11 granules are first added in dimethylacetamide (DMAc), previously heated at 160 °C. DWCNTs (from Marion Technologies), dispersed by ultrasound in DMAc, were added in the PA 11-DMAc blend. After precipitation, the mixture is filtrated, water washed and vacuum dried at 160 °C during 12 h to eliminate all solvent residues.
For the second one, a twin screw extruder (Minilab II from Haake) was chosen for dispersing DWCNTs (either from MT or CIRIMAT) in the semi-crystalline thermoplastic matrix. Extrusion parameters were previously optimized to ensure the best dispersion[18]and chosen as follow: 30 rpm as screw rotation speed, 210 °C for the mixing tempera-ture (melting temperatempera-ture of PA 11 + 20 °C[30]), a mixing time of 15 min with screws in a co-rotating configuration. In both cases, nanocomposites were hot pressed at 210 °C in order to realize desired shape for different characterization techniques.
Three sets of composites were then manufactured: PA 11/DWCNT-MT by solvent way (loaded at 0.1, 0.3, 0.7, 1, 1.3, 1.6, 1.8, 2, 3 and 4 wt.%), PA 11/DWCNT-MT by extrusion (loaded at 0.1, 0.3, 0.7, 0.85, 1, 1.3, 1.6, 2, and 4) and PA 11/DWCNT-CIRIMAT (loaded at 0.3, 0.7, 1, 1.3, 1.6, 2 and 4 wt.%).
For each characterization techniques, samples have been manufactured in an appropriate shape and conserved 24 h at ambient temperature. This step allows a physical aging since this last is promoted between Tg(which is comprised between 40 and 50 °C for PA 11) and Tg-50 °C. It
corresponds, in polyamide, to the establishment of a dense hydrogen bonded network. This step is necessary to promote the heat capacity step. This step will be discussed later.
2.2. Standard differential scanning calorimetry (DSC)
Standard DSC measurements were performed using a differential scanning calorimeter (Perkin-Elmer DSC7). The heating rate was 20 °C·min− 1from 20 °C to 210 °C. Sample weight was in the range
of 5 to 10 mg. The glass transition temperature of samples with identical thermal history was defined by the midpoint of the heat capacity step.
2.3. Dynamic mechanical analysis (DMA)
DMA experiments were carried out by a Rheometrics ARES Scientific strain-controlled rheometer in the torsion rectangular mode. The mea-surements were performed in the linear viscoelastic range of compos-ites at a fixed angular frequency (1 rad·s− 1) from −150 to 170 °C
(at 3 °C·min−1). Sample thickness was 1 mm. The dynamic dissipative
modulus G″ was plotted as a function of temperature. The anelastic manifestation of the glass transition temperature Tαwas measured at
the maximum of the G″ peaks.
2.4. Dynamic dielectric spectroscopy (DDS)
DDS measurements were carried out using a Novocontrol broadband spectrometer. The composites were manufactured with a thickness large enough (between 1 and 1.5 mm) for avoiding the alignment of CNTs in the pellet plan. By this way, a homogeneous dispersion of nanofillers in the three space directions was promoted. The measure-ments were done in the frequency range from 10−2to 106Hz on aged
samples. The complex dielectric permittivity was measured in the tem-perature range −150 °C/+150 °C, by steps of 2 °C. The complex dielec-tric permittivity was deduced from impedance measurements. In order to analyze high temperature relaxations, the complex dielectric modulus formalism (M* = ε*−1) is required[31]. For conductivity measurements,
the dynamic complex conductivity σ* is deduced from the complex permittivity ε*:
σ!¼ iωεoε! ð1Þ
where ω is the angular frequency, and εois the permittivity of vacuum.
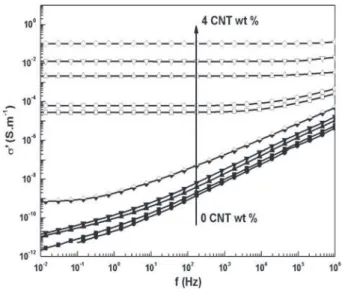
Fig. 1. Frequency dependence of the real part σ′ of the complex conductivity, at 20 °C, for PA 11/CNT nanocomposites with different CNT contents: 0 wt.% (●), 0.1 wt.% (■), 0.3 wt.% (▲), 0.7 wt.% (▼), 0.85 wt.% ( ), 1 wt.% (□), 1.3 wt.% (○), 1.6 wt.% (△), 2 wt.% (▽) and 4 wt.% ( ).
3. Results and discussion
3.1. Isothermal electrical conductivity
The isothermal electrical conductivity of PA 11/DWCNT-MT nano-composites elaborated by extrusion is investigated.Fig. 1shows the fre-quency dependence of the real part, σ′ (ω), of the complex electrical conductivity σ*, for different DWCNT contents, measured at 25 °C. Regarding the neat polymer matrix, its conductivity increases with fre-quency. At 10−2Hz, the electrical conductivity is around 10−11S·m−1
while it reaches 10−6S·m−1at 106Hz. This dependence is
characteris-tic of an insulating material. Composites with 0.1, 0.3 and 0.7 wt.% of CNTs follow the same behavior. From composites loaded at 0.85 wt.%, σ′ (ω) becomes independent of frequency at the lower frequencies of measurement. Above a characteristic onset angular frequency ωc, the
dynamic conductivity follows a power law. This type of behavior was observed in a wide series of disordered solids; it was investigated by Jonscher[32]and later on by Dyre[33]. Consequently, it was designated as the “Universal Dielectric Response” (UDR). It is commonly described by the following equation:
σ0ð Þ ¼ σ 0ω ð Þ þ σACð Þ ¼ σω DCþ Aωs ð2Þ
where σDCis the static conductivity (when ω approaches 0, σ′ is
identified as the dc conductivity), A and s with 0 b s b 1 are only temperature dependent. Eq.(2)can also be written:
σ0ð Þ ¼ σω DC 1 þ ω ωc ! "s # $ ð3Þ with ωc, the critical frequency.
When CNT content increases from 0.85 to 4 wt.%, the dc conductivity σDCincreases as well as the frequency independent region becomes
broader (i.e. ωcincreases). Then, σDCreaches 10− 1S·m− 1i.e. 1011
times higher than the value for neat PA 11. This step is indicative of the establishment of percolation paths. The electronic structure of CNTs[34–36]brings charge carriers that move between localized states of different energy levels accessible by hopping[37]or tunneling[38]. 3.2. Glass transition temperature
DSC measurements have been carried out on PA 11/DWCNT-MT nanocomposites elaborated by extrusion. The corresponding DSC thermograms obtained at the first run on aged samples are depicted
Fig. 2. In the temperature range 30–60 °C, a heat capacity step is point-ed out. It is associatpoint-ed with the glass transition of the amorphous phase of polyamide 11. A weak endothermic peak is superimposed to the heat capacity step and helps to its analysis. It is associated with a breaking of physical bond characteristics of physical aging. The heat capacity step decreases in temperature when DWCNT content increases up to 0.85 wt.%. For the nanocomposite loaded at 1 wt.%, this temperature in-creases and is equivalent to the neat PA 11 one. It stays stable for higher DWCNT concentration. The DSC thermograms obtained at the second run are not displayed here since the endothermic peak is not observable anymore. Between the first and the second run, the kinetic is too fast to allow the complete rebuilding of previous physical bonds. Conse-quently, the heat capacity step becomes unexploitable.
The evolution of the glass transition temperature (Tg) of PA
11/DWCNT-MT composites, as a function of DWCNT weight percent, are plotted inFig. 3. The σDCconductivity corresponding to the σ′
values taken at 10− 2Hz (Fig. 1) are also indicated as reference. For
PA 11/DWCNT-MT elaborated by extrusion, the percolation thresh-old value was found at 0.93 wt.% of DWCNT.
The Tgvalue for neat PA 11 is around 46.5 °C and decreases to 42 °C
for composite with 0.7 wt.% of DWCNTs. Tgstays low for composite till
DWCNT contents of 0.85 wt.%; Tgvalue increases (to 45–46 °C) for
composites with CNT contents higher than 1 wt.%. A sharp depression is observed around 0.85 wt.%, corresponding to the percentage at which the percolating path is created. At the electrical percolation threshold, glass transition temperature of the PA 11/DWCNT compos-ites drops by 4.5 °C. This change is significant since the precision of measurement on Tgis ± 1°. The same temperature depression has
been observed in polyepoxy[27]and in polycarbonate[28]. Neither the nature of the matrix (thermoset or thermoplastic), nor its chemistry (polyamide or polycarbonate) looks to have an influence on the depres-sion value. Dispersed DWCNTs modify the glassy state physical struc-ture until the creation of the percolation path. It appears as a decrease of the glass transition temperature. Such a decrease vanishes upon the establishment of the conductive path.
For evacuating an experimental artifact and confirming the previous result i.e. a depression of the glass transition temperature at the electri-cal percolation threshold, two other sets of composites have been studied: PA 11/DWCNT-MT elaborated by solvent way and PA 11/DWCNT-CIRIMAT elaborated by extrusion. For both, the DC con-ductivity was extracted from the real part of the complex electrical conductivity σ′ (ω) measured at 25 °C and taken at 10−2Hz.
Fig. 2. DSC thermograms of neat PA 11 and PA 11/DWCNT-MT nanocomposites prepared by extrusion loaded at 0.1, 0.3, 0.7, 0.85, 1, 1.3, 1.6, 2 and 4 wt.%. Arrows show the evolution of the glass transition temperature.
Fig. 3. Variation of Tgobtained by DSC for PA 11/DWCNT-MT nanocomposites prepared by
extrusion as a function of CNT weight content (filled square and solid line). The variation of σDCextracted from σ′ at 10−2Hz is indicated as reference (open triangles and dashed line).
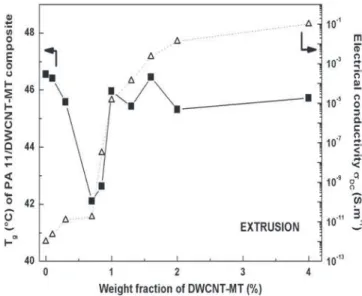
Fig. 4 shows the evolution of the DC conductivity and the glass transition temperature as a function of DWCNT content for PA 11/DWCNT-MT obtained by solvent way. Regarding the electrical conductivity, the eight decade gap between insulator (10−12S·m−1)–
conductor (10−4S·m−1) behaviors highlights the electrical percolation
phenomenon. It appears at 1 wt.% of DWCNTs. However, the conductor path is established over a wide DWCNT percentage range i.e. the in-crease of the conductivity is not abrupt as it is in composites elaborated by extrusion. This is typical of a heterogeneous dispersion where the percolation path is created between CNT clusters and not between CNT themselves. The glass transition temperature of neat PA 11 is equal to 48 °C. It is 1.5 °C above the one represented inFig. 3. It comes from that granules of PA 11 have been used instead of PA 11 powder, employed for both other sets of composite.
The Tgshows a depression for the composite loaded at 1.3 wt.% of
DWCNT. This decrease is around 4.5 °C compared to Tgof neat PA 11.
This result is of the same order of magnitude than the depression observed for PA 11/DWCNT-MT elaborated by extrusion confirming the existence of a Tgdepression at the electrical percolation threshold.
It has to be noticed that the composite loaded at 1 wt.% is characterized by a Tg2 °C higher than neat PA 11. At this concentration, the DC
conductivity is lower than the one of the composite loaded at a lower DWCNT content (i.e. 0.7 wt.%) which reflects a heterogeneous dis-persion of carbon nanotubes as mentioned above. This observation testifies that the Tgvalue of PA 11/DWCNT is in close relationship
with the carbon nanotube space arrangement in the vicinity of the percolation threshold.
PA 11/DWCNT-CIRIMAT nanocomposites elaborated by extrusion have been analyzed by DDS and DSC. The evolution of both DC conductivity and glass transition temperature as a function of DWCNT content is pointed outFig. 5. The electrical conductivity shows an abrupt increase from 10− 12S·m− 1to 10− 1S·m− 1which
is typical of the percolation phenomenon. The percolation threshold is evaluated at 0.6 wt.% of DWCNT. A decrease of the percolation threshold value from 0.93 wt.% (PA 11/DWCNT-MT) to 0.6 wt.% (PA 11/DWCNT-CIRIMAT) is observed depending on the origin of the double-walled carbon nanotubes. Since the same manufacturing process was used for both sets of nanocomposites, the filler disper-sion state is considered as the same. A general relationship between the percolation threshold of various objects and their associated excluded volume has been established by Balberg et al.[19]. In the
isotropic case of randomly distributed long sticks (length L and radius r) the proposed relation is:
L=r
ð Þ fc≈3 ð4Þ
where L/r is the aspect ratio and fc, the critical volume fraction of the
sticks at the percolation threshold. According to Balberg's work, the decrease of the electrical percolation threshold value in case of PA 11/DWCNT composites is attributed to an increase of the DWCNT aspect ratio. For the same CCVD process, CIRIMAT double-walled carbon nanotubes possess a higher aspect ratio than DWCNT from Marion Technologies. DWCNTs from CIRIMAT are manufactured at a laboratory scale while DWCNTs from MT are industrially produced. The PA 11/DWCNT-CIRIMAT composite loaded at 0.7 wt.% shows a Tgvalue of 42.5 °C which is 4 °C lower than neat PA 11 one's. This
composite is situated at the electrical percolation threshold. This result confirms experimentally both the previous ones.
The DWCNT percentage corresponding to the Tgdepression shifts
to lower values at the same time than the value of the electrical per-colation threshold meaning that the observed depression is directly linked to the establishment of the conductive path. Furthermore, the percolation phenomenon is associated with a specific arrangement of the conductive fillers in the matrix. In parallel, a decrease of the glass transition is attributed to a plasticization of the polymer macromole-cules. Consequently, the specific arrangement of the double-walled carbon nanotubes at the percolation threshold induces an increase of the molecular mobility by a rise of the free volume accessible by the polymer chain segments. It results in a decrease of the glass transition temperature at the electrical percolation threshold. Once the percolat-ing path is created, the homogeneous dispersion of the conductive fillers does not disturb anymore the polymer chain segment mobility and the neat polymer Tgrecovers its original value.
DSC experiments have been completed by DMA and DDS analysis led on PA 11/DWCNT-MT composites to follow the evolution of the mechanical and the dielectric manifestation of the glass transition with the DWCNT content.
3.3. Dynamic mechanical relaxation
In order to confirm the results obtained by DSC on PA 11/DWCNT-MT composites, the mechanical manifestation of the glass transition
Fig. 4. Variation of Tgobtained by DSC for PA 11/DWCNT-MT nanocomposites prepared
by solvent way as a function of CNT weight content (filled square and solid line). The variation of σDCextracted from σ′ at 10−2Hz is indicated as reference (open triangles
and dashed line).
Fig. 5. Variation of Tgobtained by DSC for aged PA 11/DWCNT-CIRIMAT nanocomposites
prepared by extrusion as a function of CNT weight content (filled square and solid line). The variation of σDCextracted from σ′ at 10−2Hz is indicated as reference (open triangles
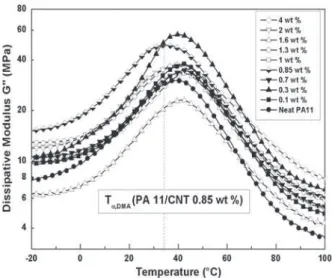
was evaluated using DMA. The dissipative part of the shear modulus G″ of neat PA 11 and PA 11/DWCNT-MT composites was recorded during the first temperature scan (aged samples). It is depicted inFig. 6. The dissipative modulus of neat PA 11 as well as composites highlights a peak which is associated with the anelastic manifestation of the glass transition. In this temperature range, the polymer shifts from a glassy to a rubbery behavior. The temperature characteristic of the peak's maximum is called Tα,DMAand remains constant for all DWCNT
concentration excepted for the composite loaded at 0.85 wt.%.
Fig. 7reports the evolution of the anelastic manifestation of the glass transition temperature (Tα,DMA) obtained on aged sample as a function
of weight fraction of DWCNTs introduced in the polymer matrix. A sharp depression of 5 °C occurs for the composite situated at the electrical percolation threshold i.e. 0.85 wt.% of CNTs, confirming results obtained by DSC. Tα,DMAis quite stable for other composites (around
40 °C). Compared to DSC, no depression is observed for the composite loaded at 0.7 wt.%. Regarding DMA and DSC experiments, the tem-perature range in which the α relaxation on G modulus occurs is
larger than the heat capacity step one. Consequently, it is more difficult to evaluate a sharp change in temperature on TαMdue to the DWCNT
presence than on Tg.
The depression of Tα,DMAis only observed during the first scan, i.e. on
aged sample. The DMA thermograms obtained at the second run are not shown here since Tα,DMAstays constant whatever DWCNT content.
In polyamides, physical aging is due to the establishment of a dense hydrogen bonded network which occurs between Tgand Tg-50 °C i.e. at
room temperature. The first DMA run has been obtained on aged samples. Between the first and the second run, the kinetic is too fast to allow the whole rebuilding of previous physical bonds. This leads to conclude that the specific arrangement of double-walled carbon nanotubes at the percolation threshold acts on the hydrogen bonded network formation constituted upon physical aging.
It is interesting to note that the same temperature depression of Tαis observed with DWCNTs dispersed in amorphous matrix
like epoxy[25]. Furthermore, for conductive fillers with a different morphology (polypyrrole i.e. different aspect ratio and conductivity) introduced in the same matrix, a three times higher depression has been recorded. The characteristics of the conductive fillers might explain the magnitude of this thermal phenomenon at the electrical percolation threshold.
The same phenomenon of Tgdepression (a decrease followed by an
increase) upon percolation phenomena has been observed in inorganic composites[39]. The last system is very different since it is constituted by germanium telluride glasses containing silver particles (always with conductive particles). A 15 °C depression was observed for composite with 5% of silver particles, corresponding to their percolation threshold.
An abrupt increase followed by a decrease of the mechanical compliance appears in Alumina/Nickel composites[40]. A sliding effect between the amorphous ceramic matrix and the metallic particles at their percolation threshold seems to be responsible for this increase. An abrupt variation (sharp depression) in effective magnetic permeability has also been revealed in butadiene-nitrile rubber/iron composites[41]. Large conducting clusters, observable just below the percolation threshold, undergo eddy current due to the variation of the magnetic field. Eddy currents cause the appear-ance of a Joule effect in the composite. Magnetic moments are affect-ed as well as the effective magnetic permeability. These examples show that several phenomena at the electrical percolation threshold are still misunderstood. Establishment of the electrical percolating path is the common factor in these abrupt variations. It shows that a
Fig. 6. Dissipative part of the shear modulus G″ as a function of temperature of neat PA 11 and PA 11/DWCNT-MT nanocomposites prepared by extrusion loaded at 0.1, 0.3, 0.7, 0.85, 1, 1.3, 1.6, 2 and 4 wt.%.
Fig. 7. Variation of the anelastic manifestation of the glass transition Tαobtained by
DMA for PA 11/DWCNT-MT nanocomposites prepared by extrusion as a function of CNT weight content.
Fig. 8. 3D relaxation map of the dielectric modulus obtained by DDS for PA 11/DWCNT nanocomposite prepared by extrusion with 0.3 wt.% of CNTs.
particular interest has to be devoted to the mobility and interactions of charge carriers with the matrix.
3.4. Dynamic electrical relaxation 3.4.1. 3D electrical relaxation map
Fig. 8shows the evolution of the imaginary part of the dielectric modulus as a function of temperature and frequency for a DWCNT concentration lower than pc: 0.3 wt.%. The relaxation map remains
analogous for DWCNT concentration p b pc.The γ relaxation involves
a mobility of the methylene sequences between amide groups. The α relaxation mode (named α,DDS) at Tα,DDSis the dielectric
manifesta-tion of the glass transimanifesta-tion. Above this relaxamanifesta-tion, two peaks appear: the relaxation of the constrained amorphous phase is hidden by a Maxwell–Wagners–Sillars mode[14]inherent to the relaxation of free carriers at the interface of heterogeneities in the material and finally, conductivity.
The conductive composite behavior is different (not depicted here). Above the electrical percolation threshold, a percolating path is created. The charge relaxation is the most prominent phenomenon and hides dipolar relaxations. It appears as an increase of modulus at high frequencies on the 3D relaxation map.
3.4.2. Isothermal electrical modulus
Fig. 9exhibits the evolution of the dielectric modulus at 25 °C for each DWCNT concentration and is extracted from the 3D relaxation map. One peak appears for insulator composites: it corresponds to the dielectric manifestation of the α mode. This peak shifts to higher frequencies when DWCNT concentration increases. The amorphous phase is stiffened by the presence of DWCNTs. For conductive compos-ites, one peak appears as well but at higher frequencies, it is associated with the conductivity phenomenon and highlights a change in the elec-trical behavior of the composite. This peak also shifts to higher frequen-cies with DWCNT concentration. The frequency at which the peak appears depends on the mean distance between conductive clusters (which decreases when DWCNT content decreases), the charge carrier mobility and the temperature. DC conductivity is possible at low fre-quency until the critical frefre-quency ωc(the same as discussed inFig. 1)
is reached. Above this frequency, the period between two successive changes in the electrical field sign is too short to allow charge carrier transport between conductive fillers. At the percolation threshold, i.e. composite loaded at 0.85 wt.%, the electrical modulus shows a particular behavior resulting from the interaction between dipolar relaxation and conductivity.
3.4.3. Dielectric relaxation times
For insulator composites (0.3 and 0.7 DWCNT wt.%) as well as the 0.85 DWCNT wt.% sample, relaxation times have been extracted from the 3D relaxation maps displayed above. For the fitting of each isotherm, the determination of the relaxation time τMis performed using the
Havriliak–Negami equation: M! ¼ M∞−
M∞−M0
1 þ iωτð MÞα
½ (β ð5Þ
where M0 and M∞ are the electrical modulus at null and infinite
frequency respectively and the parameters α and β are such that: 0 b α b 1 and 0 b β b 1.
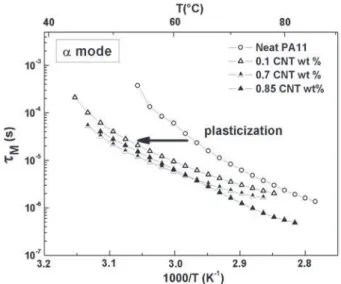
Fig. 10displays the Arrhenius diagrams of the α relaxation mode. It has been used to compare qualitatively the influence of DWCNTs on the molecular mobility of polymer chains.
Relaxation times are well described by a Vogel–Fulcher–Tammann equation. This behavior is characteristic of the α relaxation associated with the glass transition. The relaxation kinetic decreases as soon as 0.1 wt.% of CNTs are dispersed in the polymeric matrix. The relaxation temperature associated with the dielectric manifestation of the glass transition decreases with the introduction of carbon nanotubes which is in total agreement with DSC and DMA observations below the perco-lation threshold i.e. the corresponding shift of the relaxation peak is of the same order of magnitude than the one of Tgand Tα,DMA. Relaxation
temperatures slightly decrease between the various CNT contents from 0.1 to 0.85 wt.%. It is coherent with a plasticization phenomenon for which the macromolecule mobility is modified by the presence of carbon nanotubes. For higher DWCNT concentrations, the nanocom-posites become conductor and cannot be further studied by dynamic dielectric spectroscopy.
4. Conclusion
Thermal, mechanical and electrical analyses have been combined to characterize the percolation phenomenon in PA 11/CNTs composites. The originality of this work is to study a phenomenon related to changes in the polymer physical structure linked to the establishment of a perco-lating path with conductive fillers by different experimental devices. The conductivity of PA 11/CNT composites follows the “Universal Dynamic Response” and these composites are characterized by an electrical percolation threshold at 0.85 wt.% of CNTs. A sharp glass transition temperature depression (5 °C) has been observed by DSC and DMA around this insulator-to-conductor transition. It has been
Fig. 9. Variation of the electrical imaginary modulus at 25 °C, as a function of frequency for PA 11/DWCNT nanocomposites prepared by extrusion with different CNTs contents.
Fig. 10. Arrhenius diagram of the α relaxation mode for PA 11/DWCNT nanocomposites prepared by extrusion with different CNT contents, below the percolation threshold.
confirmed by studying two other sets of PA 11/DWCNT nanocompos-ites which both undergo a depression of this thermal transition at the percolation threshold. Analogous phenomena are observed in other polymer/CNTs composites. It is important to note here that this depression is only observed after physical aging. Consequently, in the PA 11/DWCNT composite, the specific arrangement of the double-walled carbon nanotubes at the electrical percolation thresh-old induces an increase of the hydrogen bonded network molecular mobility by a rise of the free volume accessible by the polymer chain segments. It results in a decrease of the glass transition tem-perature at the electrical percolation threshold. Once the percolating path is created, the homogeneous dispersion of the conductive fillers does not disturb anymore the polymer chain segment mobility and the neat polymer Tgrecovers its original value.
Dynamic dielectric spectroscopy shows three types of behavior for the loss modulus. Below the percolation threshold, the relaxa-tions are governed by the dielectric relaxarelaxa-tions of the polymeric ma-trix. Above the insulator-to-conductor transition, the percolating path is generating charge relaxations. At the percolation threshold, an insulating/conductor hybrid behavior appears showing both previous relaxations.
The dynamic of dielectric PA 11/CNT composites shows a plasticiza-tion of the α relaxaplasticiza-tion mode associated with the glass transiplasticiza-tion. This evolution reflects a plasticization due to a decrease of the hydrogen bond density in the polymeric matrix and is coherent with results obtained by DSC and DMA.
References
[1]C. Maraval, A. Bernes, C. Lacabanne, B. Medda, Cah. Rheol. 16 (1998) 288.
[2]C. Cassignol, M. Cavarero, A. Boudet, A. Ricard, Polymer 40 (1999) 1139.
[3]L. Flandin, T. Prasse, R. Schueler, K. Schulte, W. Bauhofer, J.-Y. Cavaille, Phys. Rev. B 59 (1999) 14349.
[4]S.H. Foulger, J. Appl. Polym. Sci. 72 (1998) 1573.
[5]J. Zhu, S. Wei, A. Yadav, Z. Guo, Polymer 51 (2010) 2643.
[6] S. Barrau, P. Demont, A. Peigney, C. Laurent, C. Lacabanne, Macromolecules 36 (2003) 5187.
[7]Z. Zhou, S. Wang, L. Lu, Y. Z. Y., Compos. Sci. Technol. 67 (2007) 1861.
[8]S.H. Jin, D.K. Choi, D.S. Lee, Colloids Surf. A Physicochem. Eng. Asp. 313–314 (2008) 242.
[9] Y.P. Mamunya, V.V. Levchenko, A. Rybak, G. Boiteux, E.V. Lebedev, J. Ulanski, G. Seytre, J. Non-Cryst. Solids 356 (2010) 635.
[10]R. Socher, B. Krause, R. Boldt, S. Hermasch, R. Wursche, P. Pötschke, Compos. Sci. Technol. 71 (2011) 306.
[11] S.K. Kumar, M. Castro, A. Saiter, L. Delbreilh, J.F. Feller, S. Thomas, Y. Grohens, Mater. Lett. 96 (2013) 109.
[12] H.-P. Xu, Z.-M. Dang, N.-C. Bing, Y.-H. Wu, D.-D. Yang, J. Appl. Phys. 107 (2010) 034105.
[13] A. Lonjon, L. Laffont, P. Demont, E. Dantras, C. Lacabanne, J. Phys. Chem. C 113 (2009) 12002.
[14] A. Lonjon, L. Laffont, E. Dantras, P. Demont, C. Lacabanne, J. Phys. D. Appl. Phys. 43 (2010) 345401.
[15] S. Iijima, Nature 354 (1991) 56.
[16] J.-M. Thomassin, I. Huynen, R. Jerome, C. Detrembleur, Polymer 51 (2010) 115.
[17] G. Stauffer, Introduction to the Percolation Theory, Taylor and Francis, London, 1985.
[18] D. Carponcin, E. Dantras, G. Aridon, F. Levallois, L. Cadiergues, C. Lacabanne, Compos. Sci. Technol. 72 (2012) 515.
[19] I. Balberg, C.H. Anderson, S. Alexander, N. Wagner, Phys. Rev. B 30 (1984) 3933.
[20] B.J. Ash, L.S. Schdler, R.W. Siegel, Mater. Lett. 55 (2002) 83.
[21] Y. Sun, Z. Zhang, K.-S. Moon, C.P. Wong, J. Polym. Sci. B Polym. Phys. 42 (2004) 3849.
[22] P. Rittigstein, J.M. Torkelson, J. Polym. Sci. B Polym. Phys. 44 (2006) 2935.
[23] A. Saiter, D. Prevosto, E. Passaglia, H. Couderc, L. Delbreilh, J.M. Seiter, Phys. Rev. E. 88 (2013) 042605.
[24] Y.-L. Liu, C.-Y. Hsu, W.-L. Wei, R.-J. Jeng, Polymer 44 (2003) 5159.
[25] J.Q. Pham, C.A. Mitchell, J.L. Bahr, J.M. Tour, R. Krishanamoorti, P.F. Green, J. Polym. Sci. B Polym. Phys. 41 (2003) 3339.
[26] J. Choi, S. Yu, S. Yang, M. Cho, Polymer 52 (2011) 5197.
[27] S. Barrau, P. Demont, C. Maraval, A. Bernes, C. Lacabanne, Macromol. Rapid Commun. 26 (2005) 390.
[28] F.Y. Castillo, R. Socher, B. Krause, R. Headrick, B.P. Grady, R. Prada-Silvy, P. Pötschke, Polymer 54 (2011) 3835.
[29] E. Flahaut, R. Bacsa, A. Peigney, C. Laurent, Chem. Commun. 21 (2003) 1443.
[30] B. Krause, P. Pötschke, L. Häubler, Compos. Sci. Technol. 69 (2009) 1505.
[31] M. Wübbenhorst, J.V. Turnhout, J. Non-Cryst. Solids 305 (2002) 40.
[32] A.K. Jonscher, Nature 267 (1977) 673.
[33] J.C. Dyre, T.B. Schrøder, Rev. Mod. Phys. 72 (2000) 873.
[34] R. Saito, M. Fujita, G. Dresselhaus, M.S. Dresselhaus, Appl. Phys. Lett. 60 (1992) 2204.
[35]T.W. Ebbesen, H.J. Lezec, H. Hiura, J.W. Bennett, H.F. Ghaemi, T. Thio, Nature 382 (1996) 54.
[36] J.W.G. Wildöer, L.C. Venema, A.G. Rinzler, R.E. Smalley, C. Dekker, Nature 391 (1998) 59.
[37] A.L. Efros, J. Phys. C Solid State Phys. 9 (1976) 2021.
[38] P. Sheng, Phys. Rev. B 21 (1980) 2180.
[39] K. Ramesh, S. Asokan, K.S. Sangunni, E.S.R. Gopal, Eur. Phys. J. B 6 (1998) 207.
[40] R.C. Cammarata, Thin Solid Films 240 (1994) 82.
[41] L.V. Panina, A.S. Antonov, A.K. Sarychev, V.P. Paramonov, E.V. Timasheva, A.N. Lagarikov, J. Appl. Phys. 76 (1994) 6365