HAL Id: inserm-02197755
https://www.hal.inserm.fr/inserm-02197755
Submitted on 30 Jul 2019
HAL is a multi-disciplinary open access archive for the deposit and dissemination of sci-entific research documents, whether they are pub-lished or not. The documents may come from teaching and research institutions in France or abroad, or from public or private research centers.
L’archive ouverte pluridisciplinaire HAL, est destinée au dépôt et à la diffusion de documents scientifiques de niveau recherche, publiés ou non, émanant des établissements d’enseignement et de recherche français ou étrangers, des laboratoires publics ou privés.
measurement scale: Recommendations for characterizing
DIF with meaningful consequences within the Rasch
model framework
Alexandra Rouquette, Jean-Benoit Hardouin, Alexis Vanhaesebrouck,
Véronique Sébille, Joël Coste
To cite this version:
Alexandra Rouquette, Jean-Benoit Hardouin, Alexis Vanhaesebrouck, Véronique Sébille, Joël Coste. Differential Item Functioning (DIF) in composite health measurement scale: Recommendations for characterizing DIF with meaningful consequences within the Rasch model framework. PLoS ONE, Public Library of Science, 2019, 14 (4), pp.e0215073. �10.1371/journal.pone.0215073�. �inserm-02197755�
Differential Item Functioning (DIF) in
composite health measurement scale:
Recommendations for characterizing DIF with
meaningful consequences within the Rasch
model framework
Alexandra RouquetteID1,2,3*, Jean-Benoit Hardouin4,5, Alexis Vanhaesebrouck1, Ve´ronique Se´bille4,5, Joe¨l Coste3,6
1 AP-HP, Bicêtre Hoˆpitaux Universitaires Paris Sud, Public Health and Epidemiology Department, Le Kremlin-Bicêtre, France, 2 CESP, INSERM, Universite´ Paris-Sud, Universite´ Versailles Saint-Quentin, Universite´ Saclay, Paris, France, 3 EA 4360—APEMAC, Universite´ de Lorraine, Universite´ Paris-Descartes, Paris, France, 4 INSERM U1246 –SPHERE « MethodS in Patients-centered outcomes and HEalth REsearch », University of Nantes, University of Tours, Nantes, France, 5 Biostatistics and Methodology Unit, CHU de Nantes, Nantes, France, 6 AP-HP, Hoˆtel-Dieu Hospital, Biostatistics and Epidemiology Department, Paris, France
Abstract
Objective
The aims were to review practices concerning Differential Item Functioning (DIF) detection in composite measurement scales, particularly those used in health research, and to provide guidance on how to proceed if statistically significant DIF is detected.
Methods
This work specifically addressed the Rasch model which is the subject of growing interest in the field of health owing to its particularly advantageous properties. There were three steps: 1) Literature review to describe current practices; 2) Simulation study to determine under which conditions encountered in health research studies can erroneous conclusions be drawn from group comparisons when a scale is affected by DIF but which is not considered; 3) Based on steps 1 and 2, formulation of recommendations that were subsequently reviewed by leading internationally recognized experts.
Results
Four key recommendations were formulated to help researchers to determine whether sta-tistically significant DIF is meaningful in practice, according to the kind of DIF (uniform or non-uniform) and the DIF effect size.
a1111111111 a1111111111 a1111111111 a1111111111 a1111111111 OPEN ACCESS
Citation: Rouquette A, Hardouin J-B,
Vanhaesebrouck A, Se´bille V, Coste J (2019) Differential Item Functioning (DIF) in composite health measurement scale: Recommendations for characterizing DIF with meaningful consequences within the Rasch model framework. PLoS ONE 14 (4): e0215073.https://doi.org/10.1371/journal. pone.0215073
Editor: Karl Bang Christensen, University of
Copenhagen, DENMARK
Received: November 11, 2018 Accepted: March 26, 2019 Published: April 9, 2019
Copyright:© 2019 Rouquette et al. This is an open access article distributed under the terms of the
Creative Commons Attribution License, which permits unrestricted use, distribution, and reproduction in any medium, provided the original author and source are credited.
Data Availability Statement: All relevant data are
within the manuscript and its Supporting Information files.
Funding: The authors received no specific funding
for this work.
Competing interests: The authors have declared
Conclusion
This work provides the first recommendations on how to deal in practice with the presence of DIF in composite measurement scales used in health research studies.
1. Introduction
Other than some purely descriptive studies, almost all health research studies include group comparisons: typical study designs involve a primary outcome measured in every subject, whose occurrence (if categorical) or mean (if continuous) is compared between groups defined by a characteristic or exposure of interest. More complex designs require multivariate analyses or subgroup analyses. To be accurate, the measurement of the outcome must be valid in all groups studied. Otherwise, the difference (or the absence of difference) observed between groups may be, partly or totally, an artifact due to the measurement instrument not being valid in one or several groups. Accurate group comparisons require measurement invariance: “the measuring device should function in the same way across varied conditions, so long as those varied conditions are irrelevant to the attribute being measured” [1].
Composite measurement scales are used in epidemiological studies to measure complex health related constructs, including quality of life, depression and satisfaction with care. They consist of items that assess the various dimensions of the construct to be measured. Several standards and guidelines have been published concerning their validation and measurement invariance is considered to be essential [2–6]. Statistical methods for assessing measurement invariance rely, directly or indirectly, on the “matching principle” [7]. Measurement invari-ance holds if two subjects being identical (thus “matched”) on the measured construct but from two different groups (males and females, for example) have the same probability of giving any particular answer to any item of the scale [1,8]. Classical statistical methods, termed “observed variable methods”, use the total score (sum of the responses to the items of the dimension studied) as a proxy for the position of the subjects on the measured construct and thus, as the matching variable. Then, logistic regression, for example, is used to model the probability of the response to a binary item as a function of the group membership and of the matching variable [9]. If the regression coefficient related to the group membership is statisti-cally significant, the probability of responding positively to this item is significantly different between the groups whatever the level on the measured construct. This phenomenon is termed differential item functioning (DIF): the item “functions” differently in the groups to be com-pared [8,10]. Two kinds of DIF can be distinguished: uniform if the relation between the group and the response to the item is identical at every level of the matching variable; other-wise DIF is non-uniform [8]. If DIF, uniform or non-uniform, is present in a scale, measure-ment invariance does not hold and group comparisons may be inaccurate.
Other observed variable methods to detect DIF have been developed (Mantel-Haenszel method, standardization method, etc.) but have drawbacks, particularly the use of a proxy as the matching variable, motivating the development of more modern DIF detection methods [1,11–13]. Measurement invariance can be examined through item response theory (IRT) or confirmatory factor analysis (CFA) in which latent variables are used to represent the con-struct to be measured: there is DIF if one or several parameters of the function relating the latent variable to the observations (responses to the scale items) are different across the groups compared [14]. Latent or observed variable methods to detect DIF all involve statistical tests, whose results are strongly influenced by sample size. With sufficiently large samples, DIF
would be detected in all items of all scales [14]. Thus, rather than “Is there DIF in the scale?” the pertinent question is: “In what conditions does statistically significant DIF have significant consequences on the conclusions drawn from group comparison?”.
The Rasch model is often used to analyze questionnaire data in health research studies [15]. It expresses the probability that an individual will respond positively to a binary item as a func-tion of his/her level on the latent variable (termed latent trait) and of an item parameter [16,17]. The Rasch model (and its extensions for polytomous items) is more convenient than more complex IRT models, to detect DIF because it allows studying the variations of the item parameter across groups without influence from additional parameters (discrimination parameter, guessing parameter, etc.). Also, it provides a straightforward DIF effect-size: the group difference in the item parameter [1]. This DIF effect-size can be used to characterize the magnitude of significant DIF within a scale: for example, a group difference in the item param-eter higher than 0.5 logit is often used as a criterion for a meaningful DIF [12,18].
The purpose of this paper was to review practices concerning DIF detection and handling in composite measurement scales used in health research studies and to provide guidance on how to proceed when DIF is statistically significant. We focused on the Rasch model which is the subject of growing interest in the field of health owing to its particularly advantageous properties. As theoretical background on meaningfulness of consequences of DIF is scarce in literature, this work was designed to gather information from various sources. It included three steps:
1. Literature review: description of current practices in health research studies concerning detection and handling of DIF in a scale, with a particular attention to the use of Rasch models in this context to bring out typical scenarios studied within the Rasch framework; 2. Simulation study: results from the literature review were used to enrich a recently published
simulation study aiming to determine the conditions in which erroneous conclusions may be drawn from group comparisons in health research studies, when DIF is present within a scale [19];
3. Recommendations formulation: the literature review and simulation study were exploited to establish recommendations that were then reviewed by a panel of experts.
2. Literature review
2.1. Objectives
To describe current practice in health research studies to detect and handle DIF in a scale, with particular focus on the Rasch framework.
2.2. Methods
Articles written in English and published between November 11, 2013 and November 10, 2014 were selected from Medline using the following query to search title, abstract and keyword fields: (“differential item functioning” or “item bias” or “measurement invariance” or “factorial invariance” or “measurement equivalence”). The Medline database was chosen as the most
appropriate to describe current practices in health research studies and the time frame restricted to one year as the number of published articles allowed the whole of known DIF detection methods to be covered. As we focused on current practices, only articles describing empirical studies in which measurement invariance of composite measurement scale(s) was evaluated were included (reviews and editorials not included, as well as studies concerning
item banks and not scales). Articles were excluded if DIF was only evaluated across collection times (longitudinal DIF).
The DIF detection method used and the research field (education, psychology and psychia-try, quality of life, medical disciplines) to which the scale was related were recorded for each article. Characteristics of the scales studied (number of dimensions, items and response cate-gories per item) and practices for DIF assessment in articles using IRT for DIF detection were identified: the stated study aim, characteristic(s) determining the groups considered for DIF and sample size. Practices for DIF assessment included: assessment of non-uniform DIF, use of criteria based on DIF effect-size to classify statistically significant DIF as meaningful or not, empirical evaluation of the impact of the presence of DIF within the scale, practices and/or rec-ommendations produced by authors on how to handle DIF detected.
Two of the investigators (AV and AR) did the data extraction and literature analysis: AV extracted all the data and AR checked studies in which IRT-based methods were used or in which data extraction was considered challenging by AV. All disagreements were resolved by discussion between AV and AR. Descriptive analysis was performed for quantitative data and qualitative content analysis was performed for studies with statistically significant DIF to reveal the methods employed to evaluate the impact of DIF and the practices and/or recommenda-tions for its management.
2.3. Results
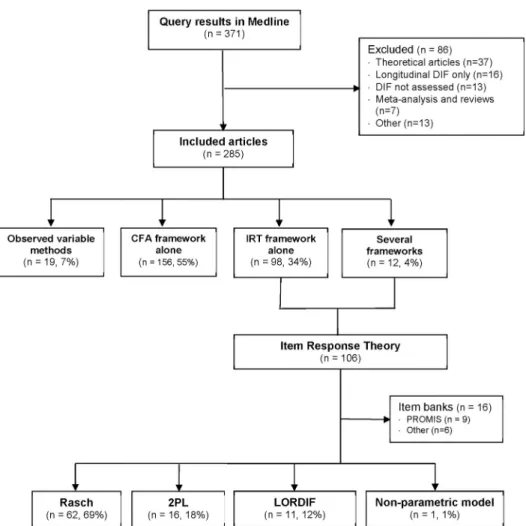
2.3.1. Frameworks and scale domains in studies with DIF assessment. A total of 285
articles met the inclusion criteria (Fig 1andS1 List). In 156 (55%) articles, measurement invariance was assessed within the CFA framework only, in 98 (34%) it was assessed within the IRT framework only, and in 19 (7%) articles only observed variable methods were used (12 logistic regression, 4 Mantel-Haenszel, 3 others). In the remaining 12 (4%) articles, several frameworks were used: both CFA and IRT frameworks in six, and observed variable methods plus CFA or IRT frameworks in six. The research field most frequently studied was “psychol-ogy and psychiatry” (n = 172, 60%) followed by “medical disciplines” (n = 60, 21%), “quality of life” (n = 35, 12%) and “education” (n = 18, 6%). The CFA framework was the most widely used in the “psychology and psychiatry” field (n = 126, 73%), the IRT framework was more fre-quent in “quality of life” (n = 20, 57%) and “medical disciplines” fields (n = 36, 60%). IRT (n = 7, 39%) and CFA (n = 8, 44%) frameworks were similarly used in the “education” field.
2.3.2. Description of studies using the Rasch framework. Within articles using an IRT
framework, 16 were excluded from further analysis as DIF was assessed in items from item banks and not in composite measurement scales (Fig 1). The aims of the other 90 studies were: development of a new scale (n = 17, 19%), evaluation of the psychometric properties of an existing scale (n = 61, 68%), cross-cultural adaptation (n = 7, 8%) and epidemiological study in which the scale was used to measure the outcome (n = 5, 6%). Rasch framework models were used the most (n = 62, 69%) followed by the two-parameter logistic model and its extensions for polytomous items (2PL, n = 16, 18%). In 11 (12%) articles, the DIF detection method com-bined logistic ordinal regression with IRT estimates of the latent trait as matching variable (LORDIF: Logistic Ordinal Regression Differential Item Functioning using IRT [20–22]). The median number of characteristics determining the groups considered for DIF in the same study was two (1st-3rdquartiles: 1–4), and the maximum was nine. Sex (n = 59, 66%) and age (n = 53, 59%) were the most studied, followed by culture, country or ethnicity (n = 18, 20%) and education (n = 12, 13%).
Thirty-four (49%) of the 70 scales studied in the 62 articles using Rasch framework models were multidimensional, and within a dimension, the median number of items was nine (1st
-3rdquartiles: 6–15). The median number of dimensions in multidimensional scales was four (1st-3rdquartiles: 2–5). Items were polytomous in 60 (86%) scales with a median number of response categories of five (1st-3rdquartiles: 4–5).Table 1summarizes practices concerning DIF assessment using the three main methods (Rasch, 2PL, LORDIF). The sample size was Fig 1. Flowchart of the selection of articles reporting detection of Differential Item Functioning (DIF). DIF:
Differential Item Functioning, CFA: Confirmatory Factorial Analysis, IRT: Item Response Theory, PROMIS: Patient Reported Outcomes Measurement Information System, 2PL: Two Parameters Logistic model, LORDIF: Logistic Ordinal Regression Differential Item Functioning using IRT [20].
https://doi.org/10.1371/journal.pone.0215073.g001
Table 1. Practices related to the Differential Item Functioning (DIF) detection and results within the item response theory framework.
Rasch 62 articles 2PL 16 articles LORDIF 11 articles Sample size� 300 (166–610) 964 (762–2429) 1082 (573–2520)
Non-uniform DIF assessed, n (%) 13 (21%) 4 (25%) 7 (63%) Use of DIF effect-size, n (%) 18 (30%) 3 (19%) 9 (82%) Statistically significant DIF detected, n (%) 49 (79%) 14 (88%) 8 (73%)
�Median (1st
quartile– 3rdquartile), 2PL: two parameters logistic, LORDIF: Logistic Ordinal Regression Differential Item Functioning using Item Response Theory [20]
generally smaller for Rasch (median = 300, 1st-3rdquartiles: 166–610) than the other two (med-ian>950) methods. Non-uniform DIF was assessed in fewer than a quarter of the studies using the Rasch framework or the 2PL model whereas it was assessed in most articles using the LOR-DIF method (n = 7, 63%). Criteria based on LOR-DIF effect-size were used in fewer than one third of articles using the Rasch framework (n = 18, 30%) and various thresholds were used to con-sider DIF as meaningful: group difference in item parameter higher than 0.43 logit (n = 2) or 0.5 logit (n = 12) or 0.64 logit (n = 1) or 1 logit (n = 2). DIF effect-size criteria were used in most articles using LORDIF methods (n = 9, 82%, mostly based on change of the logistic regression parameter or pseudo R2between two nested models) but in fewer of the articles using 2PL models (n = 3, 19%).
Most studies concluded that DIF was present within the scale: 49 (79%) articles in the Rasch subgroup, 14 (87%) articles in the 2PL subgroup and eight (73%) articles in the LORDIF subgroup. In 18 (25%) of these 71 articles, the impact of the DIF was evaluated empirically and was considered to be meaningful in only four (22%) articles (S1 Table). Modifications to the scale or recommendations for its use in practice were suggested by the authors in 26 (37%) of the articles in which statistically significant DIF was found.
3. Simulation study
3.1. Objective
To determine the conditions in which erroneous conclusions may be drawn from group com-parisons due to DIF within a scale in health research studies.
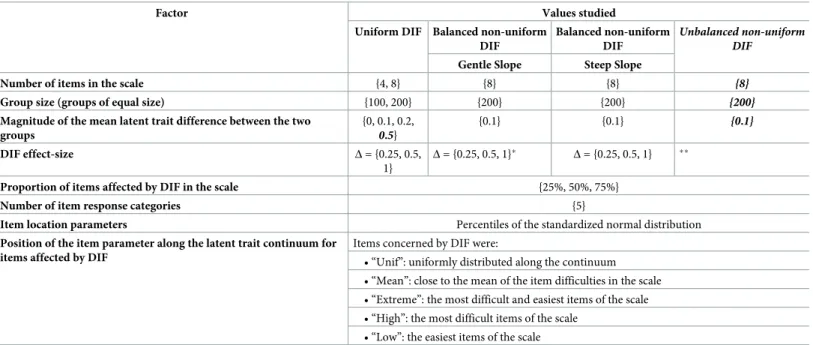
The methods and results described below are from a published study in which 632 realistic scenarios encountered in health research studies were simulated [19]. These scenarios are all based on a typical study which aims to detect a difference between two groups on a construct measured on a latent trait using a composite measurement scale. Factors (characteristics of the sample, of the scale and of items exhibiting DIF) which can be manipulated in the simulation model are described inTable 2. Their effect on the breadth of the bias resulting from the esti-mation of the difference between the two groups with no consideration of the presence of DIF in the scale was studied. For the study we describe here, 90 scenarios were added following the literature review which revealed that various commonly encountered scenarios had not been investigated in the previous study.
3.2. Methods
Datasets were generated using a partial credit model, a model for polytomous data that shares the statistical properties of the Rasch model and defines k item location parameters for items with k+1 response categories [23]. Like binary items, DIF effect-size is defined as the group dif-ference in the item location parameter. Thus, in this model, the DIF size may vary from one category to another within the same item and thereby cause non-uniform DIF; DIF is uniform if and only if its size is identical across all the categories of the same item.
Factor values conforming to the conditions encountered in health research studies were selected (Table 2): small numbers of items in scales (4 or 8 items) with five response categories, small group size (100 or 200 with groups of equal size), and a magnitude of the mean latent trait difference between the two groups of 0 (no difference) to 0.5 standard deviation (Gaussian distribution of the simulated latent trait in both groups, with a variance equal to 1). The three factors related to the presence of DIF in the scale were: DIF effect size, proportion of items in the scale affected by DIF (25%, 50% or 75%) and the position of the item parameter along the latent trait continuum for items affected by DIF (five different distributions along the latent trait continuum). The model used to generate data is described elsewhere [19].
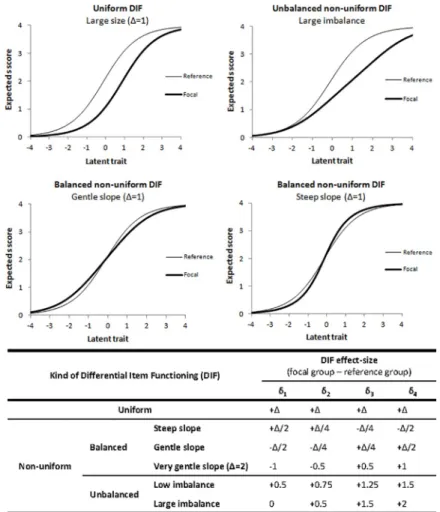
Four kinds of DIF were simulated using the DIF effect-size factor (Fig 2):
• Uniform DIF: the relation between the group and the response to the item is identical at every level of the latent trait, i.e. item characteristics curves for the two groups are parallel (upper-left corner ofFig 2). To generate data with uniform DIF, the DIF affecting the four item location parameters within the same item was set to be of equal size. Three sizes of uni-form DIF were studied: 0.25, 0.5 and 1 logit and the item was more difficult in the focal group.
• Balanced non-uniform DIF: the relation between the group and the response depends on the level of the latent trait but the overall item difficulty is identical in the two groups. To gener-ate data with balanced non-uniform DIF, the DIF was set to be unequal for the four item location parameters but the sum of the DIF sizes was zero, such that the item characteristic curves crossed at the latent trait level equal to zero (bottom ofFig 2). Three sizes were ini-tially studied for both kinds of balanced non-uniform DIF, i.e. gentle slope (the slope of the item characteristic curve was gentler in the focal group) and steep slope. A fourth size for the gentle slope case was then added to the analysis: very gentle slope (Fig 2).
• Balanced non-uniform DIF with steep slope: the slope of the item characteristic curve was steeper in the focal group (bottom-right corner ofFig 2)
• Balanced non-uniform DIF with gentle slope: the slope of the item characteristic curve was gentler in the focal group (bottom-left corner ofFig 2)
• We also studied unbalanced non-uniform DIF in which the overall item difficulty in the focal group was higher than in the reference group as the sum of the DIF sizes affecting the four location parameters was positive. Two sizes of unbalanced non-uniform DIF were used Table 2. Factors manipulated in the simulation study and values studied in the four kinds of Differential Item Functioning (DIF).
Factor Values studied
Uniform DIF Balanced non-uniform DIF
Balanced non-uniform DIF
Unbalanced non-uniform DIF
Gentle Slope Steep Slope
Number of items in the scale {4, 8} {8} {8} {8}
Group size (groups of equal size) {100, 200} {200} {200} {200}
Magnitude of the mean latent trait difference between the two groups {0, 0.1, 0.2, 0.5} {0.1} {0.1} {0.1} DIF effect-size Δ = {0.25, 0.5, 1} Δ = {0.25, 0.5, 1}� Δ = {0.25, 0.5, 1} ��
Proportion of items affected by DIF in the scale {25%, 50%, 75%}
Number of item response categories {5}
Item location parameters Percentiles of the standardized normal distribution
Position of the item parameter along the latent trait continuum for items affected by DIF
Items concerned by DIF were:
• “Unif”: uniformly distributed along the continuum • “Mean”: close to the mean of the item difficulties in the scale • “Extreme”: the most difficult and easiest items of the scale • “High”: the most difficult items of the scale
• “Low”: the easiest items of the scale In bold and italics, values added for the scenarios added in the current work
�Very gentle slope as defined inFig 2was added in the current work
��small and large imbalance as defined in theFig 2were added in the current work
to generate data: low unbalanced and large unbalanced (overall item difficulty in the focal group higher than in the low unbalanced case,Fig 2).
A latent regression partial credit model was applied to each of the 500 datasets generated for each scenario to estimate differences between groups without taking into account the pres-ence of DIF. Themeasurement bias due to DIF was estimated as the delta between this
esti-mated difference and the value of the mean latent trait difference between the two groups used to generate data (the “true” difference between groups). Four multivariate models of analysis of variance (ANOVA), one for each kind of DIF studied, were used to investigate the effects on themeasurement bias of each factor manipulated in the simulation model. However, the
num-ber of simulations studied by ANOVA was huge, so a benchmark was set to distinguish between negligible and non-negligible statistically significant factor effects. To do this, the same analyses were performed on the 500 datasets generated for each of the 12 scenarios resulting from the combination of the three factors not related to DIF (number of items in the scale, group size and a magnitude of the mean latent trait difference between the two groups), with all factors related to DIF set to zero; the resulting delta between the estimated and the “true” difference between the two groups was termedrandom error instead of measurement
Fig 2. Item characteristic curves in the reference and focal groups and Differential Item Functioning (DIF) effect-size used in the simulation model for the four kinds of DIF.δi: item location parameter for the item category i,Δ =
{0.25, 0.5, 1}, the latent trait scale on the X-axis is given in logits.
bias as there was no source of DIF-related bias in the simulation model. The maximum of the
meanrandom error over these 12 scenarios was used as the benchmark.
The effect of the three factors not related to DIF was studied in the case of uniform DIF and was found to be negligible. To facilitate the simulation study, it was decided to investigate each kind of non-uniform DIF with the number of items in the scale set at 8, the group size set at 200 and the magnitude of the mean latent trait difference between the two groups set at 0.1 logit (Table 2). Larger mean latent trait differences between the two groups were investigated because values studied in the previous work were small (0, 0.1 and 0.2). The minimal clinically important difference in a measurement scale is in some cases suggested to be half a standard deviation of the score, so we investigated the effect of this factor being 0.5 [24].The effect of the three DIF-related factors and their interactions were studied in each kind of DIF. Stata soft-ware was used for data generation and statistical analyses [25].
3.3. Results
In simulations without DIF, meanrandom error over the 500 datasets generated for each of the
12 combinations was never higher than 0.013 logit and was not affected by any of the three fac-tors manipulated. In the following analyses, a factor was considered to have a non-negligible effect onmeasurement bias if its estimated coefficient was statistically significant and higher
than 0.015 logit; it was considered to have a major effect if its estimated coefficient was higher than 0.1 logit, i.e. half of a small effect-size as defined by Cohen [26].
Although the estimated ANOVA coefficients of the effects of the three factors not related to DIF (number of items in the scale, group size and a magnitude of the mean latent trait differ-ence between the two groups) were significant (p<0.001) they were lower than 0.015 logit in the case of uniform DIF; they were thus considered to be negligible. When the mean latent trait difference between the two groups was set at 0.5 logit, the associated estimated coefficient was significant (p<0.001) but at -0.022 logit (standard error = 0.001) thus <0.1 logit: its effect was therefore classified as small.
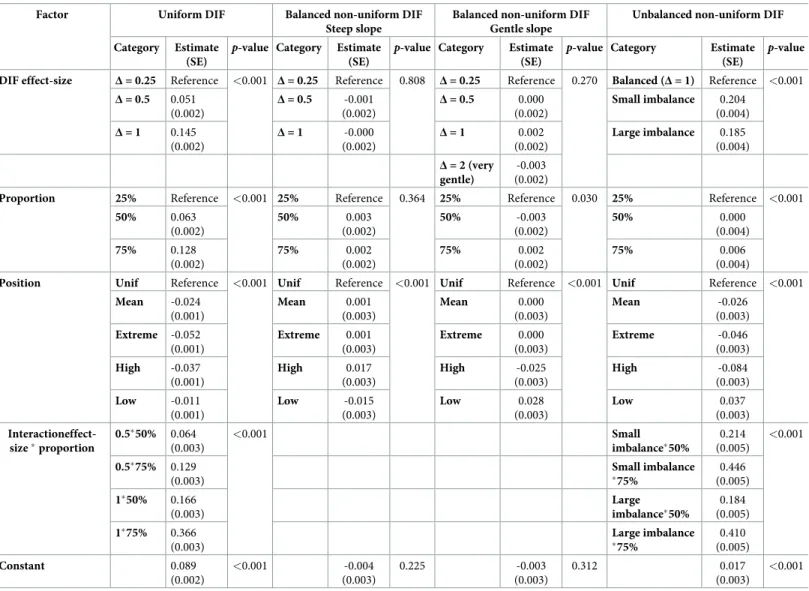
Multivariate ANOVA results for the three factors related to DIF for each kind of DIF are shown inTable 3. For uniform DIF, DIF effect-size, proportion of items in the scale affected by DIF and particularly the interaction between these two factors all had major effects. The effect of the position of the item parameter along the latent trait continuum for items affected by DIF onmeasurement bias was significant but not large. No DIF-related factor was found to
be associated withmeasurement bias in either case of balanced non-uniform DIF. For
unbal-anced non-uniform DIF, the DIF effect-size and its interaction with the proportion factor had large effects onmeasurement bias, as for uniform DIF. The position factor was found to be
associated but its effect was not large.
To summarize, the three factors not related to DIF (number of items in the scale, group size and magnitude of the mean latent trait difference between groups) were found to have negligi-ble effects onmeasurement bias. Also, in both cases of balanced non-uniform DIF, every factor
studied had a negligible effect. However, when DIF was uniform or unbalanced non-uniform, DIF effect-size, proportion of items in the scale affected by DIF and particularly the interaction between these two factors all had major effects onmeasurement bias.
4. Recommendations reviewed by leading experts
4.1. Objective and target users
We found that there is an issue with how to handle statistically significant DIF in the Rasch framework in composite measurement scales, as used in health research studies. We therefore developed recommendations for methodologists and clinicians involved in the design of new
composite measurement scales within this framework or using it in their health-related studies.
4.2. Methods
The first draft of the recommendations was established by AR, JBH, AV and JC (biostatisti-cians expert in psychometrics methods: AR, JBH, JC, and epidemiologists using composite measurement scales in research: AR, JBH, AV, JC or clinical practice: JC) using information from the literature review and the simulation study. In preparation for the review, the
Appraisal of Guidelines REsearch Evaluation (AGREE) instrument, not intended for non-clin-ical context, was adapted to the evaluation of these recommendations (S2 Table) [27]. VS Table 3. Results of the multivariate analysis of variance of the measurement bias for the four kinds of Differential Item Functioning (DIF) studied.
Factor Uniform DIF Balanced non-uniform DIF
Steep slope
Balanced non-uniform DIF Gentle slope
Unbalanced non-uniform DIF Category Estimate
(SE)
p-value Category Estimate (SE)
p-value Category Estimate (SE)
p-value Category Estimate (SE)
p-value DIF effect-size Δ = 0.25 Reference <0.001 Δ = 0.25 Reference 0.808 Δ = 0.25 Reference 0.270 Balanced (Δ = 1) Reference <0.001
Δ = 0.5 0.051 (0.002) Δ = 0.5 -0.001 (0.002) Δ = 0.5 0.000 (0.002) Small imbalance 0.204 (0.004) Δ = 1 0.145 (0.002) Δ = 1 -0.000 (0.002) Δ = 1 0.002 (0.002) Large imbalance 0.185 (0.004) Δ = 2 (very gentle) -0.003 (0.002)
Proportion 25% Reference <0.001 25% Reference 0.364 25% Reference 0.030 25% Reference <0.001
50% 0.063 (0.002) 50% 0.003 (0.002) 50% -0.003 (0.002) 50% 0.000 (0.004) 75% 0.128 (0.002) 75% 0.002 (0.002) 75% 0.002 (0.002) 75% 0.006 (0.004)
Position Unif Reference <0.001 Unif Reference <0.001 Unif Reference <0.001 Unif Reference <0.001
Mean -0.024 (0.001) Mean 0.001 (0.003) Mean 0.000 (0.003) Mean -0.026 (0.003) Extreme -0.052 (0.001) Extreme 0.001 (0.003) Extreme 0.000 (0.003) Extreme -0.046 (0.003) High -0.037 (0.001) High 0.017 (0.003) High -0.025 (0.003) High -0.084 (0.003) Low -0.011 (0.001) Low -0.015 (0.003) Low 0.028 (0.003) Low 0.037 (0.003) Interactioneffect-size�proportion 0.5�50% 0.064 (0.003) <0.001 Small imbalance�50% 0.214 (0.005) <0.001 0.5�75% 0.129 (0.003) Small imbalance �75% 0.446 (0.005) 1�50% 0.166 (0.003) Large imbalance�50% 0.184 (0.005) 1�75% 0.366 (0.003) Large imbalance �75% 0.410 (0.005) Constant 0.089 (0.002) <0.001 -0.004 (0.003) 0.225 -0.003 (0.003) 0.312 0.017 (0.003) <0.001
Note: Only the interaction terms which were statistically significant and with estimates higher than 0.1 were kept in the models. SE: Standard Error,Δ: Magnitude of the group difference in the location parameter; Proportion: proportion of items with DIF in the scale; Position: position of the location parameters of items with DIF along the latent trait; Unif: uniformly distributed; Mean: around the mean of the item difficulties; Extreme: high and low difficulties; High: high difficulties; Low: low difficulties
�: interaction
pretested this instrument adapted in performing a review of the first draft of the guidelines. Then, after extensive discussion between AR, JBH, JC and VS, an informal consensus led to a second draft. An invitation to review these recommendations was then sent to 22 experts of the Rasch framework or experts in epidemiology and familiar with DIF assessment using Rasch framework models (10 in Europe, 10 in the United-States, 1 in Asia and 1 in Australia). A draft of this manuscript with a reprint of the previously published simulation study and the AGREE instrument adapted were sent to the 7 experts who accepted the invitation (list in acknowledgments section).
4.3. Results
Nearly 70% of the 285 articles reviewed in which the IRT framework was used involved the Rasch framework. It was the most used in “quality of life” and “medical disciplines” research fields. These recommendations related to DIF assessment in composite measurement scales using Rasch framework models are therefore relevant to most medical epidemiologists. Sample size and characteristics of the scales studied in these articles were close to the values used in the simulation model. The number of items per dimension (median = 9[6–15]) was nevertheless smaller in the simulation study but it was not associated withmeasurement bias. According to
the information from the literature review, results from our simulation study, which allowed analysis of most situations encountered in practice, thus appear to be a suitable basis for recommendations.
Recommendation 1:Distinguish between uniform, balanced non-uniform and unbalanced non-uniform DIF.
Justification: In the simulation study, there were large effects of DIF effect-size, proportion of DIF items and their interaction on measurement bias in case of uniform or unbalanced non-uniform DIF. However, non-uniform DIF was assessed in less than a quarter of the pub-lished articles using the Rasch framework. While in most of software that allow estimation of Rasch model item parameters, DIF tests are accessible or may be programmed, only few of them, the most popular ones, include programs aimed at distinguishing uniform from non-uniform DIF: RUMM (used in 25 articles), WINSTEPS (used in 17 articles)[28,29].
Recommendation 2:When statistically significant DIF is found, its effect-size should be esti-mated as the group difference in the item location parameter(s).
Justification: DIF effect size estimates were provided in only 18 (37%) of the 49 articles in which statistically significant DIF was detected within the Rasch framework. However, the simulation study revealed that this information is essential to evaluate the consequences of DIF. Indeed, ANOVA coefficients of this factor and of its interaction with the proportion of items in the scale affected by DIF were higher than 0.1 logit for both uniform and unbalanced non-uniform DIF.
Recommendation 3:Due to the presence of statistically significant DIF:
• If the scale has been modified, provide information on how it has been modified
• If the scale has not been modified, provide recommendations on how to take the presence of DIF with meaningful consequences into account when using the scale in practice, i.e. when:
•Statistically significant uniform DIF is found in more than 25% of the items within a dimension
•Statistically significant uniform DIF is found with an effect-size higher than 0.25 logit
Justification: In 31 (44%) of the 71 articles in which statistically significant DIF was found, there was no modification of the scale, and no recommendation on how to handle the presence of DIF in practice. DIF effect-size thresholds found in the simulation study were different to those encountered in most published studies; this should be underlined as the threshold can have substantial effects on measurement bias in practice [12,18].
Recommendation 4:If several items exhibit statistically significant DIF within the dimension but in opposite direction, assess its effects at the dimension level empirically.
Justification: If the effects from items exhibiting DIF for one group are cancelled by those of other items that exhibit DIF for another group in the dimension, this is called the “DIF cancel-lation” phenomenon [30–33]. This was not addressed in the simulation study as it involved too many situations to perform. However, a kind of “cancellation” phenomenon was observed at the item level for balanced non-uniform DIF in which DIF-related factors had negligible effects. This was not observed for unbalanced non-uniform DIF. Therefore, the effects from items exhibiting DIF for one group may not be cancelled by those of other items that exhibit DIF for another group if the sum of the effect-sizes of the DIF exhibited by all the items within the dimension is not zero (unbalanced).
5. Strengths and limits
Following the review, recommendations were not modified but their justification was improved and their application field more precisely defined. Median of reviewers’ ratings to each AGREE item and scores to the six AGREE domains are reported in theS2 Table. Scores were higher than 70% in every domain except the “Applicability domain”. As other improve-ments, a box (S1 Box) gathering the recommendations altogether was supplied and strengths and limits of each method used in this work clarified.
One of the major strengths of these recommendations is that they are based on results from a simulation study closely linked to their field of application, i.e. health research studies in which the Rasch framework is used, as revealed by the literature review. However, in more than half of the articles reviewed, measurement invariance was assessed using methods from the CFA framework. As perspective, similar work to establish recommendations for the CFA framework would therefore be valuable, as well as for 2PL IRT models.
We propose only four recommendations to facilitate their application, and recommendation 3 provides practical criteria to identify statistically significant DIF as not meaningful in many situations. Applying these recommendations will thus reduce resources as, in these situations, it will reduce the need for statisticians with expertise with models for taking DIF into account. Finally, using a threshold of 0.1 logit (not completely arbitrary as equal to half a small effect-size as defined by Cohen), there was no effect sufficiently large to be relevant in practice found in the simulation study concerning the position of the item affected by DIF along the latent trait continuum. No recommendation was thus formulated on this factor but future updates of these recommendations (within 10 years) will be performed based on scenarios which were not con-sidered in our simulation study. It will also involve literature reviews to assess their application in practice and consequences on how DIF is handled by scale users, as well as any new theoreti-cal and methodologitheoreti-cal approaches to study DIF. Finally, although some statistitheoreti-cal software facilitate study of DIF using the Rasch model (RUMM, Stata, R), their use to characterize DIF as meaningful or not can be complicated and thus impede the application of these recommenda-tions [28,34,35]. To raise these barriers to the application of the recommendations, development of modules or packages for existing statistics software is being considered.
This study has some limitations that highlight the need for further works on detection and characterization of statistically significant DIF. Indeed, these recommendations do not
concern best methods for DIF detection and, as revealed in the literature study, these methods are numerous, so researchers should be interested in some guidance in this area. For example, guidance for assessing DIF iteratively to distinguish between real and artificial DIF has been published in the last decade and this is an imperative step before applying the present recom-mendations [36,37]. Also, the literature review and the simulation study were designed in order to focus on health research studies, however, this is not the only research domain in which DIF is a subject of concern and, to our knowledge, such recommendations do not exist in any domain. Incidentally, further work should also focus on recommendations on the next step, i.e. on best practice when DIF is identified and found statistically significant and relevant. Finally, information on the best methods to take meaningful DIF into account is scarce in the literature and this will be further studied to enrich these first recommendations on DIF consid-eration in health research studies. In this respect, it is to note that in some cases, it can be quite difficult to decide on whether or not applying a method to take meaningful DIF into account as it may reduce the validity of the assessment if the source of the DIF is conceptually relevant to the attribute being measured [38].
6. Conclusions
Our combination of a literature review and a simulation study led to the first consensual rec-ommendations reviewed by international experts for the assessment of DIF within the Rasch framework in short composite measurement scales. There is a growing interest in DIF in health research, and these recommendations will help researchers conducting DIF assessment studies. They will also help scale users because the information provided in DIF assessment studies will be clearer on how to report and handle DIF into account in practice. This will con-tribute to better accuracy of results in epidemiological studies by improving the measurement properties of composite measurement scales, increasingly used in health research.
Supporting information
S1 Table. Evaluation of the effects of the presence of DIF and practices and/or recommen-dation produced for its management in practice. N = 71 articles in which statistically
signifi-cant DIF was found. (DOCX)
S2 Table. Median of the rating (from 1-“strongly disagree” to 7-“strongly agree”) by the seven reviewers to each items of the Appraisal of Guidelines for Research & Evaluation II (AGREE II) adapted for the evaluation of methodological recommendations and score to each of the six domains.
(DOCX)
S1 List. List of the references of the 285 articles included in the literature review. References
with 2015 as year of publication were published online during the search period: November 11, 2013 and November 10, 2014.
(DOCX)
S1 Box. Median of the rating (from 1-“strongly disagree” to 7-“strongly agree”) by the seven reviewers to each items of the Appraisal of Guidelines for Research & Evaluation II (AGREE II) adapted for the evaluation of methodological recommendations and score to each of the six domains.
Acknowledgments
The authors wish to thank experts who accepted to review the recommendations: Jakob Bjørner, (University of Copenhagen, Denmark), Stefan Cano (Modus Outcomes, UK), Carlos Garcia Forero (Universitat Pompeu Fabra, Spain), Laura E Gibbons (University of Washing-ton, USA), James W Griffith (Northwestern University, USA), Francis Guillemin (Universite´ de Lorraine, France) and Richard N Jones (Brown University, USA).
Author Contributions
Conceptualization: Alexandra Rouquette, Jean-Benoit Hardouin, Joe¨l Coste.
Data curation: Alexandra Rouquette, Jean-Benoit Hardouin, Alexis Vanhaesebrouck. Formal analysis: Alexandra Rouquette, Jean-Benoit Hardouin, Alexis Vanhaesebrouck. Investigation: Alexandra Rouquette, Jean-Benoit Hardouin, Joe¨l Coste.
Methodology: Alexandra Rouquette, Jean-Benoit Hardouin, Ve´ronique Se´bille, Joe¨l Coste. Resources: Joe¨l Coste.
Software: Jean-Benoit Hardouin.
Supervision: Alexandra Rouquette, Jean-Benoit Hardouin, Joe¨l Coste.
Validation: Alexandra Rouquette, Jean-Benoit Hardouin, Ve´ronique Se´bille, Joe¨l Coste. Visualization: Alexis Vanhaesebrouck, Joe¨l Coste.
Writing – original draft: Alexandra Rouquette, Jean-Benoit Hardouin, Alexis
Vanhaeseb-rouck, Ve´ronique Se´bille, Joe¨l Coste.
Writing – review & editing: Alexandra Rouquette, Jean-Benoit Hardouin, Ve´ronique Se´bille,
Joe¨l Coste.
References
1. Millsap RE. Statistical Approaches to Measurement Invariance. Routledge; 2011.
2. Zumbo BD, Chan EKH, editors. Validity and Validation in Social, Behavioral, and Health Sciences. Cham: Springer International Publishing; 2014.
3. U.S. Department of Health and Human Services FDA Center for Drug Evaluation and Research, U.S. Department of Health and Human Services FDA Center for Biologics Evaluation and Research, U.S. Department of Health and Human Services FDA Center for Devices and Radiological Health. Guidance for industry: patient-reported outcome measures: use in medical product development to support label-ing claims: draft guidance. Health Qual Life Outcomes. 2006; 4: 79. https://doi.org/10.1186/1477-7525-4-79PMID:17034633
4. Mokkink LB, Terwee CB, Patrick DL, Alonso J, Stratford PW, Knol DL, et al. The COSMIN study reached international consensus on taxonomy, terminology, and definitions of measurement properties for health-related patient-reported outcomes. J Clin Epidemiol. 2010; 63: 737–745.https://doi.org/10. 1016/j.jclinepi.2010.02.006PMID:20494804
5. Valderas JM, Ferrer M, Mendı´vil J, Garin O, Rajmil L, Herdman M, et al. Development of EMPRO: A Tool for the Standardized Assessment of Patient-Reported Outcome Measures. Value Health. 2008; 11: 700–708.https://doi.org/10.1111/j.1524-4733.2007.00309.xPMID:18194398
6. American Educational Research Association, American Psychological Association. Standards for Edu-cational and Psychological Testing. Washington, D.C: American EduEdu-cational Research Association; 2014.
7. Angoff WH. Perspectives on differential item functioning methodology. In: Holland PW, Wainer H, edi-tors. Differential item functioning. Hillsdale, NJ, US: Lawrence Erlbaum Associates, Inc; 1993. pp. 3– 23.
8. Mellenbergh GJ. Item bias and item response theory. Int J Educ Res. 1989; 13: 127–143.https://doi. org/10.1016/0883-0355(89)90002-5
9. Swaminathan H, Rogers HJ. Detecting Differential Item Functioning Using Logistic Regression Proce-dures. J Educ Meas. 1990; 27: 361–370.https://doi.org/10.1111/j.1745-3984.1990.tb00754.x
10. Millsap RE, Everson HT. Methodology Review: Statistical Approaches for Assessing Measurement Bias. Appl Psychol Meas. 1993; 17: 297–334.https://doi.org/10.1177/014662169301700401
11. Holland PW, Thayer DT. Differential Item Performance and the Mantel-Haenszel Procedure. 1986; Available:http://eric.ed.gov/?id=ED272577
12. Dorans NJ, Holland PW. Dif Detection and Description: Mantel-Haenszel and Standardization1,2. ETS Res Rep Ser. 1992; 1992: i–40.https://doi.org/10.1002/j.2333-8504.1992.tb01440.x
13. Dorans NJ, Kulick E. Demonstrating the Utility of the Standardization Approach to Assessing Unex-pected Differential Item Performance on the Scholastic Aptitude Test. J Educ Meas. 1986; 23: 355– 368.https://doi.org/10.1111/j.1745-3984.1986.tb00255.x
14. Borsboom D. When Does Measurement Invariance Matter? [Editorial]. Med Care Meas Multi-Ethn Soc. 2006; 44.https://doi.org/10.1097/01.mlr.0000245143.08679.ccPMID:17060825
15. Christensen KB, Kreiner S, Mesbah M, editors. Front Matter. Rasch Models in Health. Hoboken, NJ USA: John Wiley & Sons, Inc.; 2012. pp. i–xvi.
16. Embretson SE, Reise SP. Item Response Theory for Psychologists. L. Erlbaum Associates; 2000. 17. Rasch G. Probabilistic models for some intelligence and attainment tests. Danish Institute for
Educa-tional Research. Copenhagen: Chicago: University of Chicago Press; 1980.
18. Linacre J. Sample Size and Item Calibration [or Person Measure] Stability. Rash Meas Trans. 1994; 7: 328.
19. Rouquette A, Hardouin J-B, Coste J. Differential Item Functioning (DIF) and Subsequent Bias in Group Comparisons using a Composite Measurement Scale: a Simulation Study. J Appl Meas. 2016; 17: 312– 334. PMID:28027055
20. Crane PK, Gibbons LE, Jolley L, van Belle G. Differential item functioning analysis with ordinal logistic regression techniques. DIFdetect and difwithpar. Med Care. 2006; 44: S115–123.https://doi.org/10. 1097/01.mlr.0000245183.28384.edPMID:17060818
21. Gibbons L. DIFDETECT: Stata module to detect and adjust for differential item functioning (DIF) [Inter-net]. Boston College Department of Economics; 2015.
22. Choi SW. lordif: Logistic Ordinal Regression Differential Item Functioning using IRT [Internet]. CRAN; 2016. Available:https://cran.r-project.org/web/packages/lordif/
23. Masters GN. A Rasch model for partial credit scoring. Psychometrika. 1982; 47: 149–174.https://doi. org/10.1007/BF02296272
24. Norman GR, Sloan JA, Wyrwich KW. Interpretation of changes in health-related quality of life: the remarkable universality of half a standard deviation. Med Care. 2003; 41: 582–592.https://doi.org/10. 1097/01.MLR.0000062554.74615.4CPMID:12719681
25. StataCorp LP. Stata Statistical Software: Release 12.1. College Station, TX: StataCorp, L.P.; 2012. 26. Cohen J. Statistical Power Analysis for the Behavioral Sciences [Internet]. L. Erlbaum Associates;
1988.
27. Brouwers M, Kho M, Browman G, Cluzeau F, Feder G, Fervers B, et al. AGREE II: Advancing guideline development, reporting and evaluation in healthcare. Can Med Assoc J. 2010; 182: E839–842. 28. Andrich D, Sheridan BS, Luo G. Rumm2030: Rasch Unidimensional Measurement Models [computer
software]. Perth, Western Australia: RUMM Laboratory; 2010.
29. Linacre J. WINSTEPS Rasch measurement computer program. Chicago:Winsteps.com; 2006. 30. Nandakumar R. Simultaneous DIF Amplification and Cancellation: Shealy-Stout’s Test for DIF. J Educ
Meas. 1993; 30: 293–311.https://doi.org/10.1111/j.1745-3984.1993.tb00428.x
31. Shealy R, Stout W. A model-based standardization approach that separates true bias/DIF from group ability differences and detects test bias/DTF as well as item bias/DIF. Psychometrika. 1993; 58: 159– 194.https://doi.org/10.1007/BF02294572
32. Teresi JA. Different approaches to differential item functioning in health applications. Advantages, dis-advantages and some neglected topics. Med Care. 2006; 44: S152–170.https://doi.org/10.1097/01. mlr.0000245142.74628.abPMID:17060822
33. Wyse AE. DIF Cancellation in the Rasch Model. J Appl Meas. 2013; 14: 118–128. PMID:23816591
34. Hardouin J-B. SIMIRT: Stata module to process data generated by IRT models. Boston College Department of Economics; 2005.
35. Rizopoulos D. ltm: Latent Trait Models under IRT, version 1.0–0. 2015.
36. Andrich D, Hagquist C. Real and Artificial Differential Item Functioning. J Educ Behav Stat. 2012; 37: 387–416.https://doi.org/10.3102/1076998611411913
37. Andrich D, Hagquist C. Real and Artificial Differential Item Functioning in Polytomous Items. Educ Psy-chol Meas. 2015; 75: 185–207.https://doi.org/10.1177/0013164414534258PMID:29795818
38. Hagquist C, Andrich D. Recent advances in analysis of differential item functioning in health research using the Rasch model. Health Qual Life Outcomes. 2017; 15: 181. https://doi.org/10.1186/s12955-017-0755-0PMID:28927468