HAL Id: hal-00296242
https://hal.archives-ouvertes.fr/hal-00296242
Submitted on 7 Jun 2007
HAL is a multi-disciplinary open access
archive for the deposit and dissemination of
sci-entific research documents, whether they are
pub-lished or not. The documents may come from
teaching and research institutions in France or
abroad, or from public or private research centers.
L’archive ouverte pluridisciplinaire HAL, est
destinée au dépôt et à la diffusion de documents
scientifiques de niveau recherche, publiés ou non,
émanant des établissements d’enseignement et de
recherche français ou étrangers, des laboratoires
publics ou privés.
Towards closure between measured and modelled UV
under clear skies at four diverse sites
J. Badosa, R. L. Mckenzie, M. Kotkamp, J. Calbó, J. A. González, P. V.
Johnston, M. O’Neill, D. J. Anderson
To cite this version:
J. Badosa, R. L. Mckenzie, M. Kotkamp, J. Calbó, J. A. González, et al.. Towards closure between
measured and modelled UV under clear skies at four diverse sites. Atmospheric Chemistry and Physics,
European Geosciences Union, 2007, 7 (11), pp.2817-2837. �hal-00296242�
www.atmos-chem-phys.net/7/2817/2007/ © Author(s) 2007. This work is licensed under a Creative Commons License.
Chemistry
and Physics
Towards closure between measured and modelled UV under clear
skies at four diverse sites
J. Badosa1, R. L. McKenzie2, M. Kotkamp2, J. Calb´o1, J. A. Gonz´alez1, P. V. Johnston2, M. O’Neill3, and D. J. Anderson4
1Departament de F´ısica, Grup de Fisica Ambiental, Universitat de Girona, Girona, Spain 2National Institute of Water and Atmospheric Research (NIWA), Lauder, New Zealand
3Cooperative Institute for Research in Environmental Sciences, University of Colorado, Boulder, USA 4Bureau of Meteorology (BoM), Melbourne, Australia
Received: 23 November 2006 – Published in Atmos. Chem. Phys. Discuss.: 30 January 2007 Revised: 10 May 2007 – Accepted: 10 May 2007 – Published: 7 June 2007
Abstract. The purpose of this work is determine the extent
of closure between measurements and models of UV irra-diances at diverse sites using state of the art instruments, models, and the best available data as inputs to the models. These include information about aerosol optical depth (un-fortunately not extending down as far into the UVB region as desirable because such information is not generally avail-able), ozone column amounts, as well as vertical profiles of temperature. We concentrate on clear-sky irradiances, and report the results in terms of UV Index (UVI).
Clear-sky data from one year of measurements at each of four diverse sites (Lauder – New Zealand, Mauna Loa Obser-vatory – Hawaii, Boulder – Colorado, and Melbourne – Aus-tralia) have been analysed in detail, also taking account of different measurements of ozone, including satellite-derived values, as well as ground measured values, both from Dob-son instruments and as retrieved from the UV spectra under study. Previous studies have generally focussed on data from a single site, and for shorter periods. As such, it is the most comprehensive study of its kind to date.
At Lauder, which is the cleanest low altitude site, we ob-tained agreement between measurement and model at 5% level, which is consistent with the best agreement found pre-viously. At Mauna Loa Observatory, similar agreement was achieved, but model calculations need to allow for reflec-tions from cloud that are present below the observatory. At this site, there are occasional problems with using satellite-derived ozone. At Boulder, mean agreements were simi-lar but the dispersion around the mean was slightly simi-larger, corresponding to larger uncertainties in the aerosol inputs to the model. However, at Melbourne, which is the only
non-Correspondence to: J. Badosa
NDACC (Network for the Detection of Atmospheric Compo-sition Change) site, there remain unexplained discrepancies. The measured values are significantly lower than the calcu-lated values. We investigate the extent to which this discrep-ancy can be explained by incomplete knowledge of aerosol extinctions in the UV at this site. We conclude that further information about aerosol optical depth and single scatter-ing albedo in the UVB region is needed to resolve the is-sues. For more polluted sites (the four considered locations show in general small aerosol load), the uncertainties in the aerosol input parameters would lead to less confidence on the modelling approach. At the three NDACC sites, the closure provided by the study gives confidence in both the measure-ments and our ability to model them. This study revealed a limitation in the use of PTFE diffusers when temperatures are lower than approximately 20◦C. It also documents the range of clear sky UVI values expected at these diverse sites.
1 Introduction
There have been significant improvements in the quality and availability of UV spectral irradiance measurements in recent years, as well as in our ability to model them. Further, public awareness about skin-damaging UV radiation has been im-proved through use of the UV Index (UVI) (WHO, 2002), which is a measure of erythemally-weighted (i.e., “sunburn-ing”) UV irradiance incident on a horizontal surface. For clear sky conditions, the UVI is mainly affected by Sun-Earth geometry, atmospheric ozone, aerosols, altitude of the site and the albedo of the ground (Herman et al., 1999; Kerr et al., 2003). Clouds can both enhance and reduce UVI with large temporal and spatial variations (Calb´o et al., 2005).
2818 J. Badosa et al.: Measured and modelled UV under clear skies at four sites UV information is available from modelling calculations and
from direct measurements.
Multi-scattering radiative transfer models offer better ac-curacy in calculated UV irradiances than parameterized and empirical models. Several such models, which allow calcu-lation of UVI, are freely available. Several intercomparisons of UV models have been performed. Van Weele et al. (2000) compared global and direct spectral UV calculations from 12 numerical models for six benchmark spectra corresponding to diverse conditions. They found agreements within ±3% for wavelengths longer than 320 nm and for high sun condi-tions. For low sun conditions, agreement was within ±10% for wavelengths larger than 300 nm. Koepke et al. (1998) in-tercompared UVI from six multi-scattering models. Agree-ments within 5% and 0.5 units in UVI were found for 80% of the conditions considered. That study assumed the same input options, such as the same simplification of the aerosol phase function and the extraterrestrial (ET) irradiance spec-trum, for all models. So, absolute radiative transfer mod-elling errors could be larger.
For measurements of erythemal UV irradiances, well-calibrated spectroradiometers are more accurate than broad-band radiometers. With the former, the exact erythe-mal function from the CIE (Commission Internacionale de l’Eclairage) (McKinlay and Diffey, 1987) can be applied to the spectral measurements to obtain the erythemal UV irradiance and UVI. In contrast, the spectral response of UV radiometers deviates from the CIE response, which can lead to large uncertainties in the measured UVI (Leszczyn-ski et al., 1998). Several intercomparison campaigns have shown agreements that can be expected between different instruments. Seckmeyer et al. (1995) presented a compar-ison between spectral UV measurements from five instru-ments at Garmisch-Partenkirchen (Germany) for three con-secutive days in August 1994. The instruments generally agreed within ±5% for wavelengths longer than 310 nm. Daily doses of erythemal UV were also compared showing agreements within ±7%. Bais et al. (2001) compared spec-tral UV measurements for two days in July 1997 in Greece from 19 spectroradiometers in the frame of SUSPEN (Stan-dardization of Ultraviolet Spectroradiometry in Preparation of a European Network) intercomparison. The range of de-viations found among them was ±20%, although 16 instru-ments agreed within ±10%.
Spectral comparisons between UV models and measure-ments have been carried out in several studies for cloudless conditions. Zeng et al. (1994) reported model-measurement differences in New Zealand within ±8% in the UVB region (wavelength from 280 to 320 nm) and within ±4% for longer wavelengths for the cases in which the atmospheric optical properties were best known. Weihs and Webb (1997) found deviations about ±10% or slightly more in Panorama, Greece (385 m a.s.l.) and ±5% to ±10% at Jungfraujoch, Switzer-land (3580 m a.s.l.), which, in most of cases, were within the measurement uncertainties. Differences up to 14% in
mod-elled UV were found between runs with estimated and cli-matic values of single scattering albedo (SSA), respectively. In four of the six benchmark cases considered by van Weele et al. (2000) they found agreements against observed spectra within ±13% over the whole UV spectral region. These stud-ies showed that model uncertaintstud-ies are comparable with, but slightly larger than, measurement uncertainties.
Few studies have compared measured and modelled erythemally-weighted UV irradiances. One of the most prehensive of these was by De Backer et al. (2001) who com-pared UVI from spectral measurements from five instruments at four locations and calculations from eleven radiative trans-fer models and two empirical models. For the modelling, only total ozone column (TOZ) measurements were available while aerosol and ground reflectivity information was esti-mated. In many cases model-measurements deviations were less than 0.5 units of UVI, although deviations of more than 10% were not uncommon, with absolute deviations up to 2 units of UVI for radiative transfer models and occasionally reaching 5 units of UVI.
Mayer et al. (1997) compared two years of erythemal UV irradiance measurements from a high quality spectrometer in Garmisch-Partenkirchen and radiative transfer calculations. For this analysis, aerosol optical depth (AOD) measurements were also available. Systematic deviations ranged from 8 to 12% depending on the modelling code used. It was also shown that model-measurement agreement was greatly im-proved (dispersion of the differences were reduced by a fac-tor of 4) when aerosol measurements were considered instead of estimations of the visibility. Kylling et al. (1998) showed relative mean model-measurement differences within ±5% for UVB irradiances from two sites in Greece using two dif-ferent instruments. Special attention was paid on the aerosol optical input values and their effect on UV. As a main issue, all these studies highlighted the important influence of the uncertainty of aerosol input information on the accuracy of UV calculations.
The present study shows the results from a more detailed comparison between measurements and model calculations of UVI for selected clear sky conditions during one year at four sites. The originality of the paper comes from the sum of the following points:
– UVI measurements from the same kind of
spectrora-diometers (same manufacturer) are used for all sites, and these instruments represent state-of-the-art in UV measurement.
– The four considered sites are diverse in terms of
alti-tude, latitude (from both hemispheres) and atmospheric characteristics.
– The most important required input information (such as
ozone and aerosols) for UVI modelling is available at each site.
Table 1. Geographical information about the four sites considered for this study. Also identification names of NIWA spectroradiometers at
each site are given.
Lauder Boulder Mauna Loa Melbourne
Country New Zealand Colorado (USA) Hawaii (USA) Australia
Year studied 2001 2000 2001 2002
Latitude 45.04 S 40.01 N 19.53 N 37.69 S
Longitude 169.68 E 105.25 W 155.58 W 144.95 E
UT NZST−12 h LMT+7 h LMT+10 h LMT−10 h
Altitude 370 m 1650 m 3400 m 110 m
Instrument ID UVM UV4 UV3 UV7
– Fifteen modelling cases are performed so the effect of
considering different input information into the model can be assessed.
– Apart from evaluating the general model-measurement
agreement at each site for different modelling cases, special attention is paid to the daily variation of the model-measurement comparison for particular days. The study utilizes data from UV spectrometers which have been in the use for over a decade and are deployed at sev-eral sites of importance for atmospheric research. In partic-ular, they are located at several sites which form the Net-work for the Detection of Atmospheric Composition Change (NDACC – formerly called the Detection of Atmospheric Stratospheric Change or NDSC). These sites are charac-terised by the availability of a wide range of measurements which enable better interpretation of measurements and mod-els.
The paper is organised as follows. Section 2 presents the sites and datasets used. Section 3.1 discusses about the UVI measurements and their uncertainties. The criteria used for the clear sky filtering and the UV dataset that is used for this study are discussed in Sect. 3.2. Modelling options consid-ered are discussed in Sect. 4. In Sect. 4.1, the modelling cases are presented and the differences in modelled UVI due to changes in inputs are discussed. Uncertainties associated with the modelling are discussed in Sect. 4.2. Results of the general UVI model-measurement comparison are discussed in Sect. 5. Section 6 analyses the daily variations observed in the comparison for particular days. Finally, causes of ob-served daily variations are discussed. Limitations in both the modelled and measured UVI are revealed.
2 Sites and datasets
For this study, one year of data was analysed for the follow-ing sites and periods: Lauder, New Zealand (2001), Boul-der, Colorado (2000), Mauna Loa, Hawaii (2001) and Mel-bourne, Australia (2002). Table 1 summarizes information about these sites.
A wide range of different types of measurements have been involved, as summarised in Table 2. In particular, the UVI measurements are derived from spectral irradiance mea-surements at the four sites.
As input for the UVI modelling, daily values of TOZ from Dobson Ozone Spectrophotometers (hereinafter called TOZD and from the Total Ozone Mapping Spectrometer
(TOMS) version 8 (hereafter called TOZT)are considered.
These sources of TOZ correspond to measurements around noon. However, the TOZD available from the CMDL
web-site (see Table 2) does not always correspond to noontime due to quality criteria. Nevertheless, we found that there were no differences between these values and the actual noon values for the majority of days at each site. Moreover, for more than 80% of days, the differences were of less than 3 DU and, in any case, the differences were not larger than 5 DU, which are within the uncertainties of the Dobson mea-surements (see discussion below).In addition to these ozone measurements, an estimation of TOZ is also available from the UV spectral measurements using a previously discussed method (Stamnes et al., 1991) (hereafter called TOZS.
AOD measurements are available for all sites, unfortu-nately not extending down as far into the UVB region as de-sirable because such information is not generally available. Measured ozone and temperature profiles from ozone son-des are also used as input to the model. Other ancillary data, which support to the analysis, are discussed below.
3 UVI measurement dataset
Measurements of UVI from the four sites were taken from spectroradiometers manufactured at the National Institute of Water and Atmospheric Research (NIWA) in Lauder, New Zealand. These instruments represent state-of-the-art for pre-cision long-term measurements of UV irradiances, and they meet the exacting requirements of the NDACC (McKenzie et al., 1997).
2820 J. Badosa et al.: Measured an d modelled UV under clear skies at four sites
Table 2. Details of data sources used for this study from Lauder, Boulder, Mauna Loa, Hilo and Melbourne.
Data Use Site Time resolution Contact Affiliation (place) Contact point Spectral UV UVI measurements
TOZ estimation Lauder Boulder Mauna Loa Melbourne 5◦steps of SZA
but 15 min steps around noon R. McKenzie M. O’Neill ′′ D. Anderson NIWAT(Lauder) NOAAT-CMDLT (Boulder) ′′ BoMT(Melbourne) [email protected] michael.o’[email protected] ′′ [email protected] Glob/Diff/Dir total irradiance
Clear-sky filtering Lauder Boulder Mauna Loa Melbourne 1 min B. Forgan NOAA-CMDL ′′ B. Forgan BoM (Melbourne) NOAA-CMDL (Boulder) ′′ BoM (Melbourne) [email protected] http://www.cmdl.noaa.gov/infodata/ftpdata.html ′′ [email protected] Aerosol optical depth Model input Lauder
Boulder Mauna Loa* Melbourne 2× day (a.m./p.m.) 1 min ′′ 2× day (a.m./p.m.) B. Liley E. G. Dutton ′′ B. Forgan NIWA (Lauder) NOAA-CMDL (Boulder) ′′ BoM (Melbourne) [email protected] [email protected] ′′ [email protected] Total Ozone Assimilated
from TOMS
Model input All Sites 1 day G. Bodeker NIWA (Lauder) [email protected] Total ozone from Dobson
sunphotometer
Model input Lauder Boulder Mauna Loa Melbourne 1 day NOAA-CMDL ′′ ′′ J. Easson NOAA-CMDL (Boulder) ′′ ′′ BoM (Melbourne) http://www.cmdl.noaa.gov/ozwv/dobson/select.html ′′ ′′ [email protected] Ozone and temperature
pro-files from ozone sonde
Model input Lauder Boulder Mauna Loa (Hilo) Melbourne
1 week approx. G. Bodeker S. Oltmans ′′ A. Downey NIWA (Lauder) NOAA-CMDL (Boulder) ′′ BoM (Melbourne) [email protected] [email protected] ′′ [email protected] Temperature and wind Ancillary data Lauder
Boulder Mauna Loa Melbourne 10 min 1 h ′′ 1 min Climate database NOAA-CMDL ′′ P. Dyson
NIWA (New Zealand) NOAA-CMDL (Boulder) ′′ BoM (Melbourne) http://cliflo.niwa.co.nz http://www.cmdl.noaa.gov/infodata/ftpdata.html ′′ [email protected] Webcam images Ancillary data Mauna Loa 10 min D. T. Kuniyuki NOAA-CMDL (Mauna Loa) [email protected]
*Data were obtained using a Precision Filter Radiometer supplied to GAW network stations by Christoph Wehrli of the World Radia-tion Center and Physical Meteorological Observatory Davos (PMOD) in Davos, Switzerland. The data were processed and analyzed by NOAA/CMDL Solar and Thermal Atmospheric Radiation group.
TNIWA: National Institute of Water and Atmospheric Research (New Zealand) NOAA: National Oceanic and Atmospheric Administration
(USA) CMDL: Climate Monitoring and Diagnostics Laboratory (USA) BoM: Bureau of Meteorology (Australia)
Atmos. Chem. Ph ys., 7, 2817– 2837 , 2007 www .atmos-chem-ph ys. net/7/2817/2007/
3.1 Uncertainties associated with the UVI measurements It was shown in the SUSPEN intercomparison of spectrora-diometers that NIWA-built spectroradiometer agreed within
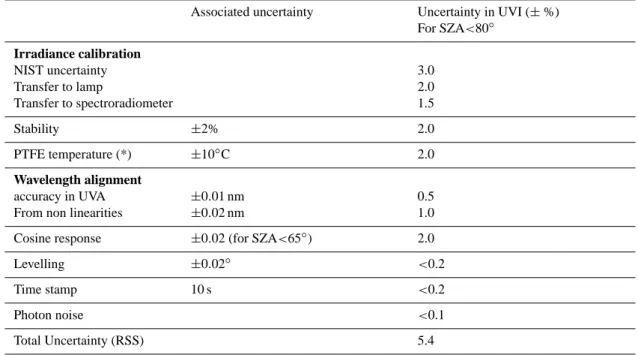
±5% with the reference spectra and with the other two instru-ments built with the same double monochromator (DTM300) (Bais et al., 2001). This range is currently accepted as the state-of-the-art uncertainty of UV measurements. Table 3 shows known uncertainties of measured UVI with NIWA spectroradiometers (McKenzie et al., 1997). The total un-certainty (Root Summed Square, RSS) is found at the level of about 5.4%.
Calibration lamps used to calibrate these instruments are traceable to primary standards of the National Institute of Standards and Technology (NIST) (Walker et al., 1987). Fur-ther systematic uncertainties of about 1% can also be traced to changes in the NIST irradiance scale (Yoon et al., 2002).
For the wavelength alignment in NIWA instruments, the LOWTRAN ET spectrum (Kneizys et al., 1983) was previ-ously used as the reference spectrum. For this study, how-ever, in order to be consistent with ET spectrum used in the UV modelling (see below), the SUSIM-ATLAS 3 ET trum (Woods et al., 1996) was considered instead. This spec-trum was found to be shifted 0.04 nm to the red in compar-ison with LOWTRAN spectrum. Consequently, this made measured UVI ∼1–2% systematically lower than previous estimations from the NIWA group.
3.2 Clear sky selection
Strict criteria were used to filter the UVI data for clear-sky conditions using a previously discussed algorithm (Long and Ackerman, 2000). To run this algorithm, 1-min data of dif-fuse and global total irradiances were considered for Boul-der and Mauna Loa. For LauBoul-der and Melbourne, 1-min dif-fuse, direct and global total irradiances were available (see Table 2). An available UVI measurement was selected as clear if (1) the algorithm had labelled 70% or a larger time fraction as clear for that day and if (2) the estimated cloud fraction (by the same algorithm) associated to the time of the measurement was less or equal to 2%. Condition (1) was im-posed in order to avoid having only few minutes selected per day, so daily evolutions and changes could be studied.
Figure 1 shows the UVI measurements for the times that passed the clear-sky criteria. There were 31 days for Lauder, 23 days for Boulder (note that for year 2000 there was no UVI data available from days 110 to 165), 98 days for Mauna Loa and 11 days for Melbourne. The histograms of SZA cor-responding to these selected measurements are also shown in Fig. 1. The ranges of SZA are: 22.0–75.4◦for Lauder, 16.6– 75.0◦for Boulder, 0.0–80.0◦for Mauna Loa and 17.7–75.0◦ for Melbourne. Conditions with SZA>80◦were filtered by the clear sky criteria since the Long and Ackerman algorithm does not evaluate data with SZA above this threshold.
Any UVI data for which concurrent measured AOD was not available were rejected from the study and are not shown in Fig. 1. After this filtering process, the percentages of total initial data that remained were: 6.5% for Lauder, 4.8% for Boulder, 17.8% for Mauna Loa, and 2.5% for Melbourne.
4 Modelling
The Tropospheric Ultraviolet and Visible (TUV) radiative transfer model (Madronich, 1993) version 4.1a was used for the UVI calculations. We used the DISORT radiative transfer solver with eight streams and pseudo spherical corrections (i.e., the “psndo” version of the model). The spectral range was 280 to 400 nm with 1 nm steps. The TUV default ET spectrum (ATLAS3-SUSIM 13 November 1994 high resolu-tion) was selected, as commented above.
The following parameters were taken into account in this study
– solar zenith angle (SZA),
– total ozone column amount (TOZ), – ozone profile (OP),
– temperature profile (TP), – ground surface albedo (galb) – ground level,
– aerosol optical depth (AOD),
– aerosol single scattering albedo (SSA), – aerosol asymmetry factor (g),
– aerosol ˚Angstr¨om exponent (alpha) (Angstrom, 1964),
– aerosol profile.
The way of introducing SZA, ground level, g, alpha and the aerosol profile into the model remained invariable throughout this study. The other input parameters were introduced in several different ways, leading to different modelling cases that will be discussed in the next section.
For most of the instruments (see Table 1), each measure-ment consists of the average of a reverse scan followed by a forward scan (total time: 272 s). Consequently the SZA is simply calculated from the time stamp logged with the data, which corresponds to the turnaround time between the pair of scans. However, for the older UVM instrument (Lauder), which measures the spectral irradiance doing a single for-ward scan only, the SZA stamp corresponds to the centre of the scan, at wavelength 370 nm. A correction of 65 s was applied to the instrument time stamp in order to make it cor-respond to the measurement at 310 nm (which approximates the effective wavelength for UVI), and SZA was recalculated
2822 J. Badosa et al.: Measured and modelled UV under clear skies at four sites
Table 3. Uncertainties of measured UVI with NIWA spectroradiometers. All uncertainties quoted are at the 2σ level.
Associated uncertainty Uncertainty in UVI (± %)
For SZA<80◦ Irradiance calibration NIST uncertainty 3.0 Transfer to lamp 2.0 Transfer to spectroradiometer 1.5 Stability ±2% 2.0 PTFE temperature (*) ±10◦C 2.0 Wavelength alignment accuracy in UVA ±0.01 nm 0.5
From non linearities ±0.02 nm 1.0
Cosine response ±0.02 (for SZA<65◦) 2.0
Levelling ±0.02◦ <0.2
Time stamp 10 s <0.2
Photon noise <0.1
Total Uncertainty (RSS) 5.4
* This error will be significantly reduced in future analyses when PTFE sensitivity is known and temperature is logged.
Fig. 1. Left panel: Clear-sky measured UVI for the four sites as a function of day, representing the considered datasets for this study.
Availability of TOZ from TOMS and Dobson is shown through horizontal and vertical dashes, respectively. No UVI measurements were available from day 110 to 165 of 2000 in Boulder (hatched zone). Right Panel: Corresponding histogram of SZA.
using the incorporated routines in TUV 4.1. It is estimated that an error of about 1 min in the time leads to maximum errors about ±0.2◦in SZA for Lauder which corresponds to
an error in UVI up to 3% at 75◦of SZA.
The ground level in the model was usually specified as the altitude of each site (see Table 1). However, in the case of Mauna Loa Observatory, the ground level was set to 2.4 km and the output was taken from 1 km above as one way of tak-ing into account the multiscattertak-ing between the atmospheric layers underneath and above the measurement site as sug-gested by McKenzie et al. (2001).
The aerosol asymmetry factor g was set constant to 0.7 for all sites as a typical and commonly used value (Madronich, 1993). The wavelength dependence of aerosol scattering ( ˚Angstr¨om’s alpha) was estimated for Lauder and Melbourne by calculating the slope between the AOD measured at 412, 500 and 778 nm. Values from 0.59 to 2.2 for Lauder and from 0.35 to 1.8 for Melbourne were found for the days of study. The mean values and their standard deviation were 1.4±0.3 and 1.1±0.4, respectively. However, for Boulder and Mauna Loa, AOD measurements were available at one single wave-length only. A decision was made to set alpha constant to 1.4 for all the modelling cases and sites.
The aerosol profile was considered the same way for all the sites, with the AOD distributed in the first kilometre above the altitude level, as a simplification of the boundary layer. Other options of vertically distributing AOD have been dis-cussed elsewhere (e.g. Badosa et al., 2005).
The uncertainties associated with the above decisions are discussed in Sect. 4.2.
4.1 Modelling cases
Fifteen modelling cases were considered, by changing the way that TOZ, AOD, SSA, OP, TP and galb were introduced into the model. Table 4 summarises the modelling conditions and the number of days and data points involved in each case (noted as TUV(i), where “i” represents the case). In fact, one can think of the fifteen modelling cases as five sets of cases, where the three different sources of ozone (TOZT, TOZD
and TOZS)are considered. These different modelling
op-tions allow study the separate effects of a wide diversity of input information that is usually not available together.
The five sets of cases are variations of the first set (TUV(1,2,3)), for which aerosol influence is accounted in the modelling, SSA is set to 0.9 as a reasonable value (Madronich, 1993), the OP and TP are set as default (from USSA) and galb=0.05 is considered (typical for snow-and-sand-free surfaces). Among these, TUV(2) is taken as the base case. TOZD is preferred to TOZT , even though
avail-ability of the former is more limited, mostly because the lat-ter has important errors for high altitude sites; this becomes relevant in the present study (see discussion below). Dif-ferences in the input information (TOZ, AOD, SSA, OP, TP
and galb) and output (UVI) relative to base case TUV(2) are analysed next.
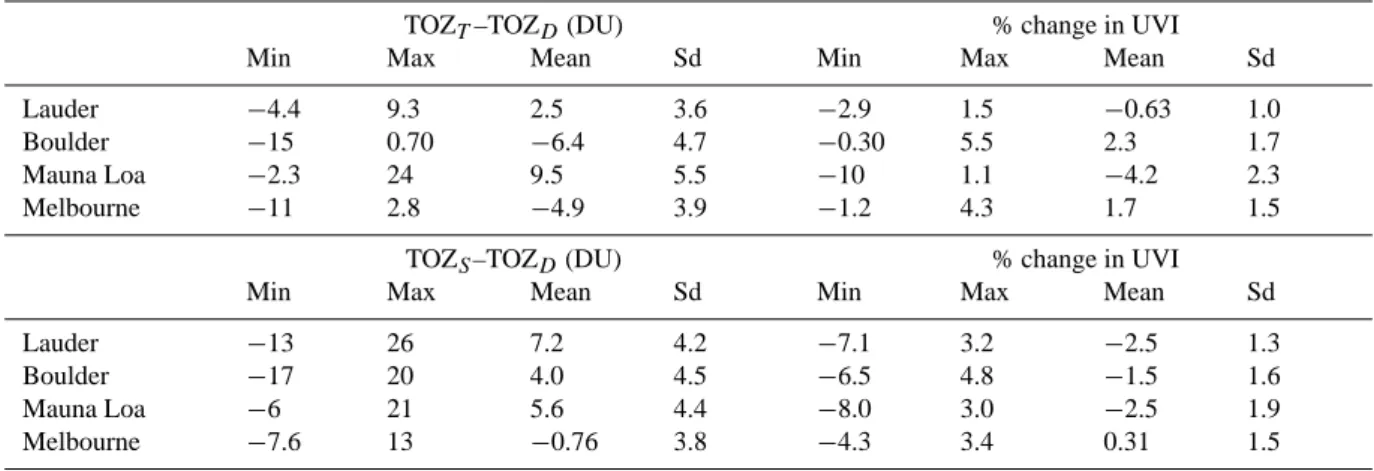
4.1.1 TOZ
Figure 2 shows the absolute differences of TOZ from the three sources and the associated relative difference in the modelled UVI against TOZD. The statistics of these
differ-ences are summarised in Table 5. Significant divergdiffer-ences are found, with TOMS measuring significantly larger TOZ for Mauna Loa (9.5 DU in average), but lower for Boulder and Melbourne (−6.4 and −4.9 DU, respectively) and slightly higher for Lauder (+2.5 DU). The maximum differences are +24 DU (in Mauna Loa) and −15 DU (in Boulder). These large differences are related to an error in the assigned alti-tude value for these sites due to the averaged altialti-tude con-sidered in the TOMS footprints (see Table 2 and its discus-sions in McKenzie et al., 1991). In terms of modelled UVI, differences down to −10% in Mauna Loa and up to 5.5% in Boulder are found when TOZT is used instead of TOZD
in the model. These differences are smaller for Lauder and Melbourne. Larger TOZT–TOZD differences are expected
to be associated with larger dependencies of the differences in UVI as a function of SZA. The mean TOZS–TOZD
differ-ences are positive for Lauder, Boulder and Mauna Loa and not significant for Melbourne. The maximum changes are
−17 DU (for Boulder) and +26 DU (for Lauder). In terms of UVI, mean changes are down to −2.5 % for Lauder and Mauna Loa and less important for Boulder and Melbourne. The range of differences is −8.0% to 4.8%. The largest dis-persions (i.e. standard deviation (SD) values) are found in Mauna Loa and Boulder. Unlike the comparison between TOZD and TOZT, the latter differences should not be
con-sidered as an evaluation of the accuracy of TOZS (they are
less accurate), but rather as an estimation of the deviations in UVI expected when real daily variations in TOZ are consid-ered (as seen in Fig. 2). TOZD(like TOZT)is measured near
noon and considered constant for the whole day in this study whereas TOZSis estimated for each record. This means that,
unlike the TOZT vs. TOZD comparison, the TOZS–TOZD
differences are highly dependent, for example, on the range of SZA considered.
On average, the daily TOZS range is 11±5.4 DU (the
in-terval is given by one standard deviation of the mean) for Lauder, 7.6±6.0 DU for Boulder, 4.7±2.7 DU for Mauna Loa and 12±2.0 for Melbourne. The maximum TOZS
vari-ation, 28 DU, was found for day 63 in Boulder, as noted in Fig. 2 (this day will be studied in detail later). As seen in the right panel of Fig. 2, these daily TOZ variations can lead to UVI changes up to 9% in one day.
4.1.2 AOD and SSA
The AOD measurements (see Table 2) at the shortest wavelength available at each site (412 nm for Lauder and
2824 J. Badosa et al.: Measured and modelled UV under clear skies at four sites
Table 4. Fifteen modelling cases considered for this study. Considered TOZ, AOD, SSA, OP, TP and galb conditions for each case are
collected together with the number of days and data points considered for each case. The availability of estimated TOZ from each source rules the differences in the number of data points and days considered for each case. Particular cases TUV(10) to TUV(15) correspond to tested modelling conditions that were rejected for this study.
Case Number of days (data points)
TUV(i) TOZ AOD SSA OP&TP galb Lauder Boulder Mauna Loa Melbourne
1 TOZT Yes 0.9 USSA 0.05 30 (551) 23 (370) 86 (1812) 11 (241)
2 TOZD Yes 0.9 USSA 0.05 26 (477) 16 (273) 72 (1524) 11 (241)
3 TOZS Yes 0.9 USSA 0.05 31 (569) 23 (370) 98 (2034) 11 (241)
4 TOZT 0 – USSA 0.05 30 (551) 23 (370) 86 (1812) 11 (241)
5 TOZD 0 – USSA 0.05 26 (477) 16 (273) 72 (1524) 11 (241)
6 TOZS 0 – USSA 0.05 31 (569) 23 (370) 98 (2034) 11 (241)
7 TOZT Yes 0.7 USSA 0.05 30 (551) 23 (370) 86 (1812) 11 (241)
8 TOZD Yes 0.7 USSA 0.05 26 (477) 16 (273) 72 (1524) 11 (241)
9 TOZS Yes 0.7 USSA 0.05 31 (569) 23 (370) 98 (2034) 11 (241)
16 TOZT Yes 0.9 Sonde 0.05 30 (551) 23 (370) 86 (1812) 11 (241)
17 TOZD Yes 0.9 Sonde 0.05 26 (477) 16 (273) 72 (1524) 11 (241)
18 TOZS Yes 0.9 Sonde 0.05 31 (569) 23 (370) 98 (2034) 11 (241)
19 TOZT Yes 0.9 USSA 0.02 30 (551) 23 (370) 86 (1812) 11 (241)
20 TOZD Yes 0.9 USSA 0.02 26 (477) 16 (273) 72 (1524) 11 (241)
21 TOZS Yes 0.9 USSA 0.02 31 (569) 23 (370) 98 (2034) 11 (241)
Table 5. (Upper) Minimum, maximum, mean and standard deviation for the comparison between TOZT and TOZDin terms of TOZ and
percentage change in modelled UVI (TUV(1)–TUV(2)) from Fig. 2. (Lower) The same information but for TOZS and TOZD (TUV(3)–
TUV(2)) is shown.
TOZT–TOZD(DU) % change in UVI
Min Max Mean Sd Min Max Mean Sd
Lauder −4.4 9.3 2.5 3.6 −2.9 1.5 −0.63 1.0
Boulder −15 0.70 −6.4 4.7 −0.30 5.5 2.3 1.7
Mauna Loa −2.3 24 9.5 5.5 −10 1.1 −4.2 2.3
Melbourne −11 2.8 −4.9 3.9 −1.2 4.3 1.7 1.5
TOZS–TOZD(DU) % change in UVI
Min Max Mean Sd Min Max Mean Sd
Lauder −13 26 7.2 4.2 −7.1 3.2 −2.5 1.3
Boulder −17 20 4.0 4.5 −6.5 4.8 −1.5 1.6
Mauna Loa −6 21 5.6 4.4 −8.0 3.0 −2.5 1.9
Melbourne −7.6 13 −0.76 3.8 −4.3 3.4 0.31 1.5
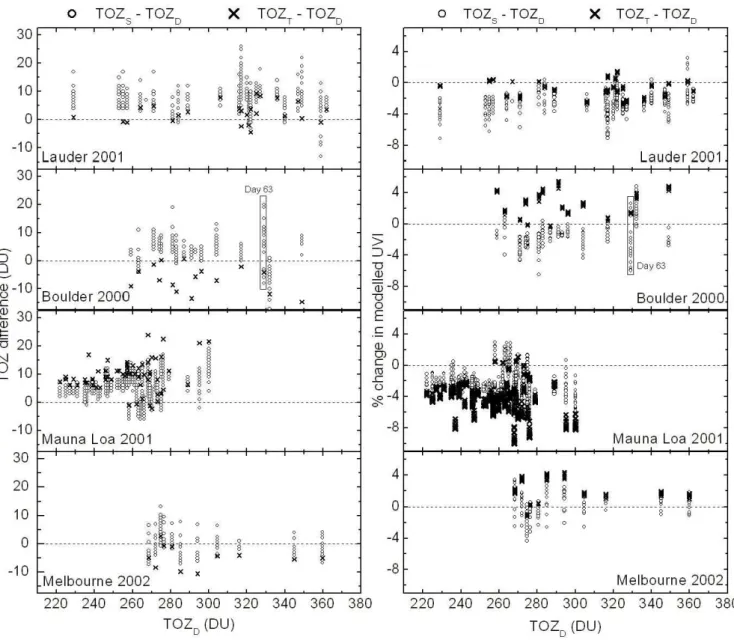
Melbourne, 415 nm for Boulder and 367 nm for Mauna Loa) were considered and converted to those at 368 nm (using an alpha of 1.4 for all sites). Quality controls were applied to these measurements based on the visualization of the data against time which leaded us to reject 1.8% of the records for Mauna Loa, where the optical depths were unreasonably large. Figure 3 shows the histograms of remaining AOD val-ues. None of the sites can be considered as highly-polluted; the sites with larger aerosol load are Boulder and Melbourne (with mean AOD 0.074 and 0.088, respectively) and the most pristine was Mauna Loa (0.019). The mean AOD for Lauder is 0.06. The maximum AODs are: 0.16 for Lauder, 0.23
for Boulder, 0.07 for Mauna Loa and 0.18 for Melbourne. Figure 3 also shows histograms of the daily ranges in AOD. Lauder and Mauna Loa have a very low AOD variation, with ranges mostly smaller than 0.02. The AOD variabil-ity is much higher in Boulder, being up to 0.16 (day 63). Melbourne is intermediate, with a maximum range of 0.1. Since for Lauder and Melbourne only two AOD estimations (a.m./p.m.) are available for each day, the AOD daily vari-ability here shown for these sites will be less representative than for Boulder and Mauna Loa, for which 1-min measure-ments are used.
Fig. 2. Left panel: Differences in ozone measurements: TOZT–TOZD(crosses) and TOZS–TOZD(circles) in DU for the datasets in Fig. 1.
Right Panel: Relative differences (in %) in calculated UVI from using TOZT (crosses) and TOZS(circles) instead of TOZDas input to the
model.
Figure 3 also shows the effect on modelled UVI of not considering aerosols in the model and considering SSA=0.7, through the ratios TUV(5)/TUV(2) and TUV(8)/TUV(2), re-spectively. Accidentally, the differences for TUV(5) and TUV(8) appear to be almost symmetric (i.e. similar differ-ences but with opposite sign). These values are up to 9–13% except for Mauna Loa, for which maximum differences are about 3% due to the much lower AOD found there. We note (from Fig. 3) that the uncertainty in SSA (from 0.9 to 0.7) leads to an uncertainty in the effect of aerosols in UVI up to 11%.
4.1.3 OP and TP
Ozone sondes are available from each site with typically weekly operational frequency (see Table 2). For Mauna Loa, ozone sondes are taken from Hilo (19.75◦N, 155.25◦W,
370 m above sea level), located at the foot of Mauna Loa vol-cano. The closest sonde to each studied day was used for modelling cases TUV(16,17,18). The maximum lag was 4 days for Lauder and Boulder and 12 days for Melbourne due to a failed launch. For Hilo, maximum lags would have been about 9 days, except that from day 239 to 319 there were no ozone sondes available, leading to a maximum lag of 41 days. This lack of profile data is less critical than for the
2826 J. Badosa et al.: Measured and modelled UV under clear skies at four sites
Fig. 3. Left panel: Histograms of AOD at 368 nm (in black) and its daily range (in white) for the datasets in Fig. 1. Right panel:
TUV(i)/TUV(2), for i=5 (no aerosols, circles), and i=8 (SSA=0.7, squares).
other sites, since the atmosphere above Mauna Loa is less changeable and measured changes in OP and TP are smaller. For the modelling, sonde OP and TP were re-gridded and smoothed to 2 km steps (the same way as TUV considers the USSA OP and TP). Since sondes only reach altitudes of 30–35 km, the measured OP and TP were filled to 80 km using the USSA profiles as a base. As for the USSA OP, the sonde OPs were renormalized to the TOZ for the mod-elling. Figure 4 shows the effect of using the measured OP and TP instead of the USSA profiles. The effect on UVI is less than 2.5% for SZA≤75◦for all sites. Unexpectedly, the USSA profiles work similarly (or even slightly better for low SZA) at Lauder and Melbourne than at Boulder or Mauna Loa. One might have expected it to work better in the North-ern Hemisphere since USSA was based on USA data. Two extra columns of plots are shown in order to assess the ef-fect of changing OP and TP separately. Almost all the
de-pendence on SZA comes from changing OP. In particular the tropospheric/stratospheric ozone ratio seems to be impor-tant (Br¨uhl and Crutzen, 1989). Mauna Loa shows similar SZA dependences for all days, while more diverse patterns are found for the other sites, especially for Boulder. The change in TP acts as an almost constant factor which is in-dependent on SZA. Furthermore, we found that this factor is very well correlated with the mean temperature difference (from the altitude level to 80 km) between the USSA and the sonde TPs scaled by the OP (either from USSA or sonde); each 10 K increase (decrease) of this scaled mean tempera-ture leads to a decrease (increase) of 2% in the calculated UVI. This corresponds to the strong temperature dependence of the ozone absorption cross section (Molina and Molina, 1986). Further discussion about the dependencies of spectral UV global irradiance on ozone and temperature profiles can be found in Schwander et al. (1997). Figure 5 shows two
Fig. 4. Calculated effect on modelled UVI of using measured profiles of ozone and/or temperature, compared with using the USSA profiles
for the datasets in Fig. 1. Plots are restricted to SZA≤75◦. Column 1: measured OPs and TPs are used. Column 2: measured OPs, but USSA
TPs. Column 3: measured TPs, but USSA OPs.
extreme examples of the combined effect of changing both OP and TP: day 173 in Boulder and day 18 in Mauna Loa. OP and TP from USSA and the sondes are plotted and the corresponding ratios from Fig. 4 are shown again.
4.1.4 galb
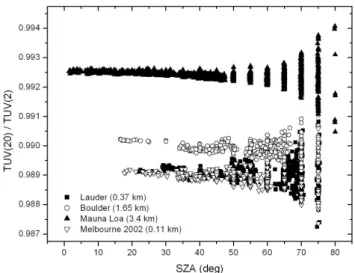
The ground albedo was changed from 0.05 to 0.02 since the latter might be more realistic for some sites or/and periods, such as for some kind of grass, trees, etc. (Madronich, 1993; McKenzie et al., 1996). Figure 6 shows the impact of this change through the ratio TUV(20)/TUV(2) as a function of
SZA. The effect is about 1% in UVI and it becomes less im-portant as altitude increases due to the less air above to take part in the ground-atmosphere multiple scattering. At larger SZA the dispersion increases (up to ±0.2%).
4.2 Uncertainties associated with the UVI modelling There are many sources of uncertainties associated with the radiative transfer modelling. There are intrinsic uncertainties (e.g. simplifications assumed for the radiative transfer calcu-lation, the parameterisations of the cross sections, geomet-ric simplifications to the phase function etc.). Additionally,
2828 J. Badosa et al.: Measured and modelled UV under clear skies at four sites
Fig. 5. Left panel: USSA profiles and measured OP and TP from 0 to 50 km for day 173 in Boulder and day 18 in Mauna Loa. Shaded regions
show the parts of the profiles underneath the altitude level of each site. Right panel: Relative change in modelled UVI from considering measured OP and USSA TP (open circles), USSA OP and measured TP (T) and measured OP and TP (solid circles) in relation to case TUV(2) (USSA OP and TP).
Fig. 6. Relative change in the calculated UVI caused by
chang-ing galb from 0.05 (TUV(2)) to 0.02 (TUV(20)) for the datasets in Fig. 1.
uncertainties in the input information also propagate through to uncertainties in derived irradiances. When input param-eters are well known, the estimated uncertainty in modelled UVI is about ±5%, as discussed above from the study by Koepke et al. (1998).
In this study, the ˚Angstr¨om exponent alpha is set constant to 1.4 for all modelling cases considered. A sensitivity study was carried out for Boulder, since the largest AODs are found at this site. An uncertainty of ±1 in alpha (i.e., 0.4 to 2.4), which seems reasonable at least for Lauder and Melbourne, was assumed. This lead to a maximum change in the cal-culated UVI (relative to the calculation with alpha=1.4) of
±3%. This can be taken as a maximum uncertainty from alpha in this study.
In addition, the uncertainty of setting g=0.7 must be also taken into account. Badosa et al. (2005) showed that an un-certainty of about 0.1 units in g leads to an unun-certainty of about 1% in UVI.
The uncertainty associated to the aerosols profile consid-ered was estimated by changing the vertical AOD distribu-tion from the ground level to 3 km above it. The AOD was set to 0.23 at 368 nm, which is the extreme value found for this study. Also the more realistic aerosol profile proposed by Ba-dosa et al. (2005) was considered. It was found that changes in calculated UVI were always less than 1% for SZA from 0 to 75◦. Larger uncertainties from the AOD profile choice
should be expected for more polluted sites.
Concerning the case of using TOZSas input to the model,
there is a degree of circularity for the model-measurement comparison since the ozone has been derived from the same
instrument as the UVI measurements However, the ozone derivation is based only on the ratio of irradiances at two wavelengths (305/340 nm) and has low dependence on the absolute values of UVI being reported here. Further, the ozone amounts derived agree well with those from other sources for which there is no circularity, and at these sites they are generally the only means of continuously tracking the effects of ozone changes through the day.
On clear days, several Dobson measurements are some-times available. However, the frequency of observations is lower than from the spectrometer. A typical example, for a day in which significant ozone changes occurred, is shown in Fig. 7. On this day (Boulder day 63, year 2000) the ozone column amount reduced by ∼20 DU over a 5-h period, as shown by both measurement methods. The noise levels, in-dicated by shorter term changes, are significantly lower in the UV spectrometer data than in the Dobson data. The UV spec-trometer results showed also that this trend continued over the early morning and late afternoon periods as well, which is also reflected in the progression of daily satellite-derived ozone from 356 DU on the previous day to 314 DU on the following day. Observations retrieved from the spectrometer are systematically higher by approximately 2%. An increase of 2% in the ozone translates to a decrease in modelled ery-themally weighted UV of approximately 2.4%.
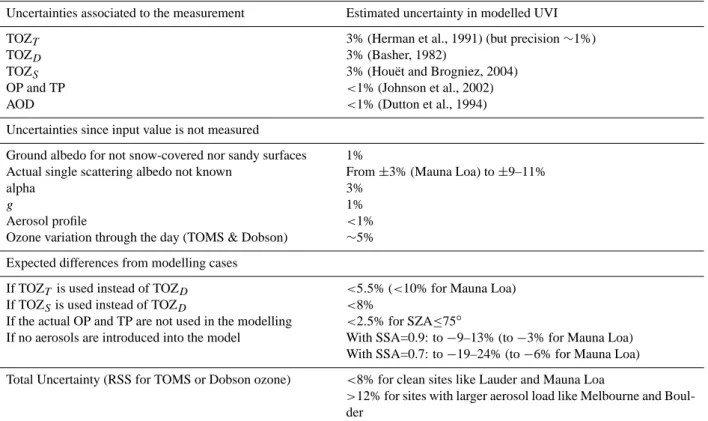
Table 6 summarizes the uncertainties in calculated UVI arising from the uncertainties associated to the inputs. In ad-dition, the expected differences in UVI from different input choices are shown as a summary of the results from Sect. 4.1. The largest potential uncertainties are associated with un-certainties in ozone and aerosol information. In particular, lack of knowledge about SSA of the aerosols becomes a ma-jor source of uncertainty in the modelling.
5 General model-measurement comparisons
All fifteen modelling cases have been compared with the UVI measurements for the four sites. Figure 8 shows his-tograms of modelled – measured relative differences in UVI, for TUV(2) and all the variations of this base modelling case. With TUV(2), similar average agreements are found for Lauder, Boulder and Mauna Loa, with model overestima-tions from 2.0 to 2.8%. For Melbourne, much larger overesti-mation is found (9.0%). When considering TOZT (TUV(1))
and TOZS(TUV(3)), mean agreements change in accordance
with those expected from Table 5. This leads to much more diverse comparisons when using TOZT. Best agreements for
Lauder, Boulder and Mauna Loa together are found when us-ing TOZS, with model-measurement differences within 5%
for 90%, 77% and 98% of the data, respectively. Actu-ally, for the comparisons for all the cases that consider the aerosol contribution and TOZS, mean agreements of 0.1–3%
are found, depending on the value of SSA. Overestimations remain large for Melbourne. When no aerosols are
consid-Fig. 7. Comparison between TOZ measurements with Dobson
spec-trophotometer and from the spectral measurements for day 63 of 2000 in Boulder. Error bars account for the ±3% uncertainty from each source (as from Table 6).
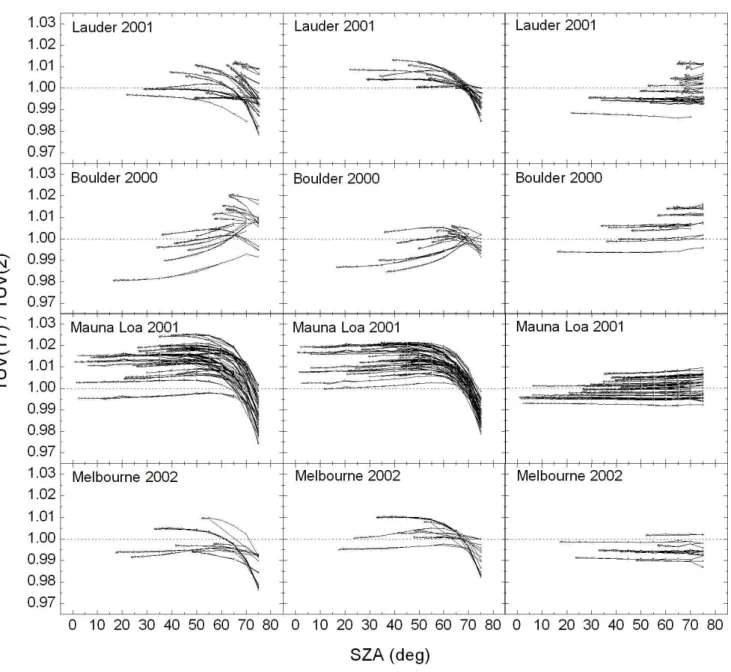
ered in the model (TUV(5)), the model overestimations in-crease from +0.8%, for Mauna Loa, to +3–4% for the other sites, in comparison with TUV(2). Similar changes, but with opposite sign are found when SSA is set to 0.7 (TUV(8)), which was expected from results shown in Fig. 3. For Mel-bourne, the best agreement (an overestimation of 4.8%) is found when considering SSA=0.7. The effect of considering measured OP and TP (TUV(17)) is very small for all sites except for Mauna Loa, for which mean model-measurement differences increase by 1.1%, showing consistency with what is seen in Fig. 4. Setting galb to 0.02 (TUV(20)) has the ex-pected decreasing effect on the model of about −1%.
The dispersion of histograms also provides information of the model-measurement comparison. To quantify this, the SD can be used (see Fig. 8). Lowest SD values are found for Mauna Loa, followed by Lauder, Melbourne and Boulder. This order is in agreement with mean AODs found at each site, showing that clean sites are easier to model than polluted sites.
When no aerosols are considered, SD values significantly increase for all sites, except for Mauna Loa where aerosol effects are small. When SSA is 0.7, highest SD are found for Lauder; for Boulder SD slightly decrease; and for Mauna Loa and Melbourne SD are similar to those for TUV(2). For Mauna Loa, the largest increase in SD occurs when consider-ing TOZT; showing that, at this site, ground-based
measure-ments of ozone should be preferred over the TOMS ozone data.
The range of differences (i.e. max–min) is about 19% for Lauder and Melbourne, 25% for Boulder and 14% for Mauna Loa for TUV(2) and slightly change depending on the mod-elling case. Largest ranges of differences are found when no aerosols are considered for the modelling.
2830 J. Badosa et al.: Measured and modelled UV under clear skies at four sites
Fig. 8. Histograms of model-measurement relative differences for all sites and modelling cases TUV(1,2,3,5,8,17,20). Mean differences plus
minus their standard deviations are shown for each case.
Table 6. Uncertainties in modelled UVI. Unless otherwise stated, all uncertainties quoted are at the 2 σ level.
Uncertainties associated to the measurement Estimated uncertainty in modelled UVI
TOZT 3% (Herman et al., 1991) (but precision ∼1%)
TOZD 3% (Basher, 1982)
TOZS 3% (Hou¨et and Brogniez, 2004)
OP and TP <1% (Johnson et al., 2002)
AOD <1% (Dutton et al., 1994)
Uncertainties since input value is not measured
Ground albedo for not snow-covered nor sandy surfaces 1%
Actual single scattering albedo not known From ±3% (Mauna Loa) to ±9–11%
alpha 3%
g 1%
Aerosol profile <1%
Ozone variation through the day (TOMS & Dobson) ∼5%
Expected differences from modelling cases
If TOZT is used instead of TOZD <5.5% (<10% for Mauna Loa)
If TOZSis used instead of TOZD <8%
If the actual OP and TP are not used in the modelling <2.5% for SZA≤75◦
If no aerosols are introduced into the model With SSA=0.9: to −9–13% (to −3% for Mauna Loa)
With SSA=0.7: to −19–24% (to −6% for Mauna Loa)
Total Uncertainty (RSS for TOMS or Dobson ozone) <8% for clean sites like Lauder and Mauna Loa
>12% for sites with larger aerosol load like Melbourne and
Boul-der
Fig. 9. Left panel: Regression plot of Modelled (TUV(2)) versus Measured UVI for four sites. Statistic parameters for regressions are shown.
Right panel: Measured UVI/TUV(2) as a function of SZA and local time.
The comparison between measured UVI and the mod-elling base case for the four sites is shown in detail in Fig. 9. From the TUV(2) vs. measured UVI plot, regression coeffi-cients approaching unity are found in particular for Lauder and Mauna Loa, for which the points are very well aligned (R>0.999). The regression slopes (B) show diverse TUV(2) overestimations of the measurements, which are slightly dif-ferent from the mean relative model-measurement differ-ences shown in Fig. 8; this corresponds to the greater weight-ing from points with higher UVI for the linear fit. The standard deviations, normalised to the mean measured UVI (called rSD), show more dispersion around the fitted line for Boulder and Melbourne than for Lauder and Mauna Loa, which is consistent with the dispersions seen in Fig. 8.
Also, the ratio of measured UVI over TUV(2) (hereafter called R2) are shown against SZA and time in Fig. 9. Several daily evolutions of R2 can be identified both as a function of SZA and time. In average, the daily change of R2 is about 0.05 (5%) for all sites except for Mauna Loa, for which this is about 0.03 (3%). This is in agreement with the lower TOZ
and AOD daily variations found for this site. Maximum daily range of R2 is 10% for all sites. Factors that contribute to these daily variations including marked outliers are discussed next.
6 Daily evolutions
6.1 TOZ and AOD daily evolutions
The largest observed daily variations in the model/measurement ratios are mainly associated with large diurnal changes in TOZ (which are not taken into account for TUV(2)). Also, if the aerosol properties consid-ered in TUV(2) are not accurate (such as errors in SSA), this would lead to errors that are dependent on AOD and SZA. A good example of these two factors acting together is found in day 63 in Boulder. This day registered both the largest daily variations in TOZS(28 DU) and AOD (0.16) among all
days from all sites considered in this study. Figure 10 shows the measured UVI, TOZS, and AOD as a function of time
2832 J. Badosa et al.: Measured and modelled UV under clear skies at four sites
Fig. 10. Upper panel: Measured UVI on day 63 in Boulder as a
function of time. Open squares were rejected from the study due to lack of AOD measurements for those times. Center panel:
Con-current TOZS and AOD as a function of time. Lower panel:
rel-ative differences between UVI model and measurement for mod-elling cases TUV(2,3,6,8,9) as a function of time.
on this day. Despite this being a completely clear day some points were rejected from the study since the AOD was not available. Relative differences between TUV(2) (SSA=0.9 and TOZD=329 DU) and measured UVI (hereafter called
D2: representing the difference between measurements and model case TUV(2)) are plotted as a function of time in the lower panel of Fig. 10. In this case, there is an important overestimation by the model. However, a small daily variation of the relative differences is found (values range from 8.8 to 11.9%) due to compensation between the TOZ and aerosol effects. In order to see separately the effects of not considering aerosols and not considering the daily evolution of TOZ, cases TUV(6) (no aerosols, TOZS)
and TUV(8) (SSA=0.7, TOZD)are considered, respectively.
From the former, important model-measurement differences are found, with D6 changing from 9.0 to 27.2% through the day; from the latter, D8 goes from 7.9% down to −1.9% due to not considering changes in TOZ. The choice of SSA at 0.7 seems to work best, as is apparent from a comparison of the analyses of the results using TUV(3) (SSA=0.9, TOZS)
and TUV(9) (SSA=0.7, TOZS). With the former, the relative
difference (D3) increases through the day from 5.1 to 12.7%. In contrast, with the latter, a much better agreement is found
together with a low daily variation of the difference (D9), which changes from 0.13 to 2.8%. So it seems that for this day, the SSA was more likely to be around 0.7 than 0.9. Recall that TOZS values are not fully independent of the
UVI measurements, so they are in some degree affected by the circularity issue, as discussed through Fig. 7. Also, a better understanding about the effects of changing aerosol and TOZ characteristics on the UV irradiances would be obtained from detailed spectral analyses.
6.2 Effect of snow
Day 361 in Boulder is also worth discussing, as it is an outlier (see Fig. 9). For this day the UVI measurements are larger than TUV(2) by 14.5% in the morning, and by 8.2% in the afternoon. These changing enhancements in measured UVI were caused by the increase in ground albedo due to snow that partly melted through the day. It has been shown pre-viously that snow cover can lead to substantial increases in UVI (McKenzie et al., 1998). As an outlier, this day has an important contribution to the statistics reported in Fig. 8 for Boulder. If it is excluded from the statistics for TUV(2), although the mean UVI model-measurement difference in-creases to 2.6%, the SD dein-creases to 4.1% and the range of differences decrease (from 25%) to 16.2%. This makes Boul-der more similar to Melbourne in terms of the SD values and the range of differences.
6.3 PTFE temperature effect
In Lauder, for some days around summer we detected a step-change in measured UVI of 2–3% around noon. Figure 11 shows measured and modelled (case TUV(2)) UVI and their ratio (R2) as a function of time for six days around summer. This was found to be related to an increment in transmit-tance of the PTFE diffusers used in the spectroradiometers as the temperature changed from about 15 to 21◦C. This ef-fect was first demonstrated in a laboratory study by Ylianttila and Schreder (2005). Using the data from this current work, McKenzie et al. (2005) demonstrated this effect both for sky irradiance measurements and in the laboratory, for the PTFE diffusers used in NIWA spectroradiometers. Evidence of this effect in the field was shown there through a particular case (day 66) and the averaged step from the same six days (the ones in Fig. 11) as a function of air temperature. Here the data from each of these days are shown separately. The air temperature and wind speed are plotted together with R2 for each day. A 2–3% step in R2 that occurs around a tempera-ture of 20◦can be observed for each day. There is no obvious relationship between this effect and wind speed. For the days under study, TOZ and AOD showed low variability around noon; maximum variations from 10:00 to 14:00 NZST were 3 DU and 0.01 in AOD.
To see this effect more clearly, Fig. 12 shows R2 against air temperature, in which the interval of temperatures of interest
Fig. 11. UVI model vs. measurement comparison for six days of 2001 in Lauder for which air temperature clearly exceeded 20◦C and diurnal variations in TOZ and AOD were small. Upper: Measured (circles) and modelled (crosses) UVI as a function of time. Lower: Measured over modelled UVI ratio (triangles), air temperature (solid line) and wind speed (dashed line) as a function of time.
is shaded. Despite the noise found at this 1–2% level of de-tail, the step can be clearly seen. For days 309, 310, 311 and 347 the steps occur in the shaded region and reverse when temperature decreases. For days 52 and 66 there seems to be a shift of this effect to higher temperatures. For these days there was a very rapid increase of the air temperature over the period when the step takes place (see Fig. 11). Probably, the diffuser needed more time to adapt to the ambient tempera-ture and could not follow it. Note too that air temperatempera-ture may not match the actual diffuser temperature.
As the observed temperature effect is small it can only be detected in very stable conditions, with low aerosol and ozone variability and with all supporting data available for the radiative transfer modelling. Lauder meets these require-ments. In Boulder and Melbourne there is larger aerosol vari-ability and this effect does not show so clearly there. For Mauna Loa, air temperature never exceeded 16.3◦C for the period studied. Although the diffuser could be warmer than this by a couple of degrees or so (based on measurements at Lauder), clear evidence of the effect was not observed be-cause another factor must be considered at this site, as dis-cussed next.
6.4 Effect of clouds built-up underneath
Mauna Loa Observatory is situated on a face of the volcano at 3.4 km above sea level, and there are many clear-sky days in which clouds build-up beneath the site during the day, mostly
in the afternoon. This leads to enhancements in measured UVI caused by the increase of the effective albedo of the un-derlying surface. In Fig. 9, a larger dispersion of R2 is found in the afternoon than in the morning due to these cloud-induced enhancements. On day 210 (identified in Fig. 9) this effect is largest. Figure 13 shows the measured UVI, TUV(2) and R2 as a function of time. An increase of about 9% in the R2 ratio is seen from mid-morning to mid-afternoon. TOZS
did not change much that day, from 272 to 278 DU, and AOD was very low (from 0.010 to 0.013). Webcam images fac-ing volcano Mauna Kea (see Table 2) showed evidence that clouds were building-up during this day. From inspection of webcam images from other days with clouds underneath the site, different types of clouds were seen corresponding to different enhancements in UVI. It seems that broken cu-muliform clouds were more effective in reflecting UVI than stratiform clouds. However, since the field of view of those images is quite limited, it is difficult to unequivocally estab-lish conclusive relations.
6.5 Model overestimations for Melbourne
For Melbourne, large overestimations of the model over the measurements have been found, as discussed above. Day 326 (marked in Fig. 9) was the day for which the model-measurement agreement was worst among all the days con-sidered in this study. On this day, low AOD was measured and it did not change much through the day (the AOD at
2834 J. Badosa et al.: Measured and modelled UV under clear skies at four sites
Fig. 12. From days represented in Fig. 10, measured over modelled
UVI as a function of air temperature. The range of temperatures for which the PTFE temperature effect is expected to occur (15 to
21◦C) is shaded.
368 nm was 0.070 in the morning and 0.073, in the after-noon). TOZT was 300 DU, TOZD was 305 DU and TOZS
ranged from 300 to 307 DU, showing good agreement be-tween the three sources of ozone data, and not much daily TOZ variation. Some data in midmorning and around noon did not pass the clear sky filter since the deduced cloud frac-tion rose to 7%. Figure 14 shows the measured UVI together with TUV(2,5,8) and their relative differences (in percent) as a function of time. When considering TUV(2), overestima-tions from 14 to 22% were found. If no aerosols were consid-ered (TUV(5)), these became from 17 to 26% and when SSA was set to 0.7, the model-measurement differences slightly improved (they were from 11 to 18%). Maximum absolute differences are 1.45 in UVI for TUV(2), 1.69 for TUV(5) and 1.17 for TUV(8). UVI modelled for day 326 is very sim-ilar to UVI modelled for day 43 (also marked in Fig. 9) due
Fig. 13. Measured (circles) and modelled (crosses) UVI, and their
ratio (triangles) for day 210 of 2001 in Mauna Loa. Open triangles account for data that was initially excluded from the study because AOD measurements were missing. Modelling for this period has been done using an AOD of 0.011 (AOD for that day ranged from 0.010 to 0.013) so to have an estimation of the increase in UVI measurements that happened around noon.
Fig. 14. Upper panel: UVI measurements and calculations for
Mel-bourne (day 326) for modelling cases TUV(2,5,8) as a function of time. Lower panel: Relative model-measurement differences for the three modelling cases as a function of time.
to the combined contributions of SZA, TOZ, and AOD in calculated UVI. However, measurements for the former are
about 8.5% lower than for the latter and much better UVI model-measurement agreement is found for day 43 (mean agreement is about +4.5%) than for day 326. Therefore, we suspect that there are some issues with either the UVI mea-surements, or the ancillary data that was used as input to the model on this day.
7 Conclusions
This study is one of the most comprehensive UVI model-measurement intercomparisons undertaken so far. It uses state-of-the-art instrumentation, and state-of-the-art radiative transfer modelling incorporating a broad range of ancillary data.
From the general comparisons, best model-measurement agreements have been found when considering both the daily evolutions of TOZ and AOD, for which model and measure-ments agree within 5% for 77% to 98% of the data depend-ing on the site. It is expected that these differences would be larger at more polluted sites, since some of the necessary aerosol parameters are not adequately specified. In this sense we conclude that polluted sites are good to test the mod-elling approach while clean sites are good to test the mea-surements. Worst model-measurement agreements are found when aerosols are not considered for the UVI calculations, leading to deviations up to 27.2%.
However, at Melbourne, which is the only non-NDACC site, and is in a more urban environment, there remain un-explained discrepancies. The measured values are signifi-cantly lower than the calculated values (by ∼5–9%). Some of the discrepancy can be explained if we adopt larger op-tical depths in the UVB region than would be inferred by extrapolating those measured in the UVA/visible region, or if we adopt smaller single scattering albedos for the aerosols in the UVB region. Better knowledge of aerosol properties in the UVB region is needed at this site to fully resolve this discrepancy.
From the comparison of different TOZ sources available, some important discrepancies have been observed between ground based (TOZD)and satellite-based (TOZT)
measure-ments. with peak differences of −15 DU for Boulder and up to 24 DU for Mauna Loa, leading to deviations of 5.5 and
−10% in UVI, respectively. The difference in sign proba-bly results from the differences in surrounding topography. Mauna Loa is higher than the average altitude surrounding area, while Boulder is lower.
There is a degree of circularity in using TOZS as an input
to the model. However, as noted in Sect. 4.2, this is only a small effect, and does not alter the main conclusions of this study.
A major issue with respect to modelling is the uncertainty in the input parameters. Missing knowledge of the SSA is particularly important, and can modify the effect of aerosols on UVI up to 11%. Some sites (such as Lauder) have shown
better results with SSA=0.9 while other (such as Boulder) have shown better results with SSA=0.7.
For sites where clouds build-up underneath (such as Mauna Loa), errors in modelling can be up to 9% if the in-duced increment of the effective albedo is not considered. For the data used in this paper we have found that the daily change in TOZ, if not taken into account through consider-ing one value for the whole day, can introduce an additional uncertainty of about 5% in UVI. Uncertainties associated to other input information such as alpha, OP and TP affect UVI less than 2.5% for SZA≤75◦ and uncertainties of aerosol profile, g, and ground albedo are about 1%.
The major issues with respect to the UV measurements are the long term calibration accuracy and stability. In addi-tion, the temperature effect of the PTFE diffusers was stud-ied in detail having a 2–3% effect in throughput between 15 to 21◦C. This may affect all instruments with fore optics
constructed from PTFE and no temperature stabilisation (i.e. most instruments).
All these considerations make uncertainties associated to the UVI modelling comparable with uncertainties associated to the UVI measurement for clean sites and larger for more polluted sites.
Under cloudy conditions (which represent most of the time in many sites), very much larger errors are expected when modelling since the cloud optical parameters needed as input information are hardly ever available. Under these conditions, the slow-scanning spectrometers are also subject to significant errors. However, unlike the radiative transfer modelling, no overall bias in the measurements would be ex-pected. Nevertheless, until spectrometers with much faster scan rates become available, or integrating spectrographs be-come available, direct measurements of UV with broad band instruments or multi-filter instruments probably provide the most reliable way of estimating UVI under these conditions. Acknowledgements. All the individuals and institutions in Table 2
are gratefully acknowledged for the supply and support of the data used in this study.
We would also like to thank C. Long of Pacific Northwest National Laboratory for the kind assistance and the use of the software for the clear sky selection process.
This work undertaken by the lead author was part of a pre-doctoral scholarship from the Ministry of Universities, Research and Information Society of the Government of Catalonia.
Edited by: A. Hofzumahaus
References
Angstrom, A.: The parameters of atmospheric turbidity, Tellus, 16, 64–75, 1964.
Badosa, J., Gonz`alez, J. A., Calb´o, J., Weele, M. V., and McKen-zie, R. L.: Using a parameterization of a radiative transfer model to build high-resolution maps of typical clear sky UV index in Catalonia, Spain, J. Appl. Meteorol., 44(6), 789–803, 2005.
2836 J. Badosa et al.: Measured and modelled UV under clear skies at four sites
Bais, A. F., Gardiner, B. G., Slaper, H., Blumthaler, M., Bernhard, G., McKenzie, R. L., Webb, A. R., Seckmeyer, G., Kjeldstad, B., Koskela, T., Kirsch, P., Groebner, J., Kerr, J. B., Kazadzis, S., Lesczynski, K., Wardle, D., Brogniez, C., Josefsen, W., Gillotay, D., Reinen, H., Weihs, P., Svenøe, T., Eriksen, P., Kuik, F., and Redondas, A.: SUSPEN intercomparison of ultraviolet spectro-radiometers, J. Geophys. Res., 106, 12 509–12 526, 2001. Basher, R. E.: Review of the Dobson Spectrophotometer and its
Ac-curacy. WMO Global Ozone Research and Monitoring Project: WMO Report No. 13, 1982.
Br¨uhl, C. H. and Crutzen, P. J.: On the disproportionate role of tro-posphere ozone as a filter against solar UV-B radiation, Geophys. Res. Lett., 16, 703–706, 1989.
Calb´o, J., Pag`es, D., and Gonz´alez, J. A.: Empirical studies of cloud effects on UV radiation: a review, Rev. Gephys., 43, RG2002, doi:10.1029/2004RG000155, 2005.
De Backer, H., Koepke, P., Bais, A., de Cabo, X., Frei, T., Gillotay, D., Haite, C., Heikkil¨a, A., Kazantzidis, A., Koskela, T., Kyr¨o, E., Lapeta, B., Lorente, J., Masson, K., Mayer, B., Plets, H., Redondas, A., Renaud, A., Schauberger, G., Schmalwieser, A., Schwander, H., and Vanicek, K.: Comparison of measured and modelled uv indices for the assessment of health risks, Meteorol. Appl., 8, 267–277, 2001.
Dutton, E. G., Reddy, P., Ryan, S., and DeLuisi, J. J.: Features and effects of aerosol optical depth observed at Mauna Loa Hawaii: 1982–1992, J. Geophys. Res., 99, 8295–8306, 1994.
Herman, J. R., Hudson, R., McPeters, R., Stolarski, R., Ahmad, Z., Gu, X.-Y., Taylor, S., and Wellemeyer, C.: A new self-calibration method applied to TOMS and SBUV backscattered ultraviolet radiation data to determine long-term global ozone change, J. Geophys. Res., 96, 7531–7545, 1991.
Herman, J. R., McKenzie, R. L., Diaz, S. B., Kerr, J. B., Madronich, S., and Seckmeyer, G.: Ultraviolet radiation at the Earth’s surface, in: UNEP/WMO Scientific Assessment of the Ozone Layer: 1998 Report No. 44, edited by: Albritton, D. L., Aucamp, P. J., Megie, G., and Watson, R. T., pp. 9.1–9.46, Geneva, WMO Global Ozone Res. and Monit. Proj., 1999.
Hou¨et, M. and Brogniez, C.: Ozone column retrieval from so-lar UV irradiance measurements at ground level: Sensitivity tests and uncertainty estimation, J. Geophys. Res., 109, D15302 doi:10.1029/2004JD004703, 2004.
Johnson, B. J., Oltmans, S. J., V¨omel, H., Smit, H. G., Deshler, T., and Kroger, C.: Electrochemical concentration cell (ECC) ozonesonde pump efficiency measurements and tests on the sensitivity to ozone of buffered and unbuffered ECC sensor cathode solutions, J. Geophys. Res., 107, 4393, doi:10.1029/2001JD000557, 2002.
Kerr, J. B., Seckmeyer, G., Bais, A. F., Bernhard, G., Blumthaler, M., Diaz, S. B., Krotkov, N. A., Lubin, D., McKenzie, R. L., Sabziparvar, A. A., and Verdebout, J.: Surface ultraviolet radia-tion: Past and future. Geneva, World Meteorological Organiza-tion, 2003.
Kneizys, F. X., Shettle, E. P., Gallery, W. O., Chetwynd Jr., J. H., and Abreu, L. W.: Atmospheric Transmittance/Radiance: Com-puter Code LOWTRAN 6, Air Force Geophysics Laboratory, 1983.
Koepke, P., Bais, A., Balis, D., Buchwitz, M., De Backer, H., de Cabo, X., Eckert, P., Eriksen, P., Gillotay, D., Heikkila, A., Koskela, T., Lapeta, B., Litynska, Z., Lorente, J., Mayer, B.,
Re-naud, A., Ruggaber, A., Schauberger, G., Seckmeyer, G., Seifert, P., Schmalwieser, A., Schwander, H., Vanicek, K., and Weber, M.: Comparison of models used for UV index calculations, Pho-tochemistry and Photobiology, 67, 657–662, 1998.
Kylling, A., Bais, A. F., Blumthaler, M., Schreder, J., Zerefos, C. S., and Kosmidis, E.: Effect of aerosols on solar UV irradiances during the photochemical activity and solar ultraviolet radiation campaign, J. Geophys. Res., 103, 26 051–26 060, 1998. Leszczynski, K., Jokela, K., Ylianttila, L., Visuri, R., and
Blumthaler, M.: Erythemally weighted radiometers in solar UV monitoring: results from the WMO/STUK intercomparison, Photochemistry and Photobiology, 67, 212–221, 1998.
Long, C. N. and Ackerman, T. P.: Identification of clear skies from broadband pyranometer measurements and calculation of down-welling shortwave clouds effects, J. Geophys. Res., 105, 15 609– 15 626, 2000.
Madronich, S.: UV radiation in the natural and perturbed atmo-sphere, in: UV-B Radiation and Ozone depletion. Effects on Hu-mans, Animals, Plants, Microorganisms, and Materials, edited by: Tevini, M., pp. 17–69, Boca Raton: Lewis Publishers, 1993. Mayer, B., Seckmeyer, G., and Kylling, A.: Systematic long-term comparison of spectral UV measurements and UVSPEC model-ing results, J. Geophys. Res., 102, 8755–8767, 1997.
McKenzie, R. L., Johnston, P. V., McElroy, C. T., Kerr, J. B., and Solomon, S.: Altitude distributions of stratospheric constituents from ground-based measurements at twilight, J. Geophys. Res., 96, 15 499–15 511, 1991.
McKenzie, R. L., Kotkamp, M., and Ireland, W.: Upwelling UV spectral irradiances and surface albedo measurements at Lauder, New Zealand, Geophys. Res. Lett., 23, 1757–1760, 1996. McKenzie, R. L., Johnston, P. V., and Seckmeyer, G.: UV
spectro-radiometry in the network for the detection of stratospheric change (NDSC), in: Solar Ultraviolet Radiation. Modelling, Measurements and Effects, edited by: Zerefos, C. S. and Bais, A. F., NATO ASI Series 1.52, pp. 279–287. Berlin, Springer-Verlag, 1997.
McKenzie, R. L., Paulin, K. J., and Madronich, S.: Effects of snow cover on UV radiation and surface albedo: a case study, J. Geo-phys. Res., 103, 28 785–28 792, 1998.
McKenzie, R. L., Johnston, P. V., Smale, D., Bodhaine, B. A., and Madronich, S.: Altitude effects on UV spectral irradiance deduced from measurements at Lauder, New Zealand, and at Mauna Loa Observatory, Hawaii, J. Geophys. Res., 106, 22 845– 22 860, 2001.
McKenzie, R. L., Badosa, J., Kotkamp, M., and Johnston, P. V.: Effects of the temperature dependence in PTFE diffusers on observed UV irradiances, Geophys. Res. Lett., 32, L06808, doi:10.1029/2004GL022268, 2005.
McKinlay, A. F. and Diffey, B. L.: A Reference Action Spectrum for Ultra-violet Induced Erythema in Human Skin, in: Human Exposure to Ultraviolet Radiation: Risks and Regulations, edited by: Passchier, W. F. and Bosnajakovic, B. F. M., pp. 83–87, Am-sterdam, Elsevier, 1987.
Molina, L. T. and Molina, M. J.: Absolute absorption cross-sections of ozone in the 185 to 350 nm wavelength range, J. Geophys. Res., 91, 14 501–14 508, 1986.
Schwander, H., Koepke, P., and Ruggaber, A.: Uncertainties in modelled UV irradiances due to limited accuracy and availability of input data, J. Geophys. Res., 102, 9419–9429, 1997.