HAL Id: tel-01241404
https://tel.archives-ouvertes.fr/tel-01241404
Submitted on 10 Dec 2015
HAL is a multi-disciplinary open access archive for the deposit and dissemination of sci-entific research documents, whether they are pub-lished or not. The documents may come from teaching and research institutions in France or abroad, or from public or private research centers.
L’archive ouverte pluridisciplinaire HAL, est destinée au dépôt et à la diffusion de documents scientifiques de niveau recherche, publiés ou non, émanant des établissements d’enseignement et de recherche français ou étrangers, des laboratoires publics ou privés.
Impact du changement climatique et l’acidification des
océans sur le cycle océanique de l’azote
Jorge Martinez-Rey
To cite this version:
Jorge Martinez-Rey. Impact du changement climatique et l’acidification des océans sur le cycle océanique de l’azote. Météorologie. Université de Versailles-Saint Quentin en Yvelines, 2015. Français. �NNT : 2015VERS009V�. �tel-01241404�
Université de Versailles Saint-Quentin-en-Yvelines
Laboratoire des Sciences du Climat et de l'Environnement - LSCE École Doctorale des Sciences de l'Environnement - ED129
Thèse de Doctorat de
l'Université de Versailles Saint-Quentin-en-Yvelines Discipline
Biogéochimie Marine et Climat
Impact of climate change
and ocean acidification
on the marine nitrogen cycle
Présentée par
Jorge Martínez-Rey
pour obtenir le grade de Docteur de
l'Université de Versailles Saint-Quentin-en-Yvelines
This project has been developed in the Biomac team
in the Laboratoire des Sciences du Climat et de l’Environnement in Gif-sur-Yvette, France, and in part at the Environmental Physics department in the Institute of Biogeochemistry
and Pollutant Dynamics at ETH Zürich, Switzerland.
This project has been funded by the European Union via the Greencycles II Project "Feedbacks in the Earth System", European Community’s Seventh Framework Programme (FP7 2007-2013)
under Grant 238366.
This work has not previously been accepted in substance for any degree and is not being concurrently submitted for any other degree. This dissertation is being submitted in partial fulfillment of the requirement
of Ph. D. by the Université de Versailles - Saint Quentin en Yvelines.
This dissertation is the result of my own independent work and investigation, except where otherwise stated. Other sources are acknowledged giving explicit references.
A bibliography is appended.
I hereby give consent for my dissertation, if accepted, to be made available for photocopying and for inter-library loan, and the title and summary to be made available to outside organizations.
Acknowledgements
Thanks to Laurent Bopp,
for the opportunity of developing this work at LSCE, for the confidence and continuous help throughout the project, and for the positive, enthusiastic and practical perspective on every bit of work.
Thanks to Marion Gehlen,
for her guidance on the academic perspective, for the frequent discussions and sharp ideas, particularly for those saving my OceanSciences 2012 presentation in Salt Lake City.
Thanks to Alessandro Tagliabue, for his permanent motivation, help and ideas, for bringing the exciting ocean acidification proposal,
and for finding smart ways of how to fully exploit the technical towards the scientific realm. Thanks to Niki Gruber,
for his voice from a different academic system, for helping me to look carefully into details, for leading me towards more complex scientific questions,
and for hosting me at ETH Zuerich. Thanks to Christian Ethe, for teaching me how to use PISCES, from the very first to the very last steps,
and still today does.
Thanks to Elsa Cortijo and Philippe Bousquet, for your essential support dealing with administration, particularly with the delicate situation we faced at the end of this work.
Thanks to Parv Suntharalingam and to Erik Buitenhuis, for the discussions, the monitoring
and for your help within the Comite de These. Thanks to Dave Hutchins and Mike Beman,
for letting me participate in their research findings from a modelling perspective. Thanks to Olivier Aumont
for his contributions and feedbacks on the ocean acidification part. Thanks to Arnaud Caubel and Patrick Brockmann, for all the support with the CMIP5 archives and data,
and for showing the path towards data visualization. Thanks to the BIOMAC team,
Laure Resplandy, Stelly Lefort, Italo Massotti, Thomas Arsouze, Roland Seferian, Veronique Mariotti, Julien Palmieri, Briac LeVu, James Orr, Sarah Tavernel, Priscilla LeMezzo,
Timothee Bourgeois, Jennifer Simeon, Mohamed Ayache and Didier Swingedouw. Thanks to the LOCEAN department,
particularly to Vincent Echevin for his continuous and helpful participation in the Comite de These.
Thans to the Environmental Physics department at ETH,
to Zouhair Lachkar, Damien Loher, Bianca Wagenbach, Dave Byrne, Kay Steinkamp, Ivy Frenger, Olivier Eugster, Giuliana Turi, Ilaria Stenardo, Mark Payne, Matt Muennich,
Dominik Clement, Alex Haumann, Forough Fendereski, Yu Liu and Simon Yang, for giving me a sense of belonging.
Thanks to Meike Vogt,
for being so enthusiastic and so helpful beyond the daily routines and frustrations, Thanks to the Greencycles II network:
to Arnaud Heroult, Frans-Jan Parmentier, Matteo Willeit, Guillaume Villain, Daniela Dalmonech, Altug Ekici, Callum Berridge, Yanjiao Mi, Maria Martin Calvo, Catherine Morfopoulos, Alex, Alessandro Anav, Rozenn Kerbin, Aideen Foley,
Jana Kolassa, Katherine Crichton, Miral Sha, Dominik Sperlich, Chao, Gerardo Lopez Saldaña, Ioannis Bistinas, Peter Landschuetzer, Beate Stawiarski. Lazslo Hunor, Wolfgang Cramer, Santi Sabate,
Soenke Zahle, Bethan Jones and Daniela Tomescu, for such a wonderful journey.
Thanks to Andrew Friend for making Greencycles II possible,
for leading, assembling and guiding to a good end the ship with all of us on board. Thanks to Inga Hense,
for her help, support and comprehension when difficult decisions came in Hamburg. Thanks to Jad Abumrad, Robert Krulwich and all the Radiolab team
for making every single podcast available for everyone, for being there in the endless hours commuting to Saclay.
Thanks to the conception, inception and completion of the Bibliotheque National de France, whoever this applies to. Places like these make cities and people better.
Thanks to the people contributing to ffffound, itsnicethat and typographicposters websites, supporting graphic design, pushing the limits of layout and setting the trends into future data visualization.
A permanent source of inspiration.
Thanks to Alina Gainusa-Bogdan, Sauveur Belviso, Palmira Messina, Juliette Lathiere, Imen Braham and Raffaella Vuolo, for blurring the boundary between the lab and the city.
Thanks to Charlotte Laufkoetter and Colleen O'Brien, for all the fun and workshops together.
Résumé
Le cycle océanique de l'azote est à l'origine de deux rétro-actions climatiques au sein du système terre. D'une part, il participe au contrôle du réservoir d'azote fixé disponible au développement du phytoplancton et à la modulation de la pompe biologique, un des mécanismes de séquestration du carbone anthropique. D'autre part, le cycle de l'azote produit un gaz à effet de serre et destructuer d'ozone, le protoxyde d'azote (N2O). L'évolution
future du cycle de l'azote sous l'influence du rechauffement climatique, de la déoxygénation et de l'acidification des océans reste une question ouverte. Les processus tels que la fixation d'azote, la dénitrification et la
production de protoxyde d'azote seront modifiés sous l'influence conjuguée des ces trois stresseurs. Ces interactions peuvent être évaluées grâce aux modèles globaux de biogéochimie marine. Nous utilisons NEMO-PISCES et l'ensemble des modèles CMIP5 pour projeter les modifications des taux de fixation d'azote, de nitrification, de production et des flux air-mer de N2O à l'horizon de 2100 en réponse au scénario
'business-as-usual'. Les effets liés à l'action combinée du rechauffement climatique et de l'acidification des océans sur le réservoir d'azote fixé, la production primaire et la rétro-action sur le bilan radiatif sont également évalués dans cette thèse.!
Abstract
The marine nitrogen cycle is responsible for two climate feedbacks in the Earth System. Firstly, it modulates the fixed nitrogen pool available for phytoplankton growth and hence it modulates in part the strength of the biological pump, one of the mechanisms contributing to the oceanic uptake of anthropogenic CO2. Secondly, the
nitrogen cycle produces a powerful greenhouse gas and ozone (O3) depletion agent called nitrous oxide (N2O).
Future changes of the nitrogen cycle in response to global warming, ocean deoxygenation and ocean acidification are largely unknown. Processes such as N2-fixation, nitrification, denitrification and N2O
production will experience changes under the simultaneous effect of these three stressors. Global ocean biogeochemical models allow us to study such interactions. Using NEMO-PISCES and the CMIP5 model ensemble we project changes in year 2100 under the business-as-usual high CO2 emissions scenario in global
scale N2-fixation rates, nitrification rates, N2O production and N2O sea-to-air fluxes adding CO2 sensitive
functions into the model parameterizations. Second order effects due to the combination of global warming in tandem with ocean acidification on the fixed nitrogen pool, primary productivity and N2O radiative forcing
Contents
Chapter 1
Introduction
1.1.
!
Context ... 121.2.
!
The N-cycle at present ... 151.2.1.
!
Nitrogen compounds ... 17!
1.2.2.
!
Nitrogen cycle processes ... 19!
1.2.2.1.
!
N2-fixation ... 191.2.2.2.
!
Nitrification ... 20!
1.2.2.3.
!
Denitrification ... 21!
1.2.2.4.
!
External nitrogen input ... 21!
1.2.3.
!
Physical transport of nitrogen compounds ... 21!
1.2.4.
!
Nitrous oxide emissions ... 22!
1.2.5.
!
Controls of the bioavailable nitrogen pool ... 26!
1.3.
!
The N-cycle in the past ... 27!
1.3.1.
!
N2O in the last glacial period ... 27!
1.3.2.
!
Swings in the nitrogen budget ... 29!
1.4.
!
The N-cycle in the future ... 30!
1.4.1.
!
Impact of global warming ... 31!
Chapter 2
Methods
2.1.!
Introduction ... 44!
2.2.!
PISCES model ... 47!
2.2.1.!
Structure ... 47!
2.2.2.
!
The N-cycle in PISCES ... 49!
2.3.
!
Datasets and data-based products ... 56!
2.3.1.
!
World Ocean Atlas ... 56!
2.3.2.
!
O2-corrected World Ocean Atlas ... 57!
2.3.3.
!
Export of Organic Matter ... 58!
2.3.4.
!
N2O sea-to-air flux ... 59!
2.3.5.!
N2O inventory ... 60!
2.3.6.!
N2-fixation rates ... 61!
2.4.!
Climate Models ... 62!
2.4.1.!
IPSL-CM5 ... 62!
2.4.2.!
CMIP5 models ... 63!
2.5.!
Simulation Plan ... 65!
2.5.1.
!
Oceanic N2O emissions in the 21st century ... 65!
2.5.2.
!
Ocean Acidification effect on the marine N-cycle ... 65!
Chapter 3
N-cycle in CMIP5 models
3.1.!
Introduction ... 67!
3.2.
!
Methodology ... 71!
3.2.1.
!
CMIP5 models ... 71!
3.2.2.
!
Data-based products and datasets ... 72!
3.2.3.
!
N2O Parameterizations ... 73!
3.2.3.2.
!
N2O Inventory ... 74!
3.2.4.
!
N2-fixation parameterization in CMIP5 models ... 75!
3.3.
!
N2O from CMIP5 models ... 77!
3.3.1.
!
N2O production rates ... 77!
3.3.1.1.
!
Drivers of uncertainties in estimating N2O production ... 79!
3.3.2.
!
N2O inventory ... 80!
3.3.2.1.
!
N2O inventory estimates and observations ... 83!
3.4.
!
N2-fixation in CMIP5 models ... 87!
3.4.1.
!
N2-fixation rates ... 87!
3.4.2.
!
N2-fixers biomass ... 90!
3.5.
!
Conclusions ... 91!
Chapter 4
Oceanic N
2O emissions in the 21
stcentury
Introduction ... 95!
Chapter 5
Impact of ocean acidification on N
2-fixation
5.1.!
Introduction ... 117!
5.2.
!
Methodology ... 119!
5.2.1.
!
PISCES Model ... 119!
5.5.1.
!
Ocean acidification ... 125!
5.5.2.
!
Climate change and ocean acidification ... 126!
5.6.
!
Model caveats ... 130!
5.7.
!
Summary and conclusions ... 130!
5.8.
!
Acknowledgements ... 131!
5.9.
!
References ... 131!
5.10.
!
Supplementary Material ... 136!
5.10.1.
!
N2-fixation parameterization terms ... 136!
5.10.2.
!
Carbonate chemistry ... 137!
Chapter 6
Impact of ocean acidification on nitrification
6.1.!
Introduction ... 139!
6.2.
!
Methods ... 141!
6.2.1.
!
Ocean circulation and biogeochemical model ... 141!
6.2.2.
!
Nitrification parameterization in PISCES ... 142!
6.2.3.
!
Experiment Design ... 143!
6.3.
!
Nitrification under future marine stressors ... 144!
6.3.1.
!
Impact of ocean acidification on nitrification ... 144!
6.3.2.
!
Impact of climate change and ocean acidification on nitrification ... 147!
6.3.3.
!
Nitrification impact on primary production and N2O production ... 147!
6.4.
!
Discussion ... 148!
6.5.
!
Model caveats ... 150!
6.6.
!
Summary and conclusions ... 151!
6.7.
!
Acknowledgements ... 151!
6.8.
!
References ... 152!
6.9.
!
Supplementary Material ... 155!
6.9.1.
!
Carbonate chemistry ... 155!
Chapter 7
Conclusions and Perspectives
7.1.
!
Conclusions ... 157!
7.1.1.
!
N-cycle in CMIP5 models ... 157!
7.1.2.
!
Oceanic N2O emissions in the 21st century ... 159!
7.1.3.
!
Impact of ocean acidification on N2-fixation ... 160!
7.1.4.
!
Impact of ocean acidification on nitrification ... 161!
7.2.
!
Perspectives ... 163!
7.2.1.
!
N-cycle processes in OGCBMs ... 163!
7.2.2.
!
Living compartments in OGCBMs ... 164!
7.2.3.
!
Interannual N2O emissions from the ocean ... 165!
7.2.4.
!
Combined effects on the N-cycle ... 165!
7.2.5.
!
External N input ... 166!
Chapter 8
References
References ... 167Chapter 1
Introduction
1.1.
!
Context ... 12!
1.2.
!
The N-cycle at present ... 15!
1.2.1.
!
Nitrogen compounds ... 17!
1.2.2.
!
Nitrogen cycle processes ... 19!
1.2.2.1.
!
N2-fixation ... 19!
1.2.2.2.
!
Nitrification ... 20!
1.2.2.3.
!
Denitrification ... 21!
1.2.2.4.
!
External nitrogen input ... 21!
1.2.3.
!
Physical transport of nitrogen compounds ... 21!
1.2.4.
!
Nitrous oxide emissions ... 22!
1.2.5.
!
Controls of the bioavailable nitrogen pool ... 26!
1.3.
!
The N-cycle in the past ... 27!
1.3.1.
!
N2O in the last glacial period ... 27!
1.3.2.
!
Swings in the nitrogen budget ... 29!
1.4.
!
The N-cycle in the future ... 30!
1.4.1.
!
Impact of global warming ... 31!
1.4.2.
!
Impact of ocean deoxygenation ... 33!
1.4.3.
!
Impact of ocean acidification ... 35!
1.4.4.
!
Direct anthropogenic nitrogen inputs ... 37!
1.5.
!
Open questions ... 38!
1.5.1.
!
Future marine N2O emissions ... 38!
1.5.2.
!
Global warming and ocean acidification on the N-cycle ... 40!
1.6.
!
Objectives and methods ... 411.1. Context
The nitrogen cycle (N-cycle) plays an pivotal role in the Earth's climate system. Nitrogen, together with other nutrients (mostly phosphorus (P) and iron (Fe) in the ocean, P and potassium (K) on land), is one of the limiting nutrients of the growth of plants, including marine phytoplankton in the ocean. Their metabolism requires a constant supply of bioavailable forms of nitrogen to grow. This mechanism links the N-cycle to the carbon cycle (C-cycle), which ultimately regulates terrestrial and oceanic carbon dioxide (CO2) uptake from the atmosphere.
Land and ocean absorb substantial amounts of anthropogenic emissions of CO2, thus reducing the anthropogenic greenhouse gas (GHG) effect and diminishing the potential impact of global warming. Net CO2 uptake in land and ocean absorbs similar quantities of atmospheric CO2, in the order of 1.0 to 3.2 PgC yr-1 over the last 2002-2011 time period (Ciais et al., 2013). They account to about half of the total anthropogenic CO2 emissions, i.e., 8.3 PgC yr-1 over the last decade. In the ocean, whereas this net carbon sink is thought to be mainly driven by physical-chemical processes, phytoplankton growth is a key player in the oceanic carbon cycle. Phytoplankton production of organic matter leads to a vertical gradient of carbon in the ocean interior, a process known as the biological pump, contributing to the storage of anthropogenic CO2. Figure 1 shows the coupling between the C-cycle and the N-cycle in land and ocean, with particular focus on the contributions and losses of different forms of nitrogen compounds into the nitrogen pool (Gruber and Galloway, 2008). Part of the strength of the biological pump relies on the sources and sinks of bioavailable nitrogen, and therefore on the intrinsic natural variability of the N-cycle. The pool of reactive (or bioavailable) nitrogen has been historically regulated by natural processes, shown in blue in Figure 1, such as N2-fixation, nitrification and denitrification. These processes bond the atmospheric N-cycle with that from land and ocean. Over past timescales the natural variability of these processes has been suggested to drive the biological pump, with a direct impact on the climate system. In addition, two N-cycle processes (nitrification and denitrification) are responsible for the production of a powerful, long lived greenhouse gas and ozone (O3) depletion agent called nitrous oxide (N2O). The terrestrial and oceanic production of N2O contributes directly to the atmospheric greenhouse gas budget, and therefore modulates in part the climate system. Since the industrial revolution, and particularly since the development and extensive use of the Haber-Bosch process, fixing artificially atmospheric N2 for its use as a fertilizer in the form of ammonium (NH4+), the natural N-cycle has been significantly altered. Human population growth and its associated industrial activity have released large amounts of nitrogen compounds to the atmosphere and have also increased the amount of fixed nitrogen in soils (Figure 1, in red). This additional supply of nitrogen compounds have increased the reactive
Fi g u re 1 : T h e co u p lin g b etw ee n th e n itr o g en c y cle a n d th e ca rb o n c y cle in th e a tm o sp h er e, la n d a n d o ce a n . N a tu ra l N -cy cl e p ro ce ss es ar e sh o w n i n b lu e, wh il e o cc u rr en ce a n d r el a ti v e m a g n it u d e o f a n th ro p o g en ic i n d u ce d c h a n g es a re s h o wn i n r ed . In p u ts a n d l o ss es o f th e re a ct iv e ni tr o g en po o ls i n la nd a nd oc ea n a re s h ow n w it h a rr ow s. T h e m a in n a tur a l in put s of n it ro ge n ar e at m o sp h er ic n it ro ge n d ep o si ti o n an d N 2 -fix a tio n b o th in l a n d a n d o ce a n . N a tu ra l lo ss es of n it rog en oc cur vi a n it ri fi ca ti on a n d de n it rf ic a ti on . H um a n pe rt ur ba ti on s of t h e N -cy cl e ar e v ia th e ex te n si v e u se o f fe rt il is er s, ad d in g a si gn if ican t am o u n t of NO 3 - an d NH 4 + co m p o u n d s in s o il s an d e v en tu al ly i n r iv er d is ch ar ge t o t h e o ce an , an d al so w it h t h e p ro d u ct io n o f at m o sp h er ic re act iv e co m p o unds . (G rube r an d G al lo w ay , 2 0 0 8 ).
Natural and anthropogenic perturbations of the N-cycle have been a matter of research over the last decades but their magnitude, effects and feedbacks in the climate system remain largely unknown, particularly in the ocean realm (Gruber and Galloway, 2008; Zehr and Ward, 2002). Many uncertainties exist concerning the current understanding of the N2O formation processes in the ocean (Freing et al., 2012; Zamora et al., 2013), for instance, and the changes they might be subject to in future environmental conditions. Moreover, future oceanic forcings will certainly impact the regulating mechanisms of the bioavailable nitrogen pool, i.e., N2-fixation, nitrification and denitrification, which in turn fuel the oceanic biological
pump.
These questions can be addressed using Earth System Models (ESMs). ESMs are used to make future projections of changes in the N-cycle and, most important, to analyze the interactions among the N-cycle, the C-cycle, and the feedback within the marine stressors themselves. These models must be however evaluated in terms of their current capabilities to study present and future N-cycle processes, particularly when making future projections of oceanic N2O sea-to-air emissions and analyzing changes in the fixed nitrogen pool.
1.2. The N-cycle at present
While the role of the marine N-cycle on a global scale is known from a biogeochemical and climate perspective, the understanding as today of the underlying mechanisms of N-cycle processes is not satisfactory (Gruber and Galloway, 2008; Zehr and Ward, 2002).
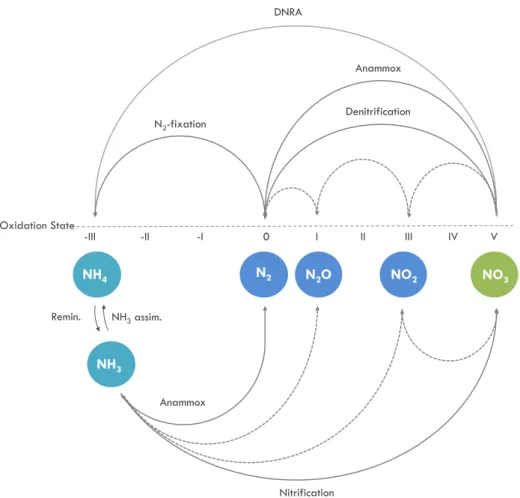
The oceanic N-cycle is a sequence of reduction and oxidation processes among nitrogen compounds in different oxidation states (Figure 2). The most abundant form of nitrogen in the ocean is dissolved dinitrogen (N2). N2 is reduced to ammonium (NH4+) as a product of N2-fixation, a reduction process performed by a particular group of phytoplankton called
The mechanisms and environmental conditions under which these processes occur are not yet fully understood. Processes such as N2-fixation or nitrification have been a matter of study over the last decades, while other transformations such as anammox or DNRA are lacking a more accurate description and their relative importance in the N-cycle has been just hypothesized (Lam et al., 2009). The complexity of the nitrogen cycle relies not only on the many unknowns regarding occurrence and environmental controls, but also on the spatial coupling or decoupling of many of its processes, the uneven distribution of the nitrogen compounds in the ocean and the feedbacks between the processes that might self regulate the nitrogen content in the ocean over long timescales.
Nitrification
N2
NH4 NO2 NO3
-III -II -I 0 I II III IV V Oxidation State Anammox Anammox Denitrification N2-fixation Remin. N2O NH3 NH3 assim. DNRA
Figure 2: Nitrogen compounds and transformations within the N-cycle sorted along the oxidation state axis. Oxidation processes such as remineralisation, anaerobic ammonium oxidation (anammox) and nitrification are shown in the lower part of the diagram. Reduction processes such as denitrification, anammox and N2-fixation are
shown in the upper part of the diagram. Solid lines represent the different processes pointing towards the end products, while dotted lines represent the intermediate or by- products in nitrification and denitrification processes.
1.2.1. Nitrogen compounds
The nitrogen compounds are neither evenly distributed nor have the same abundance in the ocean interior. The bioavailable nitrogen compounds, i.e., NH4+ and NO3-, are relatively scarce in the ocean compared to nitrogen in its gaseous inorganic form (N2). N2 represents 94% of the total nitrogen budget in the ocean, whereas NO3- accounts only to 4% and dissolved organic nitrogen (DON) to 1%. Half of the remaining 1% is completed with particulate organic nitrogen (PON), NO2, NH4+ and N2O (Gruber, 2008).
The global depth average distribution of NO3- in the ocean is shown in Figure 3. NO3- is depleted at the sea surface due to the continuous uptake of phytoplankton, but it occupies the deep ocean in a large reservoir with an average value of 30 µmol kg-1. NH4+ follows the same fate as that from NO3- in the euphotic zone but at much larger magnitude. Phytoplankton has a preference for assimilating NH4+ among the fixed nitrogen compounds and NH4+ is quickly exhausted either on its original supply from N2-fixation or its remineralized form from the deeper layers. As a consequence, NH4+ concentration peaks close to the euphotic zone, where its production after remineralisation of organic matter exceeds its own consumption by phytoplankton. NH4+ is therefore less abundant than NO3- and it is completely depleted at depth. NO2, as an intermediate compound in the nitrogen cycle, is also consumed in the euphotic zone and depleted below 100m.
While the nitrogen pool of NO3- and NH4+ is modulated by phytoplankton demands, the distribution of N2O is strictly linked to bacterial production processes by nitrification and denitrification (see 1.2.4 Nitrous oxide emissions). The depth distribution of N2O and the in-situ O2 measurements from several cruise campaigns is shown in Figure 4 (Suntharalingam and Sarmiento, 2000). Nitrification and denitrification operate together in regions where O2 concentration falls below 5 to 20 µmol L-1. In these oxygen minimum zones (OMZs or oxygen
deficient zones, ODZ, in literature) N2O production is particularly enhanced by the
simultaneous production processes and N2O concentration reaches its maximum in various oceanic locations, up to 40 to 50 nmol L-1. Minima are observed in the sea surface due to gas exchange, whereas a remaining N2O reservoir is found in the deep around 16 nmol L-1 (Bange et al., 2009). The O2 consumption follows the same profile but mirrored on the concentration scale. The minimum on O2 concentration is observed in the same depth range between 200 and 1000m deep, where the N2O maxima are found. O2 increases at the surface and in the deep at a global depth average of 195 µmol L-1 (Bianchi et al., 2012).
Figure 4: Global depth average profile of N2O (in nmol L-1) and the corresponding O2 (in µmol L-1) from the same
measurements. The different lines correspond to the cruises from the BATS, SAGA and RITS cruise campaigns. (Suntharalingam and Sarmiento, 2000).
1.2.2. Nitrogen cycle processes
1.2.2.1. N
2-fixation
N2-fixation is the largest source of external bioavailable nitrogen into the ocean (Gruber and Galloway, 2008). A particular group of phytoplankton known as diazotrophs fix dissolved N2 in low-latitude warm waters, contributing to the fixed nitrogen pool in larger quantities than atmospheric nitrogen deposition or riverine nitrogen supply do. Despite the energetically expensive process of breaking the triple bond of N2, resulting in a slower growth rate, diazotrophs have been succesful performing this strategy to compensate the lack of other forms of bioavailable nitrogen in their close proximity, taking advantage in the competition against the non-diazotrophs, which are nitrogen limited.
Two groups of diazotrophs are responsible for N2-fixation in the ocean, cyanobacteria and proteobacteria (Carpenter and Capone, 2008), known as the N2-fixers. The N2-fixers and its unique N2-fixation process have been studied particularly over the last two decades, when the distribution and the main environmental controls of the N2-fixation process have been identified. N2-fixation is fostered under high seawater temperatures above 15 to 20°C (Carpenter, 1983; Capone et al., 1997), although temperatures above 30 to 34 °C reduce their metabolims and hence the N2-fixation capability (Fu et al., 2014). Just like any other phytoplanktonic organism, diazotrophs need high incoming radiation (Chen et al., 1998, Orcutt et al., 2001), and also the constant supply of PO4 (Wu et al., 2000; Sañudo-Wilhelmy et al., 2001) but mostly Fe for activate the enzyme responsible of breaking N2 (Falkowski, 1997; Berman-Frank et al., 2007). Diazotrophs are highly competitive in abscence of other forms of fixed nitrogen, i.e. NH4+ and NO3- (Capone et al., 1997; Karl et al., 2002; Holl and Montoya, 2005) and are favoured by relatively low O2 conditions (Stuart and Pearson, 1970). Recent studies have also analyzed the diazotrophs performance under high levels of seawater CO2
N2-fixation rates was made available under the auspices of the MAREDAT project (Buitenhuis et al., 2013) by Luo et al. (2012). More than 5,000 measurements were compiled, spanning 30 years of observations, of N2-biomass, N2-fixation rates and metadata of temperature, Fe and O2. The observational analysis have been completed on a global scale with modelling studies, including idealised box model analysis to estimate the global budget and their uncertainties related to changes in ocean circulation (Eugster and Gruber, 2012). N2-fixers and N2-fixation process have been included into the standard model output of global ocean models, gathered under the auspices of the Coupled Model Intercomparison Project 5 (CMIP5) (Taylor et al., 2012) and shown in Chapter 2.
1.2.2.2. Nitrification
Nitrifying bacteria carry out the oxidation of NH4+ into NO3-. These organisms are separated into ammonia-oxidizing bacteria plus archaea, who perform the first step from NH4+ to NO2-, and nitrite-oxidizing bacteria who finalize the process, turning NO2- into NO3-. None of these organisms is able to perform both steps simultaneously. Nitrification occurs at the lower boundary of the euphotic zone, where NH4+ is not longer assimilated by phytoplankton due to the abscence of light and where NH4+ from remineralisation of organic matter is fully available for nitrifying bacteria.
There are a few environmental controls which determine the optimum conditions for nitrification that have been identified. While N2-fixation has a permanent supply of dissolved N2, nitrification depends primarily on the amount of organic matter remineralised, and therefore on the export of organic matter (CEX) to depth. Nitrification is inhibited by light (Horrigan et al., 1981), although there are growing evidences that nitrification could occur in the euphotic layer. Nitrification shows its maximum around 100m deep where nitrifying bacteria is highly competitive against the phytoplankton in that depth range because of the absence of light.
As today, there are no global databases available compiling nitrification rates measurements. Only few nitrifying bacteria distributions in the open ocean have been compiled in the MAREDAT project (Buitenhuis et al., 2013). Global ocean biogeochemical models have included recently nitrification among their model output (e.g., IPSL, GFDL, CESM and CMCC, described in detail in Chapter 2).
1.2.2.3. Denitrification
Respiration of NO3- in low O2 conditions leads to the reduction of NO3- back to the inorganic form of N2 in a process called denitrification. The removal of bioavailable nitrogen is done by anaerobic bacteria when O2 concentration is below 2 to 5 µmol L-1 (Tiedje, 1988). Dissolved O2 concentration is therefore the main environmental control of denitrification occurrence. Denitrification is also inhibited by light, although this assumption comes automatically by the fact that OMZs are located well below 200m deep. When O2 is completely depleted (i.e., anoxia), N2O is consumed instead of NO3- (Cohen and Gordon, 1978). Sediment denitrification, based on the same biological mechanisms, is also a prominent removal process of fixed nitrogen from the ocean. The degradation of the biologically available nitrogen compounds occurs in the surface of the sediments mostly along coastal margins (Middelburg et al., 1996; Devol, 2008), but without completing the whole NO3- to N2O formation process.
1.2.2.4. External nitrogen input
Atmospheric deposition of reactive nitrogen and river discharge of dissolved organic and inorganic nitrogen are the second and third most relevant external sources of nitrogen into the ocean after N2-fixation (Gruber and Galloway, 2008). Reactive nitrogen coumpounds (NOy, NHx) are transported from land onto the sea surface via atmospheric deposition. These plumes of reactive nitrogen are associated with high industrialised areas close to the seaside like those from North America, India and Southeast Asia. Recent estimates of atmospheric nitrogen deposition are between 38.9 (Dentener et al. 2006) to 68 TgN yr-1 (Duce et al., 2008). Atmospheric nitrogen deposition alone is responsible of 3% of the global new primary production (Duce et al., 2008). Particulate and dissolved organic and inorganic nitrogen is supplied by river discharge into estuaries (Mayorga et al., 2010). Rivers contribute with 30 TgN yr-1 into the oceanic nitrogen budget (Gruber and Galloway, 2008). The impact on
of the distribution of the main nitrogen compounds. There are two basic mechanisms of transport of nitrogen compounds from the ocean interior to the euphotic layer, namely mixing and upwelling. Mixing between the subsurface and the euphotic layer supply fixed nitrogen in the remineralised forms of NH4+ and NO3- back to the surface. Upwelling in the eastern boundary currents represents one of the most important sources of nutrients into the euphotic layer. Upwelling delivers NO3- from its deep reservoir together with other nutrients such as PO4 or Fe, which regulate the phytoplankton population distribution and ultimately surface NO3- and NH4+ concentrations.
1.2.4. Nitrous oxide emissions
Estimations of global oceanic N2O emissions to the atmosphere are about 4 TgN yr-1 (Nevison et al., 1995; Suntharalingam et al., 2000), with a wide interval of uncertainties from 1.8 to 9.4 TgN yr-1 (Table 1). The oceanic N2O emissions represents one third of all the natural sources of N2O in the Earth System, or one fourth of all the total sources, including the anthropogenic ones (Ciais et al., 2013). Other contributions of N2O to the atmosphere are mainly nitrification in soils and anthropogenic-related activities such as fossil fuel combustion, industrial processes and agricultural exploitation (Figure 5). The same interval of uncertainties from oceanic emissions applies to estimates of soil emissions and those from anthropogenic sources. N2O (TgN yr-1) Uncertainties (TgN yr-1) Natural N2O sources
Soils under natural vegetation 6.6 3.3 - 9.0
Oceans 3.8 1.8 - 9.4
Atmospheric chemistry 0.6 0.3 - 1.2
Anthropogenic N2O Sources 6.9 2.7 - 11.1
Total 17.9 8.1 - 30.7
Table 1: Natural and anthropogenic sources of N2O to the atmosphere. Oceanic N2O emissions account up to
30% of the total natural emissions and 25% of the total N2O emissions including those from anthropogenic
activities. Anthropogenic activities include fossil fuel combustion, industrial processes, agriculture, biomass and biofuel burning and human excreta. (Ciais et al., 2013).
Measurements of oceanic N2O flux to the atmosphere and N2O concentrations in the ocean interior are sparse in space and time domains (Nevison et al., 1995; Bange et al., 2009). The first cruises measuring N2O concentration and N2O sea-to-air fluxes covered long transects along the Atlantic (BLAST), western Pacific (RITS89) western Pacific and Indian ocean (SAGA2). However, the spatial coverage of oceanic N2O concentration measurements have been mostly focused on the N2O production hotspots at the Eastern Tropical Pacific (ETP) (Paulmier and Ruiz-Pino, 2009; Cornejo and Farias, 2012), Benguela Upwelling System (BUS) (Gutknecht et al., 2013) and Northern Indian Ocean (Naqvi et al., 2010), but very limited in the open ocean. Measurements of N2O sea-to-air emissions from the ocean to the atmosphere show a poor spatial coverage (Nevison et al., 2004), in which any attempt of global interpolation results in very uncertain values of the actual global oceanic N2O emissions. The lack of measurements together with the limited understanding of the N2O production processes result in the above mentioned large interval of uncertainties when global estimates are made.
N2O formation in the ocean is associated with two particular bacterial processes; nitrification in ocean and in soils, and water column denitrification in the ocean interior (Cohen and Gordon, 1978; Goreau et al., 1980; Elkins et al, 1978). The combination of these two processes together with N2O consumption by the same denitrifying bacteria in complete anoxia (i.e., dissolved O2 exhausted) yield a positive net N2O production in the ocean interior and the subsequent sea-to-air emissions of N2O.
Figure 5: Contributions (in TgN yr-1) to the atmospheric N2O budget and their uncertainties from terrestrial and
oceanic sources. Natural N2O sources such as oceanic, atmospheric chemistry and soils under natural vegetation
are marked in black, while the anthropogenic contributions including those from atmospheric deposition in the ocean, agriculture, coastal, human excreta, fossil fuels, industry, biomass and biofuel burning, and atmospheric deposition on land are marked in red (Ciais et al., 2013).
Natural N2O emissions have been historically in equilibrium with the only known substantial N2O sink, i.e., annihilation with stratospheric O3. Ice core measurements have shown a constant N2O atmospheric concentration of 270 ppb over the 2000 years prior to the industrial revolution, as shown in Figure 7. However, an increase in atmospheric N2O concentration has been observed over the last two hundred years. N2O atmospheric concentration has increased by 18% since pre-industrial times, reaching 325 ppb at present
(NOAA ESRL Global Monitoring Division, Boulder, Colorado, USA,
http://esrl.noaa.gov/gmd/). Changes are quite likely attributed to anthropogenic sources of N2O that must have increased the atmospheric concentration significantly over the last two hundred years.
N2O plays the role of a greenhouse gas (GHG) in the atmosphere. It is ranked third in radiative forcing (RF) after methane (CH4) and carbon dioxide (CO2) (Table 2) (Myhre et al.,
2013). Although its radiative forcing potential is lower, N2O shows the longest lifetime of these greenhouse gases. One molecule of N2O lasts in the atmosphere up to 131 ± 10 yr (Prather et al., 2012), exceeding by an order of magnitude the lifetime of CO2 and CH4. CO2 estimated lifetime span 30 to 95 yr, while CH4 has a shorter lifetime of 11.2 ± 1.3 yr (Prather et al., 2012). During its lifetime, N2O is distributed from the troposphere up to the stratosphere. When N2O reaches the stratosphere, it is annihilated in a photochemical reaction where O3 is consumed (Crutzen, 1970; Johnston, 1971), weakening the O3 layer. Other O3 depletion emissions such as chlorofluorocarbons (CFCs) have been limited after the mitigation policies agreed in the The Montreal Protocol on Substances That Deplete The Ozone Layer in 1987. This reduction in CFCs emissions suggests that N2O is now leading the O3 depletion, and it might keep playing this role the next hundred years, as suggested by Ravishankara et al. (2009) (Figure 6). Species Concentration (ppx) Radiative Forcing (W m-2) CO2 (ppm) 391 ± 0.2 1.82 ± 0.19 CH4 (ppb) 1803 ± 2 0.48 ± 0.05 N2O (ppb) 324 ± 0.1 0.17 ± 0.03
Table 2: Mole fractions and radiative forcing for the three most important greenhouse gases: carbon dioxide (CO2), methane (CH4) and nitrous oxide (N2O). Concentrations are based on measurement averages (Myhre et al.,
Figure 7: Atmospheric N2O concentration (in ppb) from 0 AD to present time. Data points are from ice-core
measurements (red) and direct atmospheric measurements (blue). The atmospheric N2O concentration has
experienced an 18% increase from pre-industrial to present times, reaching 325 ppb at present. (Ciais et al., 2013 and NOAA ESRL Global Monitoring Division, Boulder, Colorado, USA, http://esrl.noaa.gov/gmd/).
1.2.5. Controls of the bioavailable nitrogen pool
The contribution of inputs, losses and their intermediate processes among the different nitrogen compounds in the fixed nitrogen pools regulate primary production over vast regions of the ocean, modulating in this way the strength of the biological pump.
The main input of bioavailable nitrogen as NH4+ into the ocean is N2-fixation. Up to 134 TgN are introduced in the fixed nitrogen pool per year via N2-fixation according to interpolation techniques based on the compilation of measurements from Luo et al. (2012) (Table 3). This estimation is subject however to large uncertainties. Observations of N2-fixers distribution, biomass and N2-fixation rates show a sparse temporal and spatial coverage which cast doubts on the accuracy of its potential global extrapolation. Moreover, the measurement techniques used in this compilation of observations have been also a matter of debate. Estimates using this database could increase up to 177 TgN yr-1 (Grosskopf et al., 2012). On the other hand, model studies have estimated global N2-fixation rates in the same order of magnitude, spanning 134 (Eugster and Gruber, 2012) to 137 TgN yr-1 (Deutsch et al., 2007), with uncertainties in the order of ± 16 to ± 34 TgN yr-1 respectively. Global ocean biogeochemical model estimates from the CMIP5 project (Taylor et al., 2012) increase the uncertainties up to ± 75 TgN yr-1, despite the agreement on the global mean estimate of 134 TgN yr-1 (see Chapter 5).
The loss of fixed nitrogen in the ocean is driven by water column and sediment denitrification, in which NO3- is converted by denitrifying bacteria back into an inorganic form of nitrogen (N2) in low O2 conditions. Recent model studies estimated 30 and 85 TgN yr
-1 for water column and sediment denitrification respectively (Eugster, 2013), in the same order of magnitude than previous studies from Somes et al. (2010), Galloway et al. (2004) or Gruber (2004) (Table 3). A comparison between the estimated total input of nitrogen via N2-fixation and the total loss of nitrogen via total denitrification suggests that at present the oceanic nitrogen budget might be at equilibrium (Gruber, 2008).
Study N2-fixation (TgN yr-1) Total Denitrification (TgN yr-1) Sediment Denitrification (TgN yr-1) Water Column Denitrification (TgN yr-1) Study 115 85 30 Eugster, 2013 Luo et al., 2012 137 ± 9 Grosskopf et al., 2012 177 ± 8
Eugster & Gruber, 2012 134 ± 16
105 38 67 Somes et al., 2010
Deutsch et al., 2007 137 ± 34
274 193 81 Galloway et al., 2004
245 180 65 Gruber, 2004
Carpenter et al., 1992 10
Table 3: Estimations of N2-fixation rates in TgN yr-1 combining model studies from Deutsch et al. (2007), Eugster
and Gruber (2012), and observational analysis from Luo et al. (2012) and the additional corrections from Grosskopf et al. (2012) based on the former study. Estimates of water column and sediment denitrification (in TgN yr-1) at present are from model estimates (Eugster, 2013; Somes et al., 2010) and geochemical estimates (Galloway
et al., 2004; Gruber, 2004).
1.3. The N-cycle in the past
The scenario as today concerning natural oceanic N2O emissions and the natural equilibrium in the fixed nitrogen pool is a consequence of historical swings over long timescales. Paleorecords indicate this natural variability and describe the cycles that the N-ctcle has been subject to in the past. The additional variability induced by anthropogenic forcings must be
the last 600.000 yr (Figure 8) during glacial and interglacial time periods. This variability is highly correlated with changes in temperature in the northern hemisphere, although it is not yet clear in which way causality operates (Janssen et al., 2007). Moreover, the potential contribution of the oceanic N2O emissions to the total N2O budget remains unknown, and so do the land emissions over the same period.
Most of the available data on past atmospheric N2O concentration belongs to the last 100.000 yr. During this period abrupt changes and shifts in climate conditions have been observed. These changes are also known and Dansgaard-Oeschger (D-O) events. Records of atmospheric N2O concentration are highly correlated with these abrupt D-O changes. Assuming nitrification and denitrification as the only known production pathways of N2O in the ocean interior, changes within these processes might explain the abrupt changes observed. In fact, it has been suggested by Gruber (2004) that changes in N2O production via denitrification or a combination of changes in denitrification and nitrification might have lead to the observed changes during D-O events. The isotopic fractionation during N2O production allow us to differenciate the main N2O sources. Denitrification produces light (N2O and N2) and heavy products (NO3). While N2O and N2 escape to the atmosphere, the NO3 isotopic signal is transferred into organic matter that is eventually stored into sediments (Suthhof et al., 2001). 15N records from sediment cores support the hypothesis of a large activity of denitrification during D-O events. This behaviour has been observed in sediment cores from the Arabian Sea (Pichevin et al., 2007) and the ETP (Suthhof et al., 2001), traditional hotspots of N2O production. However, sediment records only allow us to reconstruct denitrification activity, leaving N2O production pathway via nitrification with significant uncertainties of how it evolved in the past, as changes in nitrification are assumed to have occurred in the last glacial period (Fluckiger et al., 2004). From the modelling perspective, model analysis of changes in oceanic N2O have tried to explain the mechanisms behind the correlation between atmospheric N2O concentration and the D-O events. These model experiments have focused on changes in ocean circulation as the main driver of changes in N2O production and eventually on atmospheric N2O concentration. One of the plausible explanations proposed in these experiments is the substantial change on the strength of the Atlantic Meridional Overturning Circulation (AMOC) during D-O events. Model studies from Schmitter and Galbraith (2008), or Goldstein et al. (2003), induced freshwater inputs in the North Atlantic, thus changing the strength of the AMOC. As a result, they obtained a highly correlated variability in atmospheric N2O concentrations during D-O events. Whether the same mechanisms might operate in the future modulating oceanic N2O emissions is a question which remains open.
Figure 8: Atmospheric concentration of N2O, CO2, CH4, ∂D and ∆18O from paleorecords. Warm interglacial
periods are shown in grey. (Janssen et al., 2007).
1.3.2. Swings in the nitrogen budget
Palaeorecords have shown evidence of variability of the atmospheric CO2 concentration over glacial to interglacial periods, from 175ppm to 300ppm in the last 800 kyr (Wolff, 2011). Fluctuations in the oceanic nitrogen inventory, driven presumably by changes in the balance between N2-fixation and denitrification, might have caused significant variations in the strength of the biological pump and therefore in atmospheric CO2 concentration (McElroy, 1987). McElroy (1987) argued that swings in the dominance of N2-fixation over denitrification could explain significant changes in the oceanic fixed nitrogen inventory and hence on the oceanic uptake capability of atmospheric CO2. That would imply that N2-fixation and
of the ocean. The time scope of these hypothesis will not be tested in this thesis, that considers shorter time scales within the next hundred years.
1.4. The N-cycle in the future
Anthropogenic activities have caused perturbations in the marine N-cycle on top of its natural variability. There are direct and indirect anthropogenic induced changes to the marine environment that might change N-cycle processes and transformations. Direct anthropogenic effects include increasing levels of nitrogen supply to the oceans via river discharge due to the extensive use of fertilizers. Increasing industrialization will also increase atmospheric nitrogen deposition of reactive nitrogen compounds. All the extra amount of nitrogen into the natural N-cycle will undoubtedly lead to changes in ocean biogeochemistry. Indirect anthropogenic effects occur via higher levels of atmospheric greenhouse gas concentrations and seawater CO2, creating three main stressors on the marine environment, namely global warming, ocean deoxygenation and ocean acidification (Gruber, 2011).
Direct and indirect anthropogenic induced changes will modify the external N supply into the ocean, N2-fixation, nitrification and denitrification processes, with consequences on oceanic N2O emissions, on the amount of bioavailable nitrogen and on global climate feedbacks. The oceanic regions in which global warming, ocean deoxygenation and ocean acidification operate have been summarised in Figure 9 (Gruber, 2011). Increased stratification expand at low latitudes due to higher temperatures, with subsequent changes in the nutrient supply to the euphotic layer and therefore on marine productivity (Sarmiento et al., 2004). Changes in dissolved O2 content are also concentrated at low latitudes, particularly on the eastern boundary currents and the northern Indian Ocean. The low latitudinal effects on productivity together with the location of the OMZs in the same latitudinal band makes the N-cycle the ideal candidate to experience the manifold interactions with future oceanic stressors. Some of the most relevant N-cycle processes, namely N2-fixation, nitrification and water column denitrification occur indeed mostly at low latitudes (see Chapter 2). These processes will experience changes in the distribution of the organisms which perform such transformations, in the metabolic efficiency of these processes, in the environmental conditions under which these processes occur and, finally, in the physical transport of the nitrogen compounds within the ocean interior.
Figure 9: Oceanic regions subject to a significant impact of changes by increasing stratification leading to lower productivity (blue) and deoxygenation (pink) as a result of climate change (Gruber, 2011). The combined effects of stratification and deoxygenation are coincident in low latitudinal regions, where most of the N-cycle processes occur.
1.4.1. Impact of global warming
Global warming, as a result of higher atmospheric concentrations of CO2 and other greenhouse gases, will increase seawater temperatures and induce higher levels of ocean stratification. This will trigger changes in mixing between the euphotic and the subsurface layers, and in the strength of nutrient upwelling at the eastern boundary currents region, causing a reduced supply of Fe, PO4, NH4+ and NO3- in the euphotic layer.
Based on the current understading of N2-fixation process, questions on whether N2-fixation efficiency will change in the future due to global warming could be intuitively anticipated.
Regarding nitrification, future changes in marine productivity will directly modify the total amount of NH4+ which is potentially oxidized. Model studies have projected a decrease in net primary production (NPP) due to a lower supply of nutrients to the euphotic layer (Steinacher et al., 2010; Bopp et al., 2013). As a consequence, less organic matter would be exported to depth, resulting in a more limited amount of NH4+ to be oxidized by nitrifying bacteria. It might therefore expect a decrease in ntirification rates on a global scale.
However, changes in seawater temperature will have a direct impact on ecosystem structures, including nitrifying bacteria. Whether the population of bacteria might change substantially in the future is a question which remains open.
Little is known about the effect of global warming on denitrification. There are no studies on how higher temperatures change the metabolic process of reducing NO3- by denitrifying bacteria. Changes in denitrifying bateria population are neither fully analyzed or understood (Freing et al., 2012).
Model studies project an increasing trend in atmospheric greenhouse gas concentration in 2100 under a variety of potential future scenarios, N2O being the only compound which shows an increase for all the future scenarios considered (Figure 10). Dedicated analysis on specific sources of N2O to the atmosphere have isolated the individual contribution of the terrestrial sources to the global radiative forcing (Stocker et al., 2013). Terrestrial N2O emissions under high CO2 business-as-usual scenario might increase by 80%, leading to a temperature increase of 0.4 to 0.5°C in 2100 in combination with CH4 soil emissions. The magnitude of the potential contribution of future oceanic N2O emissions to the radiative forcing remains unknown. Changes in nitrification will be translated into changes in N2O production, particularly when it has been suggested that most of the N2O production in the ocean interior is fuelled by the nitrification pathway (Freing et al., 2012). Therefore a decrease of N2O production is intuitively expected if primary production decreases. Transport of N2O from the subsurface to the air-sea interface might be affected too due to increased stratification. Finally, changes also in N2O solubility must be considered together with the water masses which were in contact with the atmosphere at different equilibrium concentrations of N2O.
Figure 10: Historical and projected CO2, CH4 and N2O concentrations in 2100 under different Representative
Concentration Pathways (RCPs) scenarios. Future values beyond present time are compared to previous climate reports using the former model generations and related scenarios. N2O atmospheric concentration is expected to
increase in each of the scenarios studied, up to a 33% increase in the business-as-usual high CO2 emissions
scenario. (Meinshausen et al., 2011; Ciais et al., 2013).
1.4.2. Impact of ocean deoxygenation
Ocean deoxygenarion is a consequence of the ongoing reduced ventilation associated with increased stratification, together with lower solubility due to higher seawater temperatures (Ciais et al. 2013). This fact has been reflected in ocean general circulation and biogeochemical model future projections. Figure 11 shows the decrease of the O2 content on a global scale by several IPCC class models, and the increase in the hypoxic (O2 concentration < 80 µmolL-1) volumes from 1850 to 2100 under the high CO2 business-as-usual scenario (Bopp et al., 2013). There are few long time records of O2 measurements that could confirm this hypothesis (Stramma et al., 2008, Stenardo et al., 2009), but nevertheless this result is consistent with the projections made by the previous generation of global ocean biogeochemical models (Steinacher et al., 2009; Cocco et al, 2012).
(a) (b)
Figure 11: Model projections of changes in (a) Global oxygen content (in %) and (b) O2 concentration below 80
mmol m-3 using the CMIP5 model ensemble under the business-as-usual high CO2 emissions scenario RCP8.5
(Bopp et al., 2013).
Changes in the dissolved O2 concentration are not expected to imprint significant changes in N2-fixation. N2-fixation occurs in the euphotic layer, where high levels of O2 are observed and therefore little changes are expected on this process. Moreover, few studies report sensitivity of
diazotrophs to O2 levels, as they live mostly in the ocean surface. N2-fixation does have however
sensitivity to O2, as reported by Stuart and Pearson, 1970, but future changes seem far from changing that limiting facto substantially enough.
Ocean deoxygenation might shift the boundaries of occurrence of nitrification and denitrification in the ocean interior. Nitrification is characterized by being a global process and therefore little changes are expected due to the relatively small volume of the OMZs subject to change. The expansion of the OMZs at depth will increase the occurrence of denitrification, leading to an enhanced loss of bioavailable nitrogen and an increase in N2O production and N2O consumption. While N2O production in low-O2 environments might be boosted, N2O consumption might be boosted as well by the same denitrifying bacteria in anoxic environments (Bange et al., 2000). Culture experiments have shown a high sensitivity of N2O production to O2 levels (Goreau et al., 1980; Frame and Casciotti, 2010), whereas direct observations disagree with this assumption, as shown by Zamora et al., 2012, where N2O shows a linear relationship with O2 even at OMZs such as those in the Eastern Tropical Pacific (ETP). The evolution of the balance between N2O production and consumption in the OMZs in the future remains unclear.
1.4.3. Impact of ocean acidification
The oceanic uptake of atmospheric CO2 has decreased the levels of seawater pH by 0.1 units on average since pre-industrial times (Orr et al., 2004). Model projections, following the increasing atmospheric CO2 concentration and the current absoption capacity of the ocean, suggest that pH could reach even lower levels (Steinacher et al., 2009, Bopp et al., 2013). Adaptation of phytoplankton groups and bacteria to decreased levels of seawater pH remains one of the big unknowns in biogeochemical studies. Process efficiencies and population dynamics must certainly change within changes in their environmental conditions due to ocean acidification. N2-fixation might be favoured by increasing seawater CO2 (Barcelos e Ramos et al., 2007, Hutchins et al., 2007, Hutchins et al., 2012), although their future evolution remains unclear. Barcelos e Ramos et al., 2007, analysed the effect of increasing levels of seawater CO2 on particular species of N2-fixers named Trichodesmium. Trichodesmium is supposed to be responsible of at least half of the total N2-fixation in the global ocean. In these culture experiments CO2 played the role of an additional nutrient, doubling N2-fixation rates and N2-fixers growth rates from pre-industrial to projected 2100 CO2 levels (Figure 12a and Figure 12b).
Erythraeum and Trichodesmium Thiebautii are shown in Figure 13. Boundaries of the response of
N2-fixers are defined by half saturation constants of 431 ppm and 65 ppm respectively. In both cases there is an increase of the N2-fixation rates for the whole range of seawater CO2 concentrations considered. The range of spatial changes in seawater CO2 and the distribution of the diazotrophs species sensitive to these changes will ultimately determine the future evolution of N2-fixation.
Figure 13: Experimental results of N2-fixation rates for the most and least sensitive N2-fixation species to seawater
CO2 fitted to a Michaelis-Menten curve in Hutchins et al., 2013, in particular (a) Trichodesmium Erythraeum and (b)
Trichodesmium Thiebautii.
Nitrifying bacteria show low sensitivity to changes in seawater CO2 levels (Badger et al., 2008, Berg et al., 2007). However, nitrification is sensitive to changes in pH, as shown by Huesemann et al. (2002). This study analysed the effect of increased levels of H+ concentration in estuaries (Figure 14). Nitrification efficiency decreased together with pH by 50% for changes of only 1% in pH. Changes in nitrification were further explored by Beman et al. (2011), this time from an open ocean perspective. Laboratory experiments using different cultures from different oceanic basins showed the same response of nitrifying bacteria to lower pH levels. Figure 15 shows a decrease from 5% to 20% in nitrification due to a 1% change in pH. This results suggests that future ocean acidification might have a significant impact on nitrification and therefore on N2O production.
Changes in denitrification due to lower levels of pH are unknown. Studies based on the same genetic mechanisms of denitrification in soils estimate that changes in seawater pH are not significant enough to be noticeable in denitrification (Liu et al., 2010). Therefore changes in N2O production in the OMZs are not expected to change significantly due to changes in pH.
Figure 14: Nitrification rates for different seawater pH samples at two different depths, near surface 0.5m and deeper 160m (Huesemann et al, 2002).
Figure 15: Nitrification rates in response to experimentally reduced levels of seawater pH from different samples at HOT, BATS, SPOT and Sargasso Sea locations (Beman et al., 2011).
of magnitude from the study by Dentener et al. (2004) from 38.9 to 68.9 TgN yr-1 over the same time period. It is estimated that in the future it could potentially equal the contribution of N2-fixation due to larger industrialized areas in coastal regions (Duce et al., 2008, Krishnamurthy et al., 2007). Changes of N2O production and N2O emissions due to atmospheric nitrogen deposition from pre-industrial to present were analysed by Suntharalingam et al. (2012), which could give an estimate about future changes if atmospheric deposition increases at the same rate. Atmospheric nitrogen deposition from the previous studies estimated 20/22.1 TgN yr-1 in 1851, increasing by 48/16.8 TgN yr-1 at present (Dentener et al., 2004; Duce et al., 2008). Due to these changes over the historical period N2O emissions were estimated to increase by 3 to 4%, following the imprint of additional nitrogen in export production with an increase of 4%.
There are many uncertainties on how river discharge might change in the future, however it is intuitively expected that the increasing population and therefore increasing food demand might also increase the use of fertilizers and other industrial processes that contribute to the N-budget in soils and hence in rivers. The extensive use of fertilizers will increase the river discharge over coastal regions and river basins. DaCunha et al. (2011) projected changes in biogeochemical markers such as primary production and export production in a variety of future scenarios up to 2050, assuming river discharge values from a world population of 12 billion inhabitants. The increase in river discharge of DIC, DOC, POC and DIN lead to an increase on export production of 6% in 2050, which might eventually be translated into an increase of N2O emissions in the same magnitude.
1.5. Open questions
1.5.1. Future marine N
2O emissions
The evolution of oceanic N2O emissions in the future remains largely unknown. Multiple stressors on the marine N-cycle will certainly change the N2O production, N2O transport and N2O sea-to-air flux to the atmosphere, with a potential impact on the ocean contribution to the global GHG budget and the O3 depletion process. Critical questions that have to be addressed are clustered around N2O production, N2O transport, other N2O production processes and the current capabilities of models.
Many uncertainties still exist regarding the relative contribution of nitrification and denitrification to the total N2O production budget, and how these production pathways will
evolve in the future. Although nitrification seems the dominant pathway (Freing et al., 2012), the evolution of these pathways might not be as such in the future. Changes in the volume of hypoxic and suboxic waters will definitely imply changes in the production of N2O via denitrification. Experimentally, it has been found that N2O shows a higher yield under suboxic regimes (Goreau et al., 1980; Frame and Casciotti, 2012), but also does the N2O consumption, as suggested by Zamora et al. (2013). There are many uncertainties regarding the coupling between N2O production and consumption in the boundaries and core of the OMZs respectively. Changes in the bacterial community will modify the distribution of the N2O producers in the ocean interior. Increasing temperatures will modify the metabolism of bacteria and quite likely their abundance and distribution. The CO2 attenuation effect on N2O production via nitrification (Beman et al., 2011) could reinforce the projected decrease in export of organic matter to depth in 2100 (Bopp et al., 2013). The extent at which the CO2 reduction effect is enhanced under lower levels of pH is still unknown.
The magnitude of changes in transport from the subsurface to the surface might be critical in estimating the N2O sea-to-air flux. Oceanic stratification might enlarge the N2O reservoir at deep, as any other biogeochemical compound produced or transported below the euphotic zone (Freing et al., 2012). Changes in N2O solubility will modify the N2O inventory and the gas exchange with the increasing atmospheric N2O.
The contribution of anammox as an alternative source of N2O remains largely unknown. It has been reported as one of the major sources of N2O off the Namibia coast (Kuypers, 2005), but many uncertainties remain on its adequate environmental conditions, occurrence and relative contribution among the other N2O production processes.
Uncertainties when using ocean biogeochemical models to estimate N2O sea-to-air flux has been also a matter of debate (Zamora and Oschlies, 2014). On a single model analysis, N2O production from surface nitrification represents 50% of the uncertainty, followed by the distribution of O2 in the model by 24%. Other parameters that introduce uncertianties on the estimations are the N2O consumption rate and the O2 threshold at which N2O production