HAL Id: hal-03039293
https://hal.archives-ouvertes.fr/hal-03039293
Submitted on 3 Dec 2020HAL is a multi-disciplinary open access archive for the deposit and dissemination of sci-entific research documents, whether they are pub-lished or not. The documents may come from teaching and research institutions in France or abroad, or from public or private research centers.
L’archive ouverte pluridisciplinaire HAL, est destinée au dépôt et à la diffusion de documents scientifiques de niveau recherche, publiés ou non, émanant des établissements d’enseignement et de recherche français ou étrangers, des laboratoires publics ou privés.
Resource colimitation drives competition between
phytoplankton and bacteria in the Southern Ocean
Lavenia Ratnarajah, Stéphane Blain, Philip Boyd, Marion Fourquez, Ingrid
Obernosterer, Alessandro Tagliabue
To cite this version:
Lavenia Ratnarajah, Stéphane Blain, Philip Boyd, Marion Fourquez, Ingrid Obernosterer, et al.. Resource colimitation drives competition between phytoplankton and bacteria in the Southern Ocean. Geophysical Research Letters, American Geophysical Union, 2020, �10.1029/2020GL088369�. �hal-03039293�
Resource colimitation drives competition between phytoplankton and bacteria in the 1 Southern Ocean 2 3 4 5
Lavenia Ratnarajah1, Stéphane Blain2, Philip W. Boyd3, Marion Fourquez4,3, Ingrid 6
Obernosterer2, Alessandro Tagliabue1 7
8 9
1. Department of Earth, Ocean and Ecological Sciences, School of Environmental 10
Sciences, University of Liverpool, Liverpool, United Kingdom 11
2. Sorbonne Université, CNRS, Laboratoire d’Océanographie Microbienne (LOMIC), 12
Observatoire Océanologique de Banyuls, 66650 Banyuls sur mer, France 13
3. Institute for Marine and Antarctic Studies, University of Tasmania, Tasmania, 14
Australia 15
4. Aix Marseille Univ., Universite de Toulon, CNRS, IRD, MIO UM 110, 13288, 16 Marseille, France 17 18 19 20 Corresponding author: 21
Lavenia Ratnarajah (L.Ratnarajah@liverpool.ac.uk)
22 23 24 25 26 27 28 29
Keywords: Iron, Phytoplankton, Bacteria, Competition, Southern Ocean 30
31 32 33 34
35
Key points: (140 characters) 36
1. Competition for iron between phytoplankton and bacteria is modulated by the 37
colimiting effects of light and dissolved organic carbon 38
2. When enough labile dissolved organic carbon is present, bacteria can outcompete 39
phytoplankton for iron 40
3. Phytoplankton exudation may be insufficient to stimulate bacterial dominance in the 41
absence of other dissolved organic carbon sources 42
43
Abstract (150 words) 44
Across the Southern Ocean, phytoplankton growth is governed by iron and light, whilst 45
bacterial growth is regulated by iron and labile dissolved organic carbon (LDOC). We use a 46
mechanistic model to examine how competition for iron between phytoplankton and bacteria 47
responds to changes in iron, light and LDOC. Consistent with experimental evidence, 48
increasing iron and light encourages phytoplankton dominance, whilst increasing LDOC and 49
decreasing light favours bacterial dominance. Under elevated LDOC, bacteria can 50
outcompete phytoplankton for iron, most easily under lower iron. Simulations reveal that 51
bacteria are major iron consumers, and suggest that luxury storage plays a key role in 52
competitive iron uptake. Under seasonal conditions typical of the Southern Ocean, sources of 53
LDOC besides phytoplankton exudation modulate the strength of competitive interactions. 54
Continued investigations on the competitive fitness of bacteria in driving changes in primary 55
production in iron-limited systems will be invaluable in refining these results. 56
57
Plain summary 58
In large areas of the Southern Ocean, phytoplankton growth is controlled by the availability 59
of iron and light whilst bacterial growth is controlled by the availability of iron and labile 60
dissolved organic carbon (LDOC). We developed a mechanistic model to examine how 61
phytoplankton and bacteria compete for iron under different light levels and LDOC supply. 62
We find that phytoplankton dominate as iron and light increases while increasing LDOC and 63
decreasing light favours bacterial dominance. If enough LDOC is present, bacteria can 64
outcompete phytoplankton for iron. More broadly, we find that while bacteria are a major 65
consumer of iron in the Southern Ocean, seasonal changes in light drive phytoplankton 66
dominance over bacteria, unless LDOC is supplied by other sources such as viral lysis, 67
excretion etc., which strengthen competitive interactions. 68
69
Introduction
70
Phytoplankton growth in large areas of the Southern Ocean is regulated by the micronutrient 71
iron (Fe) (Martin et al. 1994, Blain et al. 2007, Boyd et al. 2007), with seasonal co-limitation 72
by light (Mitchell et al. 1991, Strzepek et al. 2012) due to the deep mixed layers and ice cover 73
that are prevalent in early spring, autumn and winter. The low rates of primary production 74
and large-scale upwelling of deep water containing low dissolved organic carbon (DOC) 75
concentrations lead to some of the lowest surface DOC concentrations in the global ocean 76
(~40 – 50 µM, Hansell et al. 2012). While low surface dissolved Fe and DOC is thought to 77
restrict heterotrophic bacterial (hereafter bacteria) growth in the Southern Ocean (Church et 78
al. 2000, Obernosterer et al. 2015), studies from Fe-limited regions have demonstrated that 79
bacteria may also be significant consumers of dissolved Fe and can exhibit greater cellular Fe 80
quotas than phytoplankton (Tortell et al. 1996, 1999, Boyd et al. 2012, Fourquez et al. 2015, 81
2020). High bacterial Fe demand and uptake rates compared to phytoplankton suggest that 82
bacteria could be significant competitors for dissolved Fe in the Southern Ocean (Fourquez et 83
al., 2015, 2020, Mazzotta et al. 2020). 84
85
Theoretically, two species competing for the same limiting resource cannot coexist at 86
constant population levels (Hardin 1960). However, colimitation can lead to stable 87
coexistence (Burson et al. 2018) or alternative stable states, depending on ambient 88
environmental factors (e.g. resource supply and lability, temperature, light and mortality) and 89
the traits of the competing species (Tilman 1982, Brauer et al. 2012) that affect resource 90
uptake and growth (Hutchinson 1953, Titman 1976). In the Southern Ocean, the distinct 91
seasonal light cycle regulates the timing of phytoplankton blooms, whereas Fe controls the 92
magnitude of growth. While phytoplankton productivity then fluctuates according to season 93
and location (Ardyna et al. 2017), the implications of changes in Fe, DOC and light over the 94
seasonal cycle on phytoplankton-bacterial interactions are poorly understood. Upwelling of 95
deep water is generally considered to supply a relatively refractory pool of DOC (Hansell et 96
al. 2013). However, the release of labile DOC via phytoplankton exudation (Larsson and 97
Hagström 1979, Wood and Van Valen 1990) or by other biotic processes commonly linked to 98
phytoplankton production, such as sloppy feeding and faecal production by predators 99
(Lampitt et al 1990, Møller et al. 2003, Møller 2007), viral lysis (Bratbak et al. 1993, 100
Middleboe et al. 2002, Gobler et al. 2003, Poorvin et al. 2004) and phytoplankton cell 101
mortality (Veldhuis et al. 2001) suggests that seasonal changes in phytoplankton production 102
may facilitate phytoplankton and bacterial coexistence in the Southern Ocean by supplying 103
labile DOC. While labile DOC is often rapidly utilised within hours (Fourquez et al. 2014, 104
Obernosterer et al 2015), seasonal accumulation of DOC has been observed in the Bermuda 105
Atlantic Time Series (BATS) site possibly due to phosphorus limitation of bacterioplankton 106
growth (Cotner et al. 1997, Rivkin and Anderson 1997) or the accumulation of recalcitrant 107
DOC that prevents rapid utilisation (Legendre and Le Fevre 1995, Carlson and Ducklow 108
1996, Carlson et al. 1998, Cherrier et al. 1996, Søndergaard et al. 2000). The turnover time 109
for recalcitrant DOC ranges from months (semi-labile) – 40,000 years (ultra-refractory) 110
(Carlson and Ducklow 1995, Cherrier et al. 1996, Hansell et al. 2012, 2013, Lønborg et al. 111
2018). 112
113
At a cellular level, phytoplankton can use mechanisms such as Fe storage protein (i.e. 114
ferritin) and vacuolar storage that enable them to stockpile Fe for use when ambient Fe levels 115
are low (e.g., Lampe et al. 2018, Marchetti et al. 2009, Cohen et al. 2018). A more limited set 116
of observations indicates that although bacteria possess two types of ferritin-like molecules, 117
the bacterial ferritins and bacterioferritin (Andrews et al. 2003, Rivera 2017, Debeljak et al. 118
2019), the regulation of the bacterioferritin gene is unclear (Carrondo 2003). Nevertheless, 119
the higher Fe quotas observed in bacteria, relative to phytoplankton (Fourquez et al., 2015, 120
2020, Mazzotta et al. 2020, Tortell et al. 1996, Sarthou et al. 2008, Boyd et al. 2012) suggest 121
that bacteria may require more Fe, or have the capacity for luxury Fe uptake, and hence may 122
compete with phytoplankton for Fe. The parallel impact of other environmental regulatory 123
factors, such as light or labile DOC, on the outcome of such a competition are unclear. 124
125
In this study, we develop a mechanistic model to examine the competitive interactions 126
between phytoplankton and bacteria in response to Fe, light and DOC colimitation. Our 127
model was designed to assess the mechanisms behind these competitive interactions in an 128
idealised setting and to explore the implications of these interactions on seasonal bloom 129
dynamics in the Southern Ocean. We find resource competition influences the magnitude of 130
phytoplankton and bacterial biomass and rates of Fe uptake, growth and carbon fixation - 131
which depend on secondary factors affecting the growth and biomass accumulation of 132
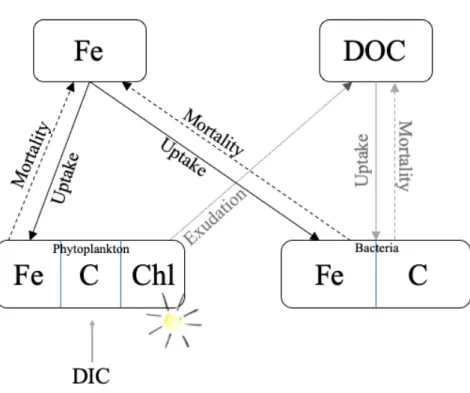
phytoplankton and bacteria, such as light, DOC and luxury Fe uptake. 133 134 2. Methods 135 2.1 Biogeochemical model 136
The rate of change in phytoplankton carbon, chlorophyll-a and dissolved Fe is based on the 137
Pelagic Integration Scheme for Carbon and Ecosystem studies (PISCES-v2, Aumont et al. 138
2015) model, which is commonly used as part of global studies of ocean Fe biogeochemistry 139
(e.g. Tagliabue et al., 2016). Here, we also explicitly account for the change in bacterial 140
carbon and Fe biomass. Changes in phytoplankton and bacterial carbon and Fe biomass, as 141
well as phytoplankton cellular chlorophyll-a are driven by rates of growth, carbon fixation, 142
chlorophyll synthesis and Fe uptake in response to Fe, light (modelled here as the 143
photosynthetic available radiation, PAR) and labile DOC (Fig. 1). We identify two sources of 144
labile DOC: phytoplankton exudation and additional biotic sources which can be supplied via 145
grazing processes (excretion, sloppy feeding), viral lysis etc. Detailed equations and specific 146
parameterisations are described in the supplementary material (Supp. methods and Supp. 147
Table 1). Here we briefly describe the underlying processes considered and their 148
dependencies. 149
150
Fe uptake by both phytoplankton and bacteria is modelled as a function of external Fe 151
availability, including luxury Fe uptake and is down regulated when maximum cellular Fe 152
quotas are reached. For simplicity, we assume phytoplankton and bacteria have the same 153
maximum cellular Fe quota of 80 µmol Fe:mol C. This is based on the maximum 154
phytoplankton cellular Fe quota used in PISCES-v2 (Aumont et al. 2015) and maximum 155
bacterial cellular Fe quota from a laboratory experiment under Fe-replete conditions 156
(Mazzotta et al. 2020). Labile DOC uptake by bacteria is modelled as a function of the 157
temperature dependant maximum specific growth rate and bacterial Fe limitation. Light 158
limitation of phytoplankton is identical to the PISCES-v2 model, explicitly accounting for 159
phytoplankton carbon production and chlorophyll synthesis. Resource limitation for both 160
phytoplankton and bacteria follow the quota model approach for Fe used in PISCES-v2 and a 161
Monod style limitation form for labile DOC. Phytoplankton carbon fixation is then a function 162
of the temperature dependant maximum growth rate and light and Fe limitation. DOC is 163
cycled via exudation and mortality and Fe is cycled via mortality (Fig. 1). DOC exudation is 164
a fixed proportion of phytoplankton carbon fixation (10%; Aumont et al. 2015). A quadratic 165
mortality drives the recycling of cellular Fe, carbon and chlorophyll. 166
167
2.2 Experimental design
168
Using our model, we explore the role of Fe-light and Fe-DOC co-regulation of phytoplankton 169
and bacteria using two sets of model simulations at a constant temperature of 1°C. We first 170
run a set of simulations with phytoplankton alone, across a range of light and Fe levels (from 171
1 W m-2 to 40 W m-2 and 0 to 1 nM for PAR and Fe, respectively) and bacteria alone, across
172
a range of labile DOC and Fe levels (from 0 to 100 µM and 0 to 1 nM for total DOC and total 173
Fe, respectively). These initial experiments allow us to explore the separate responses of 174
phytoplankton and bacteria to changing light, Fe and DOC levels. We then run a second set 175
of experiments with both phytoplankton and bacteria competing under varying light and Fe 176
(Fe-PAR), with a fixed DOC level of 5 µM (broadly representative of typical labile DOC 177
levels, Hansell et al. 2009), and varying Fe and DOC (Fe-DOC), with a fixed light level of 20 178
W m-2 (broadly representative of typical mixed layer average Southern Ocean light levels). 179
To specifically address the potential role played by luxury Fe uptake in bacteria, we run a 180
parallel simulation with variable cellular Fe quota for phytoplankton, but fixed the Fe quota 181
for bacteria at a constant 10 µmol Fe:mol C (Aumont et al. 2015). We use the model results 182
after 35 days of integration (by which time the model has reached quasi steady state) in our 183
analysis. 184
185
3. Results and Discussion 186
3.1 Response to resource co-limitation in the absence of competitive interactions
187
Increasing Fe and light leads to an expected increase in phytoplankton carbon biomass (Fig. 188
2a), with the phytoplankton cellular Fe quota (Fe:C ratio) increasing as ambient Fe 189
concentration increases (Fig. 2b). However as light increases in parallel to Fe, phytoplankton 190
accumulate less cellular Fe relative to carbon because of high rates of growth and carbon 191
fixation (Fig. 2b, c). Increasing Fe and DOC similarly leads to an increase in carbon biomass 192
of bacteria (Fig. 2d). Although bacteria reach their maximum cellular Fe quota in all our 193
simulations, bacterial growth remained restricted at low DOC concentrations due to DOC 194
limitation which leads to high Fe:C ratios due to low rates of C assimilation (Fig. 2e). 195
Increasing Fe and DOC in parallel results in a 7-fold increase in bacterial growth rate (Fig. 196
2f). 197
198
3.2 How does iron-light influence phytoplankton-bacterial interactions?
199
Competition for Fe between phytoplankton and bacteria affects growth rates, production and 200
Fe uptake, which influences the relative accumulation of biomass. Under varying Fe and 201
light, but fixed DOC, competition with bacteria decreases phytoplankton biomass by 3 – 60% 202
(Fig. 3a) relative to the simulations with only phytoplankton due to bacterial Fe uptake, with 203
greatest change observed at the lowest Fe levels across all light levels. We denote the 1:1-line 204
(i.e. region where phytoplankton biomass equals bacteria biomass), which separates regions 205
of phytoplankton (blue) and bacterial (red) biomass dominance as the ‘line of coexistence’. 206
This line of coexistence when defined in terms of carbon biomass is very similar to that 207
defined from the specific growth rate (d-1, orange dash) and carbon production rate (orange 208
solid) (Fig. 3b), due to their fundamental role in driving biomass accumulation in our model. 209
Below the line of coexistence (red area), bacteria are dominant, but their biomass remains 210
low as low levels of phytoplankton productivity results in insufficient DOC supply from 211
phytoplankton exudation. Above this line of coexistence (blue area), increasing light and Fe 212
increases phytoplankton growth rate and carbon production resulting in overall phytoplankton 213
dominance as they outcompete bacteria for Fe. As phytoplankton biomass increases, the DOC 214
inventory increases via exudation, which stimulates bacterial growth in parallel, but bacterial 215
biomass remains less than phytoplankton biomass (Supp. Fig. 1a, b). This is because the 216
exudation of DOC by phytoplankton at the start of the experiment is insufficient for bacteria 217
to outcompete phytoplankton. The low DOC levels allow phytoplankton to respond more 218
strongly in general by increasing growth rates, carbon production and biomass (Supp. Fig. 1a, 219
b and 2a, b). 220
221
The difference in the rates of Fe uptake between phytoplankton and bacteria (Fig. 3c) show a 222
slightly different form to that seen for biomass, growth and carbon fixation at low Fe and 223
light. Bacteria consume up to 50% of the ambient Fe pool at low Fe (< 0.2 nM) and light (<8 224
W m-2) levels due to low phytoplankton biomass levels and higher Fe uptake efficiency (i.e. 225
lower bacterial half saturation constant for Fe uptake, Supp. Table 1), but increasing Fe and 226
light causes greater phytoplankton biomass to accumulate (Fig. 3c). We find that 227
phytoplankton can outcompete bacteria for Fe uptake at high light and Fe (Fig. 3c) due to 228
their higher biomass and growth rate (Supp. Fig. 1a and 2a, b). In contrast, when bacteria rely 229
solely on phytoplankton exudation as a DOC source, bacteria become relatively poor 230
competitors for available Fe across these experiments. 231
232
3.3 How does iron-DOC influence phytoplankton-bacterial interactions?
233
Under varying Fe and DOC, but fixed light, bacteria receive two sources of DOC; DOC from 234
phytoplankton exudation and DOC from additional biotic processes. In the natural 235
environment, zooplankton excretion, viral lysis and sloppy feeding represent additional biotic 236
sources of DOC as well as Fe. Whilst there are limited quantitative estimates on the 237
contribution from each component, Antarctic krill were shown to excrete 188 – 560 µM 238
labile DOC that was rapidly utilised by the bacterial community within the 140 – 160 hour 239
experimental duration leading to an increase in bacterial biomass and production (Arístegui et 240
al. 2014). 241
242
In contrast to the Fe-PAR simulation (where the only DOC was from phytoplankton 243
exudation), phytoplankton-bacterial competition increases bacterial biomass (‘+’, Fig. 3d) 244
more substantially (by up to 90% at low DOC levels), relative to the simulations with bacteria 245
alone. The increase in bacterial biomass is driven by high phytoplankton biomass growth 246
rates and carbon production (Supp. Fig. 1c, d and 2d, d) which adds to the DOC inventory via 247
phytoplankton exudation thereby facilitating bacterial growth (Fig. 3d, e). An exception is at 248
high DOC and low Fe where competitive Fe uptake by phytoplankton results in a small 249
(<6%) decrease in bacterial biomass (‘-’, Fig. 3d). Greater DOC levels increasingly shift the 250
dominance from phytoplankton to bacteria throughout this experiment, pointing to the 251
importance of DOC in driving the competitive fitness of bacteria. The biomass line of 252
coexistence is similar to the 1:1 line for carbon production (orange solid), but phytoplankton 253
growth rate at this point is ~10% greater than bacterial growth rate (Fig. 3e, Supp. Fig. 2). Fe 254
uptake is decoupled from biomass levels and carbon production rates (Fig. 3f versus 3e). 255
Bacteria consume between 50 – 80% of the ambient Fe pool except at low DOC (Fig. 3f). 256
While the Fe-PAR simulation suggests that bacteria are poor competitors for available Fe 257
when they rely solely on phytoplankton exudation as a source of DOC, we find that bacteria 258
are more effective competitors for Fe as total (phytoplankton exudation + additional biotic 259
processes) DOC increases. 260
261
At the extremes, our simulations show phytoplankton dominance under increasing light and 262
Fe (Fig. 3b and Supp. Fig. 1a and 3b), but bacterial dominance under increasing total DOC 263
and decreasing light (Fig. 3e and Supp. Fig. 1b, d and 3a, b). We find that under moderate 264
light levels (20 W m-2), coexistence between phytoplankton and bacteria can be facilitated 265
when labile DOC increases in tandem with Fe up to around 20 – 30 µM DOC. However, 266
stable coexistence is only found in our simulations at low biomass levels where colimitation 267
constrains both phytoplankton and bacterial populations (Fig. 3b, e). Overall, our simulations 268
show that in the presence of sufficient labile DOC, bacteria are effective competitors with 269
phytoplankton for Fe, exacerbating phytoplankton Fe limitation, most notably under 270
moderate light levels. 271
Our model suggests that bacteria are an important consumer of Fe (Fig. 3c, f), in line with the 273
field studies that demonstrated higher Fe uptake by bacteria compared to phytoplankton 274
(Tortell et al. 1996, Sarthou et al. 2008, Boyd et al. 2012, Fourquez et al. 2015, 2020). 275
Furthermore, we find that bacteria are unable to sustain high growth rates in the absence of 276
luxury Fe uptake (Supp. Fig. 4). If phytoplankton were the only organisms undertaking 277
luxury Fe uptake in our model, then phytoplankton would outcompete bacteria everywhere 278
above the lowest light levels (2 W m-2) required to sustain phytoplankton growth, even at 279
very high labile DOC levels (100 µM) as phytoplankton are able to rapidly consume and 280
store any available Fe (Supp. Fig 4a – d). This highlights the importance of bacterial Fe 281
storage in shaping the competition between phytoplankton and bacteria for Fe and is 282
consistent with other approaches based on metalloproteins (Mazzatto et al. 2020). 283
284
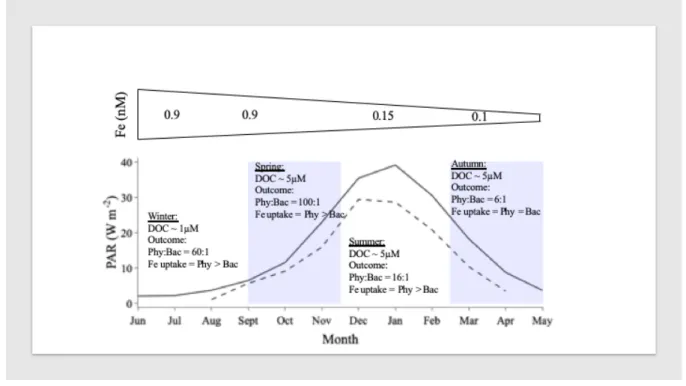
3.4 Impact of covariance in Fe, PAR and DOC over the Southern Ocean seasonal cycle
285
There are two distinct regions within the Southern Ocean; the sub Antarctic zone (SAZ) and 286
polar zone (PZ) which each encounter 4 different seasonal regimes; Winter (June – August), 287
Spring (September – November), Summer (December – February), and Autumn (March – 288
May). The availability of Fe, DOC and PAR is likely to vary between these 4 regimes and 289
between the SAZ and PZ. We use satellite estimates of PAR (NASA Ocean Colour Data, 290
VIIRS OBPG 2019) coupled with Fe fluxes from observations and modelling studies (Fig. 4) 291
and the assumption that labile DOC exudation is ~10% of phytoplankton primary production, 292
to initialise our model and examine the strength of phytoplankton-bacterial interactions in 293
each seasonal regime. 294
295
In winter, deep mixed layers and ice cover results in complete darkness in the PZ, while PAR 296
levels remain around 2 – 7 W m-2 in the SAZ (Fig. 4). As the supply of deep Fe will be 297
maximal at this time, dissolved Fe levels in seawater will be expected to reach their seasonal 298
maxima of around 0.9 nM in the surface open ocean (Tagliabue et al. 2014) and perhaps >1 299
nM closer to the shelf (Tagliabue et al. 2012). At this time of year, there is only a deep source 300
of refractory DOC in large areas of the open ocean (Hansell et al. 2013). Under these 301
conditions, we find that phytoplankton and bacterial biomass are low in the SAZ where there 302
is low light. Yet the very low biomass of phytoplankton take up ~98% of the Fe pool and 303
deplete its concentration from 0.9 nM to 0.3 only after 35 days. Over this time, phytoplankton 304
biomass can increase to from 0.1 to 6 µmol C L-1 but we observe no sustained increase in 305
bacterial biomass despite a build-up of 1 µM of DOC in our experiment from phytoplankton 306
exudation. Phytoplankton outcompeted bacteria because the low labile DOC at the onset of 307
the experiment constrained bacterial growth, and instead allowed phytoplankton to drawdown 308
Fe and moderately increase in biomass despite the apparent light limitation. To maintain 309
seawater dissolved Fe levels of >0.7 nM throughout winter in the SAZ, either Fe must be 310
continuously supplied via deep winter mixing (Tagliabue et al. 2014) or >50% of the 311
particulate Fe in phytoplankton and bacteria needs to be rapidly recycled. In the PZ, despite 312
the darkness, grazing by the resident zooplankton community (e.g. Antarctic krill, Walsh et 313
al. 2020) under the winter ice can lead to the coupled release of Fe and DOC potentially 314
driving competition between bacteria and low-light acclimated ice algae, a community of 315
phytoplankton not modelled in this study. 316
317
In spring, PAR levels increase to 20 W m-2 in the PZ and 30 W m-2 in the SAZ (Fig. 4). 318
Shoaling of the mixed layer maintains high dissolved Fe stock of ~0.9 nM at the onset of 319
spring (Tagliabue et al. 2014). Initialising our model under these high Fe and light levels, 320
coupled with the 1 µM of DOC that built up over the winter period, we find that 321
phytoplankton outcompete bacteria at a ratio of 100:1 and consume >98% of the dissolved Fe 322
pool within 13 (PAR 30 W m-2) to 15 (PAR 20 W m-2) days because the low DOC at the 323
onset of spring allows phytoplankton to outcompete bacteria. PAR continues to increase to 324
the seasonal maximum of 30 W m-2 in the PZ and 40 W m-2 in the SAZ during summer, but 325
dissolved Fe concentrations tend to decrease to ~0.15 nM in the surface open ocean as 326
phytoplankton have depleted the winter stock and recycling turns over the dissolved Fe stock 327
rapidly (Strzepek et al. 2005, Boyd et al. 2012, Tagliabue et al. 2014). Under low Fe and high 328
light conditions, and assuming a labile DOC stock of ~5 µM in addition to continual DOC 329
exudation (10% of primary production) (Hansell et al. 2009), phytoplankton take up ~80% of 330
the ambient Fe and phytoplankton biomass ~16 times greater than bacteria. From late 331
summer into autumn the mixed layer starts to deepen, PAR decreases from 20 to 0 W m-2 332
(Fig. 4) and Fe is at its seasonal minimum (~0.1 nM, Tagliabue et al. 2012). Here 333
phytoplankton take up ~55% of the Fe and phytoplankton biomass is ~6 times greater than 334
bacteria. 335
336
The low standing stocks of Fe in spring/summer do not preclude fast recycling via 337
bacterivory and herbivory coupled with rapid utilisation (Strzepek et al. 2005). Bacterivory 338
and herbivory would lead to the coupled release of Fe and DOC. If we assume greater levels 339
of Fe and labile DOC, that might be representative of the greater recycling (e.g. bacterivory; 340
Strzepek et al. 2005), then the competitive fitness of bacteria is enhanced. Our results suggest 341
that the amount of DOC necessary to switch the dominance from phytoplankton to bacteria 342
varies as a non-linear function of Fe (black line in Fig 3e). At the low Fe levels typical of 343
summer as little as 20-30 µM DOC would alter the competitive outcome, while at higher Fe 344
levels typical of earlier in the bloom phase more DOC is needed (Fig 3e). 345
346
Our analysis suggests that decreasing light and Fe, coupled with a small DOC inventory (5 347
µM) facilitates Fe uptake by bacteria, but microbial Fe uptake is decoupled from carbon 348
production. Phytoplankton biomass is consistently greater than bacterial biomass across all 349
seasons. Bacteria require >50 µM of labile DOC to outcompete phytoplankton biomass in 350
spring. This decreases to 40 µM in summer, 15 µM in autumn and 8 µM in winter. Bacteria 351
require less DOC as the season progresses because of the colimiting effects of Fe and light on 352
phytoplankton growth. This suggests that sources such as ice, dust, sediments, recycling etc. 353
with varying Fe and DOC levels may influence different components of the microbial 354
community, with the strength of the interaction further compounded by seasonal effects on 355
phytoplankton growth. 356
357
4. Competition under changing climate: uncertainties and future work
358
There is a strong interest in understanding the response of phytoplankton to a changing 359
climate due to its role in the global carbon cycle and supporting ocean fisheries. Southern 360
Ocean surface seawater is predicted to warm by 2 – 3°C by the year 2100. Both 361
phytoplankton and bacterial metabolism respond positively with an increase in temperature 362
(Rivkin et al. 1996, Pomeroy and Wiebe 2001, Deppeler and Davidson 2016, Toseland et al. 363
2013). But there is substantial disagreement on how temperature could regulate 364
phytoplankton-bacterial interactions and DOC production and stimulation. Bacterial 365
production could follow an increase in primary production and not temperature (Kirchman et 366
al. 1995, Morán et al. 2006) or respond to an increase in temperature and not primary 367
production (Hoppe et al. 2008). Our analysis finds that bacteria can outcompete 368
phytoplankton leading to a decrease in phytoplankton biomass if sufficient labile DOC is 369
available which can be found in regions of high recycling (Ruiz-Halpern et al. 2011, 370
Arístegui et al. 2014) and ice melt (Norman et al. 2010, Underwood et al. 2010), where there 371
is also concurrent release of Fe, a concept that has previously not been considered in our 372
understanding of the Fe cycle in the Southern Ocean (Tagliabue et al., 2014). As ice melt 373
increases with rising temperatures, the increase in Fe and DOC supply coupled with an 374
increase in temperature may stimulate bacterial communities at the expense of phytoplankton. 375
Furthermore, increased temperature can lead to increased DOC exudation by phytoplankton 376
(Zlotnik and Dubinsky 1989) and greater microbial degradation of recalcitrant DOC 377
(Lønborg et al. 2018), which suggests the potential for greater DOC availability under 378
warmer climate. However, ice melt can strongly stratify the surface water, thereby relieving 379
phytoplankton light limitation and strengthening competition with bacteria. 380
381
Additional feedbacks, not explored in this study, are the interactions around the bacterial 382
production of siderophores in response to Fe scarcity (e.g. Boiteau et al., 2016) and the 383
weaker Fe binding agents associated with phytoplankton exudates, such as saccharides 384
(Hassler et al., 2011) or heme groups (Louropoulou et al., 2020), or the role of bacterivory in 385
recycling the Fe stored in bacteria (Tortell et al. 1996, Strzepek et al. 2005, Boyd et al. 2012, 386
Boyd et al. 2015, Mazzotta et al. 2020). Furthermore, along the coastal Antarctic sea-ice edge 387
communities, phytoplankton are limited by cobalamin (vitamin B12) and Fe (Bertrand et al.
388
2015). As cobalamin is only produced by bacteria and archaea, this suggest that 389
phytoplankton-bacterial interactions mediate micronutrient colimitation for nutrients other 390
than Fe as well. As such, more experimental-modelling work is required to gain a better 391
mechanistic understanding of how the competitive interactions between phytoplankton and 392
bacteria could change in response to multiple concurrent environmental changes. 393
394
5. Conclusions
395
Overall, we find that resource co-limitation and competition alters the response of 396
phytoplankton and bacteria. Phytoplankton growth rate decreases due to competition for Fe 397
uptake by bacteria. In contrast, the increase in DOC supplied via phytoplankton exudation 398
leads to an increase in bacterial growth rate but is insufficient to stimulate bacterial biomass 399
to an extent that bacteria outcompete phytoplankton. If additional DOC is supplied, for 400
instance from recycling or sea ice melting, then bacteria can successfully outcompete 401
phytoplankton for Fe and depress rates of phytoplankton productivity. As large areas of the 402
Southern Ocean are characterised by low dissolved Fe-low labile DOC, the seasonal cycle of 403
light and ensuing exudation, grazing, viral lysis and cell death which increases DOC 404
inventory ultimately regulates phytoplankton-bacterial interactions. 405
406
Acknowledgements 407
This project has received funding from the European Research Council (ERC) under the 408
European Union’s Horizon 2020 research and innovation programme (Grant agreement No. 409
724289). The model used in this study is based on the global 3D biogeochemical model 410
PISCES as described in Aumont et al. 2015 and freely available as part of the NEMO 411
modelling platform. The NEMO code is available from https://www.nemo-ocean.eu. The 412
equations and parameters used in this study are provided in the supplementary material. 413
Mixed layer depth data was sourced from deBoyer-Montegut et al. 2004 ( 414
http://www.ifremer.fr/cerweb/deboyer/mld/Surface_Mixed_Layer_Depth.php) and PAR was 415
sourced from NASA Ocean Color (VIIRS monthly climatological data at 4km resolution 416
https://oceancolor.gsfc.nasa.gov/l3/). 417
418
419
Figure 1: Schematic of model configuration with 2 biological pools – phytoplankton and 420
bacteria, and 3 resources –dissolved iron (Fe), light and dissolved organic carbon (DOC). Fe 421
and DOC are taken up by phytoplankton and bacteria (solid lines) and recycled via mortality 422
(dashed lines) and phytoplankton exudation (dotted). 423
424 425
426 427 428 429 430 431 432
433 434 Fe-PAR Fe-DOC Phytoplankton Bacteria Biomass a) d) Fe:C ratio b) e) Growth rate c) f)
Figure 2: Steady state response of phytoplankton under iron (Fe) and light (PAR) 435
colimitation (a – c) and bacteria under Fe and dissolved organic carbon (DOC) colimitation 436
(d – f) in the absence of competitive interactions. Changes in carbon biomass (a, d), cellular 437
Fe quota (b, e) and growth rate (c, f). Note that the response of Fe:C ratios (2e) in the 5 µM 438
DOC, 0.5 nM Fe (dotted line) treatment is hidden behind the 5 µM DOC, 1.0 nM Fe (dot 439
dash) treatment. 440
442 443
Fe-PAR Fe-DOC
Changes in biomass compared to reference simulation
a) d)
Competitive outcome for biomass, carbon production and growth rate
b) e)
Relative iron uptake
Figure 3: Steady state response of phytoplankton and bacteria as they compete for iron (Fe) 444
under Fe – light (PAR) (a – c) and Fe – dissolved organic carbon (DOC) colimitation (d – f). 445
Carbon biomass relative to no competition simulation (a, d). Difference in biomass (black), 446
growth rate (orange dash) and carbon production rate (orange solid) between phytoplankton 447
and bacteria (b, e). Difference in Fe uptake rate between phytoplankton and bacteria (c, f). 448
All lines denote regions where phytoplankton and bacteria are equal and separate regions of 449
phytoplankton (blue) and bacterial (red) dominance. 450
451 452
453 454
Figure 4: Top panel represents dissolved iron (Fe) fluxes from observations and modelling 455
studies. Bottom panel demonstrates average mixed layer depth integrated light (PAR; based 456
on VIIRS Ocean Colour Data, Ocean Biology Processing Group 2019 and de Boyer 457
Montegut 2004) for the subAntarctic (solid line) and polar (dashed line) zones and 458
assumptions of labile dissolved organic carbon (DOC) available for bacteria used to initialise 459
the model. Highlighted rectangular regions represent austral spring and autumn. 460 461 462 463 464 465
466
References 467
468
1. Andrews SC, Robinson AK and Rodríguez-Quiñones (2003) Bacterial iron 469
homeostasis. FEMS Microbiology Reviews 27(2-3): 215-237 470
471
2. Ardnya M, Claustre H, Sallée JB, D’Ovidio F, Gentili B, D’Ortenzio F and Arrigo K 472
(2017) Delineating environmental control of phytoplankton biomass and phenology in the 473
Southern Ocean. Geophysical Research Letters 5016 – 5024 474
475
3. Arístegui J, Duarte CM, Reche I and Gómez-Pinchetti JL (2014) Krill excretion 476
boosts microbial activity in the Southern Ocean. PLoS One 9(2) 477
478
4. Aumont O, Ethé C, Tagliabue A, Bopp L and Gehlen M (2015) PISCES-v2: an ocean 479
biogeochemical model for carbon and ecosystem studies. Geoscientific Model Development 480
8: 2465 – 2513 481
482
5. Bertrand E, McCow JP, Moustafa A, Zheng H, McQuaid JB, Delmont TO, Post AF, 483
Sipler RE, Spackeen JL, Xu K, Bronk DA, Hutchins DA and Allen AE (2015) 484
Phytoplankton-bacterial interactions mediate micronutrient co-limitation at the coastal 485
Antarctic sea ice edge. Proceedings of the National Academy of Sciences 112 (32) 9938 – 486
9943 487
488
6. Blain S, Quéguiner B, Armand L, Belviso S, Bombled L, Bopp L, Bowie A, Brunet 489
C, Brussard C, Carlotti F, Christaki U, Corbière A, Durand I, Ebersbach F, Fuda, J-L, Garcia 490
N, Gerringa L, Griffiths B, Guigue C, Guillerm C, Jacquet , Jeandel C, Laan P, Lefèvre, D, 491
Monaco CL, Malits A, Mosseri J, Obernosterer I, Park Y-H, Picheral M, Pondaven P, 492
Remenyi T, Sandroni V, Sarthou G, Savoye N, Scouarnec L, Souhaut M, Thuiller D, 493
Timmermans K, Trull T, Uitz J, van Beek P, Veldhuis M, Vincent E, Viollier E, Vong L and 494
Wagener T (2007) Effect of natural iron fertilization on carbon sequestration in the Southern 495
Ocean. Nature 446: 1070 – 1074 496
497
7. Boiteau RM, Mende DR, Hawco NJ, McIIlwin MR, Fitzsimmons JN, Saito MA, 498
Sedwick PN, DeLong EF and Repeta DJ (2016) Siderophore-based microbial adaptations to 499
iron scarcity across the eastern Pacific Ocean. Proceedings of the Natural Academy of 500
Science 113(50): 14237-14242 501
502
8. Boyd PW, Jickells T, Law CS, Blain S, Boyle EA, Buesseler KO, Coale KH, Cullen 503
JJ, de Baar HJW, Follows M, Harvey M, Lancelot C, Levasseur M, Owens NPJ, Pollard R, 504
Rivkin RB, Sarmiento J., Schoemann V, Smetacek V, Takeda S, Tsuda A, Turner S and 505
Watson AJ (2007) Mesoscale iron enrichment experiments 1993-2005: synthesis and future 506
directions. Science 315: 612 – 617 507
508
9. Boyd PW, Strzepek R, Chiswell S, Chang H, DeBruyn JM, Ellwood M, Keenan S, 509
King AL, Maas EW, Nodder S, Sander SG, Sutton P, Twining B, Wilhelm SW and Hutchins 510
D (2012) Microbial control of diatom bloom dynamics in the open ocean. Geophysical 511
Research Letters 39 (18): 1 – 6 512
513
10. Bratbak G, Egge JK and Heldal M (1993) Viral mortality of the marine alga Emiliana 514
huxleyi (Haptophycaea) and termination of algal blooms. Marine Ecology Progress Series 93: 515
39 – 48 516
517
11. Brauer VS, Stomp M and Huisman J (2012) The Nutrient-Load Hypothesis: Patterns 518
of Resource Limitation and Community Structure Driven by Competition for Nutrients and 519
Light. The America Naturalist 179 (6): 721 – 740 520
521
12. Burson A, Stomp M, Greenwell E, Grosse J and Huisman J (2018) Competition for 522
nutrients and light: testing advances in resource competition with a natural phytoplankton 523
community. Ecology 99 (5): 1109 – 1118 524
525
13. Carlson CA and Ducklow HW (1995) Dissolved organic carbon in the upper ocean of 526
the central Equatorial Pacific, 1992: Daily and finescale vertical variations. Deep-Sea 527
Research II 42: 639 – 656 528
529
14. Carlson CA and Ducklow HW (1996) Growth of bacterioplankton and consumption 530
of dissolved organic carbon in the Sargasso Sea. Aquatic Microbial Ecology 10:69–85 531
15. Carlson CA, Ducklow HW, Hansell DA and Smith WO (1998) Organic carbon 533
partitioning during spring phytoplankton blooms in the Ross Sea Polynya and the Sargasso 534
Sea. Limnology and Oceanography 43:375–386 535
536
16. Carrondo MA (2003) Ferritins, iron uptake and storage from the bacterioferritin 537
viewpoint. The EMBO Journal 22: 1959–1968. 538
539
17. Cherrier J, Bauer JE and Druffel ERM (1996) Utilization and turnover of labile 540
dissolved organic matter by bacterial heterotrophs in eastern North Pacific surface waters. 541
Marine Ecology Progress Series 139:267–279 542
543
18. Church MJ, Hutchins, DA and Ducklow HW (2000) Limitation of bacterial growth by 544
dissolved organic matter and iron in the Southern Ocean. Applied and Environmental 545
Microbiology 66 (2):455-466 546
547
19. Cohen NR, Mann E, Stemple B, Morena CM, Rauschenberg S, Jacquot JE, Sunda 548
WG, Twining BS and Marchetti A (2018) Iron storage capacities and associated ferritin gene 549
expression among marine diatoms. Limnology and Oceanography 63 (4): 1677-1691 550
551
20. Cotner JB, Ammerman JW, Peele ER and Bentzen E (1997) Phosphorus-limited 552
bacterioplankton growth in the Sargasso Sea. Aquatic Microbial Ecology 13:141–149 553
554
21. De Boyer Montegut C, Madec G, Fischer AS, Lazar A and Iudicone, D. (2004) Mixed 555
layer depth over the global ocean: An examination of profile data and a profile-based 556
climatology. Journal of Geophysical Research 109, C12003 557
558
22. Debeljak P, Toulza E, Beier S, Blain S and Obernosterer I (2019) Microbial iron 559
metabolism as revealed by gene expression profiles in contrasted Southern Ocean regimes. 560
Environmental Microbiology 21(7): 2360–2374 561
562
23. Deppeler SL and Davidson AT (2017) Southern Ocean phytoplankton in a changing 563
climate. Frontiers in Marine Science 564
24. Fourquez M, Devez A, Schaumann A, Guéneuguès A, Jouenne T, Obernosterer I, and 566
Blain S (2014) Effects of iron limitation on growth and carbon metabolism in oceanic and 567
coastal heterotrophic bacteria. Limnology and Oceanography 59: 349 – 360. 568
569
25. Fourquez, M, Bressac, M, Deppeler, SL, Ellwood, M, Obernosterer, I, Trull, TW and 570
Boyd, PW (2020) Microbial Competition in the Subpolar Southern Ocean: An Fe–C Co-571
limitation Experiment. Frontiers in Marine Science. 572
573
26. Fourquez, M, Obernosterer, I, Davies, DM, Trull, TW and Blain, S. (2015). Microbial 574
iron uptake in the naturally fertilized waters in the vicinity of the Kerguelen Islands: 575
phytoplankton–bacteria interactions. Biogeosciences. doi:10.5194/bg-12-1893-2015. 576
577
27. Gobler CJ, Hutchins DA, Fisher NS, Cosper EM and Sańudo-Wilhelmy SA (2003) 578
Release and bioavailability of C, N, P, Se and Fe following viral lysis of a marine 579
chrysophyte. Limnology and Oceanography 42 (7): 1492 – 1504 580
581
28. Hansell DA, Carlson CA, Repeta, DJ and Schlitzer R. (2009) Dissolved organic 582
matter in the ocean: A controversy stimulates new insights. Oceanography 22: 202–211 583
584
29. Hansell DA, Carlson CA and Schlitzer R (2012) Net removal of major marine 585
dissolved organic carbon fractions in the subsurface ocean. Global Biogeochemical Cycles 26 586
(1): 1 – 9 587
588
30. Hansell DA (2013) Recalcitrant Dissolved Organic Carbon Fractions. Annual 589
Reviews 5: 421 – 445 590
591
31. Hardin G (1960) The competitive exclusion principle. Science 131 (3409): 1392 – 592
1297 593
594
32. Hassler CS, Schoemann V, Nichols CM, Butler ECV and Boyd PW (2011) 595
Saccharides enhance iron bioavalability to Southern Ocean phytoplankton. Proceesings of the 596
Natural Academy of Science 108(3): 1076-1081 597
33. Hoppe HG, Breithaupt P, Walther K, Koppe R, Bleck S, Sommer U and Jürgens K 599
(2008) Climate warming in winter affects the coupling between phytoplankton and bacteria 600
during the spring bloom: a mesocosm study. Aquatic Microbial Ecology 51: 105-115 601
602
34. Hutchinson E (1953) The concept of pattern in ecology. Proceedings of the Natural 603
Academy of Science 105: 1 – 12 604
605
35. Kirchman DL, Rich JH and Barber RT (1995) Biomass and biomass production of 606
heterotrophic bacteria along 140°W in the equatorial Pacific: Effect of temperature on the 607
microbial loop. Deep Sea Research Part II: Topical Studies in Oceanography 42(2-3): 603-608
619 609
610
36. Lampe RH, Mann EL, Cohen NR, Till CP, Thamatrakoln K, Brzezinski, MA, Bruland 611
KW, Twining BS and Marchetti A (2018) Different iron storage strategies among bloom-612
forming diatoms. Proceedings of the National Academy of Sciences. 115 (52): 12275 – 613
12284 614
615
37. Lampitt RS, Noji T and von Bodungen B (1990) What happens to zooplankton faecal 616
pellets? Implications for material flux. Marine Biology 104 (1): 15 – 23 617
618
38. Larsson U and Hagström A (1979) Phytoplankton exudate release as an energy source 619
for the growth of pelagic bacteria. Marine Biology 52 (3): 199 – 206 620
621
39. Legendre L and Le Fevre J (1995) Microbial food webs and the export of biogenic 622
carbon in oceans. Aquatic Microbial Ecology 9: 69–77 623
624
40. Louropoulou E, Gledhill M, Achterberg EP, Browning TJ, Honey DJ, Schmitz RZ 625
and Tagliabue A (2020) Heme b distributions through the Atlantic Ocean: evidence for 626
“anemic” phytoplankton populations. Scientific Reports 10(4551) 627
628
41. Lønborg C, Álvarez-Salgado XA, Letscher RT and Hansell DA (2018) Large 629
stimulation of recalcitrant dissolved organic carbon degradation by increasing ocean 630
temperature. Frontiers in Marine Science 631
632
42. Marchetti A, Parker MS, Moccia LP, Lin EO, Arrieta AL, Ribalet F, Murphy MEP, 633
Maldonado MT and Armbrust, EV (2009) Ferritin is used for iron storage in bloom-forming 634
marine pennate diatoms. Nature 457: 467-470 635
636
43. Martin JH, Fitzwater SE and Gorgon MR (1994) Iron deficiency limits phytoplankton 637
growth in Antarctic waters. Global Biogeochemical Cycles 4 (1) 5 – 12 638
639
44. Mazzotta MG, McIIvin MR and Saito MA (2020) Characterization of the Fe 640
Metalloproteome of a Ubiquitous Marine Heterotroph, Pseudoalteromonas (BB2-AT2): 641
Multiple Bacterioferritin Copies enable significant Fe Storage 642
643
45. Middelboe M and Lyck PG (2002) Regeneration of dissolved organic matter by viral 644
lysis in marine microbial communities. Aquatic Microbial Ecology 27:187–194 645
646
46. Mitchell BG, Brody EA, Holm-Hansen O, McClain C and Bishop J (1991) Light 647
limitation of phytoplankton biomass and macronutrient utilization in the Southern Ocean. 648
Limnology and Oceanography 36 (8): 1662 – 1677 649
650
47. Morán XAG, Sebastián M, Pedrís-Alií C and Estrada M (2006) Response of Southern 651
Ocean phytoplankton and bacterioplankton production to short-term experimental warming. 652
Limnology and Oceanography 51(4): 1791-1800 653
654
48. Møller EF, Thor P and Nielsen TG (2003) Production of DOC by Calanus 655
finmarchicus, C. glacialis and C. hyperboreus through sloppy feeding and leakage from fecal 656
pellets. Marine Ecology Progress Series 262:185 – 191 657
658
49. Møller EF (2007) Production of dissolved organic carbon by sloppy feeding in the 659
copepods Acartia tonsa, Centropages typicus, and Temora longicornis. Limnology and 660
Oceanography 52 (1): 79 – 84 661
662
50. NASA Goddard Space Flight Center, Ocean Ecology Laboratory, Ocean Biology 663
Processing Group; (2019): Visible Infrared Imaging Radiometer Suite (VIIRS). Maintained 664
by NASA Ocean Biology Distributed Active Archive Centre (OB. DAAC), Goddard Space 665
Flight Centre, Greenbelt MD. 666
667
51. Norman L, Thomas DN, Stedmon CA, Granskog MA, Papadimitriou S, Krapp RH, 668
Meiners KM, Lannuzel D van der Merwe P and Dieckmann GS (2010) The characteristics of 669
dissolved organic matter (DOM) and chromophoric dissolved organic matter (CDOM) in 670
Antarctic sea ice. Deep-Sea Research II 58: 1075-1091 671
672
52. Obernosterer I, Fourquez M and Blain S (2015) Fe and C co-limitation of 673
heterotrophic bacteria in the naturally fertilized region off the Kerguelen Islands. 674
Biogeosciences 12 (6): 1983-1992 675
676
53. Pomeroy LR and Wiebe WJ (2001) Temperature and Substrates as Interactive 677
Limiting Factors for Marine Heterotrophic Bacteria. Aquatic Microbial Ecology 23: 187-204. 678
679
54. Poorvin L, Rinta-Kanto JM, Hutchins DA and Wilhelm SW (2004) Viral release of 680
iron and its bioavailability to marine plankton 49(5): 1734-1741 681
682
55. Rivera M (2017) Bacterioferritin: Structure, Dynamics, and Protein-Protein 683
Interactions at Play in Iron Storage and Mobilization. Accounts of Chemical Research 50(2): 684
331–340 685
686
56. Rivkin RB, Anderson MR and Lajzerowicz C (1996) Microbial processes in cold 687
oceans. I. Relationship between temperature and bacterial growth rate. Aquatic Microbial 688
Ecology 10: 243-254 689
690
57. Rivkin RB and Anderson MR (1997) Inorganic nutrient limitation of oceanic 691
bacterioplankton. Limnology and Oceanography 42:730 – 740 692
693
58. Ruiz Halpern S, Duarte CM, Tovar-Sanchez A, Pastor M, Horstkotte B, Lasternas S 694
and Agustí S (2011) Antarctic krill as a source of dissolved organic carbon to the Antarctic 695
ecosystem. Limnology and Oceanography 56: 521-528. 696
59. Sarthou G, Vincent D, Christaki U, Obernosterer I, Timmermans KR and Brussaard 698
CPD (2008) The fate of biogenic iron during a phytoplankton bloom induced by natural 699
fertilisation: impact of copepod grazing. Deep- Sea Research II Topical Studies in 700
Oceanogrraphy 55: 734 – 751. 701
702
60. Søndergaard M, Williams PJleB, Cauwet G, Riemann B, Robinson C, Terzic S, 703
Woodward EMS and Worm J (2000) Net accumulation and flux of dissolved organic carbon 704
and dissolved organic nitrogen in marine plankton communi- ties. Limnol Oceanogr 705
45(5):1097–1111 706
707
61. Strzepek RF, Maldonado MT, Higgins JL, Hall J, Safi K, Wilhelm SW and Boyd PW 708
(2005) Spinning the “Ferrous Wheel”: The importance of the microbial community in an iron 709
budget during the FeCycle experiment. Global Biogeochemical Cycles 19: 1-14 710
711
62. Strzepek RF, Hunter KA, Frew RD, Harrison PJ and Boyd PW (2012) Iron-light 712
interctions differ in Southern Ocean phytoplankton. Limnology and Oceanography 57 (4): 713
1182 – 1200 714
715
63. Tagliabue A, Mtshali T, Aumont O, Bowie AR, Klunder MB, Roychoudhury AN and 716
Swart S (2012) A global compilation of dissolved iron measurements: focus on distributions 717
and processes in the Southern Ocean. Biogeosciences 9: 2333-2349 718
719
64. Tagliabue A, Sallée JB, Bowie AR, Lévy M, Swart S and Boyd P.W (2014) Surface-720
water iron supplies in the Southern Ocean sustained by deep winter mixing. Nature 721
Geoscience 7: 314 – 320 722
723
65. Tagliabue A, Aumont O, Death R, Dunne JP, Dutkiewicz S, Galbraith E, Misumi K, 724
Moore JK, Ridgwell A, Sherman E, Stock C, Vichi M, Völker C and Yool A (2016) How 725
well do global ocean biogeochemistry models simulate dissolved iron distributions? Global 726
Biogeochemical Cycles 30(2): 149-174 727
728
66. Tilman DG (1982) Resource competition and community structure. Monographs in 729
population biology 17: 1 – 296 730
67. Titman D (1976) Ecological competition between algae: experimental confirmation of 732
resource-based competition theory. Science 192 (4238): 463 – 465 733
734
68. Tortell PD, Maldonado MT and Price NM (1996) The role of heterotrophic bacteria in 735
iron-limited ocean ecosystems. Nature 383: 330–332 736
737
69. Tortell PD, Maldonado MT, Granger J and Price NM (1999) Marine bacteria and 738
biogeochemical cycling of iron in the oceans FEMS Microbiology Ecology 29(1): 1-11 739
740
70. Toseland A, Daines, S.J, Clark, J.R, Kirckham A, Strauss J, Uhlig C, Lenton T.M, 741
Valentin K, Pearson GA, Moulton V and Mock T (2013) The impact of temperature on 742
marine phytoplankton resource allocation and metabolism. Nature Climate Change 3: 979-743
984 744
745
71. Underwood GJC, Fietz S, Papadimitriou S, Thomas DN and Dieckman GS (2010) 746
Distribution and composition of dissolved extracellular polymeric substances (EPS) in 747
Antarctic sea ice. Marine Ecology Progress Series 404: 1-19 748
749
72. Veldhuis M, Kraay G and Timmermans K (2001) Cell death in phytoplankton: 750
correlation between changes in membrane permeability, photosynthetic activity, pigmentation 751
and growth. European Journal of Phycology 36 (2): 167 – 177 752
753
73. Walsh J, Reiss CS and Watters GM (2020) Flexibility in Antarctic krill Euphausia 754
superba decouples diet and recruitment from overwinter sea ice conditions in the northern 755
Antarctic Peninsula. Marine Ecology Progress Series 642: 1-19 756
757
74. Wood AM and Van Valen LM (1990). Paradox lost? On the release of energy-rich 758
compounds by phytoplankton. Marine Microbial Food Webs 4: 103–116. 759
760
75. Zlotnik I and Dubinsky Z (1989) The effect of light and temperature on DOC 761
excretion by phytoplankton. Limnology and Oceanography 34(5): 831-839 762
763 764 765 766