HAL Id: inserm-03209084
https://www.hal.inserm.fr/inserm-03209084
Submitted on 27 Apr 2021
HAL is a multi-disciplinary open access archive for the deposit and dissemination of sci-entific research documents, whether they are pub-lished or not. The documents may come from teaching and research institutions in France or abroad, or from public or private research centers.
L’archive ouverte pluridisciplinaire HAL, est destinée au dépôt et à la diffusion de documents scientifiques de niveau recherche, publiés ou non, émanant des établissements d’enseignement et de recherche français ou étrangers, des laboratoires publics ou privés.
in France
Marc Souris, Jean-Paul Gonzalez
To cite this version:
Marc Souris, Jean-Paul Gonzalez. COVID-19: Spatial analysis of hospital case-fatality rate in France. PLoS ONE, Public Library of Science, 2020, 15 (12), pp.e0243606. �10.1371/journal.pone.0243606�. �inserm-03209084�
RESEARCH ARTICLE
COVID-19: Spatial analysis of hospital
case-fatality rate in France
Marc SourisID1*, Jean-Paul GonzalezID2,3,4
1 UMR Unite´ des Virus E´ mergents (UVE Aix-Marseille Univ-IRD 190-Inserm 1207-IHU Me´diterrane´e Infection), Marseille, France, 2 Department of Microbiology & Immunology, School of Medicine, Georgetown University, Washington, DC, United States of America, 3 Commonwealth Trade Partners Inc., Alexandria, VA, United States of America, 4 Centaurus Biotech LLC, Manassas, VA, United States of America *marc.souris@ird.fr
Abstract
When the population risk factors and reporting systems are similar, the assessment of the case-fatality (or lethality) rate (ratio of cases to deaths) represents a perfect tool for analyz-ing, understanding and improving the overall efficiency of the health system. The objective of this article is to estimate the influence of the hospital care system on lethality in metropoli-tan France during the inception of the COVID-19 epidemic, by analyzing the spatial variabil-ity of the hospital case-fatalvariabil-ity rate (CFR) between French districts. In theory, the hospital age-standardized CFR should not display significant differences between districts, since hospital lethality depends on the virulence of the pathogen (the SARS-CoV-2 virus), the vul-nerability of the population (mainly age-related), the healthcare system quality, and cases and deaths definition and the recording accuracy. We analyzed hospital data on COVID-19 hospitalizations, severity (admission to intensive care units for reanimation or endotracheal intubation) and mortality, from March 19 to May 8 corresponding to the first French lock-down. All rates were age-standardized to eliminate differences in districts age structure. The results show that the higher case-fatality rates observed by districts are mostly related to the level of morbidity. Time analysis shows that the case-fatality rate has decreased over time, globally and in almost all districts, showing an improvement in the management of severe patients during the epidemic. In conclusion, it appears that during the first critical phase of COVID-19 ramping epidemic in metropolitan France, the higher case-fatality rates were generally related to the higher level of hospitalization, then potentially related to the overload of healthcare system. Also, low hospitalization with high case-fatality rates were mostly found in districts with low population density, and could due to some limitation of the local healthcare access. However, the magnitude of this increase of case-fatality rate represents less than 10 per cent of the average case-fatality rate, and this variation is small compared to much greater variation across countries reported in the literature.
a1111111111 a1111111111 a1111111111 a1111111111 a1111111111 OPEN ACCESS
Citation: Souris M, Gonzalez J-P (2020) COVID-19:
Spatial analysis of hospital case-fatality rate in France. PLoS ONE 15(12): e0243606.https://doi. org/10.1371/journal.pone.0243606
Editor: Muhammad Adrish, BronxCare Health
System, Affiliated with Icahn School of Medicine at Mount Sinai, NY, USA, UNITED STATES
Received: June 5, 2020 Accepted: November 20, 2020 Published: December 15, 2020
Peer Review History: PLOS recognizes the
benefits of transparency in the peer review process; therefore, we enable the publication of all of the content of peer review and author responses alongside final, published articles. The editorial history of this article is available here:
https://doi.org/10.1371/journal.pone.0243606
Copyright:© 2020 Souris, Gonzalez. This is an open access article distributed under the terms of theCreative Commons Attribution License, which permits unrestricted use, distribution, and reproduction in any medium, provided the original author and source are credited.
Data Availability Statement: The data underlying
the results presented in the study are available from www.data.gouv.fr/fr/datasets/donnees-hospitalieres-relatives-a-lepidemie-de-covid-19. The authors of the present study had no special
Introduction
Since the beginning of the epidemic, the lethality rate, or case-fatality rate (CFR) of COVID-19 and the differences between countries have been the subject of many questions about national pandemic response policies and patient treatment. Most studies on the lethality of COVID-19 seek to estimate the true lethality of the disease, an issue that has been addressed since the beginning of the epidemic [1–4].
The case-fatality rate is the ratio between the number of deaths due to the disease and the number of closed cases (i.e. recovered or dead). It is estimated by the healthcare system based on the reporting of these two values. The case-fatality rate should not be confused with the mortality rate, which is the ratio of the number of deaths to the total population, or also with the morbidity rate, which is the ratio of the number of cases to the total population. Mortality and morbidity rates depend on the extent of disease in a population, unlike case-fatality rates [5].
The case-fatality rate of a disease in a population is an index of severity of the disease in that population, and of the capacity of the healthcare system to reduce mortality. In principle, this allows to compare the effectiveness of healthcare systems across regions or countries.
The aim of this article is to analyze the effectiveness of the healthcare system in France in the context of the COVID-19 epidemic. This study also discusses the differences and the com-parison on case-fatality rates published by the international agency by country (May 2020).
Lethality depends on the virulence of the virus but, unlike morbidity, it does not depend on its contagiousness. Virulence comes from the reproductive capacity of the virus in the cell, its capacity for cellular degradation, and its ability to induce or not an innate or specific immune response. Virulence is of purely biological origin and once the virus has entered the target cell where it will cause its pathogenic effect does no longer depends on environmental conditions outside the host. Virulence is independent of the host population but may change over time and space if there is a risk of natural mutation/selection of the pathogen [6–8]. Contagiousness characterizes the biological capacity of the virus to reach the target cell system of its host, and the ability to be transmitted from one individual to another. The efficiency of transmission depends largely on environmental conditions (e.g., climate, urbanization, population density, mobility), which can vary greatly from one country to another.
In addition to the virulence of the virus, the case-fatality rate depends on viral load, on bio-logical risk factors and on population vulnerability (age structure, genetic factors, prevalence of co-morbidities, healthcare accessibility, etc.) as well as other factors related to the health sys-tem (equipment, capacity, staff, management, care of patients, effectiveness of therapies, patient management in a critical phase of the disease), and factors related to the detection and registration system for cases and deaths (clinical cases definition, detection, surveillance sys-tems, case and death reporting). The evaluation of the case-fatality rate normally requires the detection and counting of all infected persons, irrespective of their level of symptoms (i.e. dis-ease severity).
When the population risk factors and reporting systems are identical, case-fatality rate eval-uation represents an excellent tool for analyzing, understanding and improving the overall performance of the health system, particularly at the level of hospital units. Studying the mag-nitude of differences in case-fatality rates between units also makes it possible to assess the impact of the quality of the health system on case-fatality.
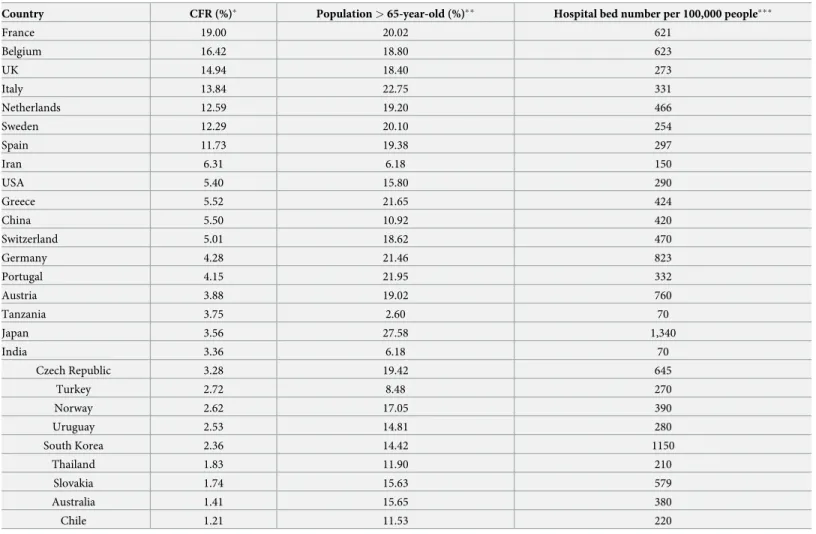
There are large differences in the case-fatality rates of COVID-19 published by country (Table 1) or calculated directly from WHO data. These rates vary considerably, from less than 0.02 (Thailand, Australia, Chile) to more than 0.15 (France, Belgium, UK), with a mean at 0.04 and a standard deviation of 0.045 (WHO, May 8, 2020,Fig 1).
privileges in accessing these datasets which other interested researchers would not have.
Funding: The authors received no specific funding
for this work.
Competing interests: The authors have declared
In Europe, the characteristics of populations (in terms of risk factor for COVID-19) and health systems are comparable, but the definition, detection and reporting of cases and causes of death can differ greatly from one country to another. Some countries conducted significantly more detection tests and hospitalizations than others (Table 2), resulting in differences in the protocols for patient management. The rate of testing performed (policy) and mortality rates (reporting) vary mainly according to the geographical extent of the epidemic within each country.
The virulence of the COVID-19 pathogen (SARS-CoV-2 virus) is assumed to be identical in all countries. In order to compare case-fatality rates across regions or countries (and thus ana-lyze the effectiveness of healthcare systems), it is necessary, when calculating rates, to standard-ize population-related risk factors and to use the same definitions and enumeration methods to record cases and deaths. This is not the case for the current pandemic and discrepancies exist among the country systems.
The principal objective of this article is not to estimate the actual lethality of COVID-19 in France based on the rates published by the health authorities, but to estimate the influence of the healthcare system on lethality by analyzing the spatial variability of the hospital case-fatality Table 1. Case-fatality rates and characteristics of countrywide population vulnerability to COVID-19.
Country CFR (%)� Population > 65-year-old (%)�� Hospital bed number per 100,000 people���
France 19.00 20.02 621 Belgium 16.42 18.80 623 UK 14.94 18.40 273 Italy 13.84 22.75 331 Netherlands 12.59 19.20 466 Sweden 12.29 20.10 254 Spain 11.73 19.38 297 Iran 6.31 6.18 150 USA 5.40 15.80 290 Greece 5.52 21.65 424 China 5.50 10.92 420 Switzerland 5.01 18.62 470 Germany 4.28 21.46 823 Portugal 4.15 21.95 332 Austria 3.88 19.02 760 Tanzania 3.75 2.60 70 Japan 3.56 27.58 1,340 India 3.36 6.18 70 Czech Republic 3.28 19.42 645 Turkey 2.72 8.48 270 Norway 2.62 17.05 390 Uruguay 2.53 14.81 280 South Korea 2.36 14.42 1150 Thailand 1.83 11.90 210 Slovakia 1.74 15.63 579 Australia 1.41 15.65 380 Chile 1.21 11.53 220
�Lethality rate for Covid-19 reported among selected countries from WHO, as for May 8, 2020 (https://covid19.who.int/)
��population percentage over 65-year-old by World Bank, 2016
���Hospital beds per 100,000 people by World Bank, 2013, Eurostat, 2014.
rate (confirmed hospitalized cases and hospital deaths) in metropolitan France between dis-tricts (i.e. Frenchdépartements). This analysis, limited to metropolitan France, is possible
while it remains within the framework of the same system for defining and counting cases and deaths. We thus assume that this system of definition and enumeration was identical through-out France during the period (19 March to 8 May) corresponding to the first wave (inception) of the COVID-19 epidemic in France. Therefore the study focuses on the extent of spatial dif-ferences in the case-fatality rate in metropolitan France, and enables to highlight the relative differences between districts, as well as to analyze the causes independently of the system of definition and enumeration of cases and deaths, and also independently of the main biological risk factor of severity (age) after standardization on this factor.
The other objective is to analyze the case-fatality rate observed in metropolitan France with the one calculated for other countries: the variability of the case-fatality rate between French Fig 1. Distribution of case-fatality rates calculated by country, based on case and death data from WHO (WHO, May 8, 2020).
https://doi.org/10.1371/journal.pone.0243606.g001
Table 2. SARS-Cov-2 detection, COVID-19 morbidity and mortality rates by selected country.
Country rtPCR Test number per 1,000� Morbidity rate (cases per million) Mortality rate (death per million)
Belgium 44 4488 735 Spain 41 5494 558 Italy 39 3570 495 Germany 33 2022 88 Australia 29 271 4 United States 25 3906 232 United Kingdom 22 3045 451 France 21 2678 398 Turkey 15 1586 43 Netherlands 14 2438 309 South Korea 12 211 5 Iran 6 1246 78 Japan 1.5 122 4.5 India 1 41 1.4 Indonesia 0.5 48 3.5
Source: Worldometer, May 8, 2020.
districts (mainly due to patient management in the acute epidemic phase) allow us to estimate whether this observed variability can explain the significant differences in case-fatality rates observed between France and other countries.
Data and methods
Data
This study is based on daily hospitalization and death declaration data by district in France and is accessible on the “Sante´ Publique France” website. (www.data.gouv.fr/fr/datasets/ donnees-hospitalieres-relatives-a-lepidemie-de-covid-19) from March 19 to May 8, 2020, cor-responding to 50 days lockdown (i.e. quarantine) and the spread of the COVID-19 epidemic in France (Fig 2). We used data on the distribution of hospitalized COVID-19 cases according to age group (10-year age group) (Sante´ Publique France). We also obtain demographic data by districts (source: population by age, INSEE, 2020,www.insee.fr), healthcare system (num-ber of hospital beds) and some health status rates (hypertension, coronary disease, acute respi-ratory disease, diabetes) by districts (source: Ecosante´ France,www.ecosante.fr, 2016),
This analysis was carried out on the 96 districts of metropolitan France (Fig 3), while the French overseas districts and territories were excluded from the analysis for reasons of spatial analysis and mapping. The data were integrated into a geographic information system (Sav-GIS,ww.savgis.org) for analysis and mapping.
Focusing only on confirmed hospitalized cases and deaths in hospital, the case-fatality rates calculated in this article for France refer to the hospital case-fatality rates and do not represent the absolute national case-fatality that should include all positive cases and deaths related to COVID-19. Given the estimated high number of non-severe and asymptomatic forms (which a fortiori do not cause deaths)—it is estimated that only 2.6% of infected persons were hospi-talized [9]—this overall lethality is necessarily much lower than hospital lethality, but it will be accurately calculated only at the end of the epidemic when the total number of positive cases (i.e. seroprevalence survey) will be available and the total number of deaths outside hospital due to COVID-19 will be accurately assessed.
All identified and hospitalized cases were tested positive (by rtPCR). All deaths counted were COVID-19 associated. As of May 8, 2020, not all hospitalized cases are closed since the epidemic is still ongoing: deaths counted at the beginning of the study period correspond to cases hospitalized but were not included in the study, and cases counted at the end of the period were not closed and no deaths from these cases were included in the study.
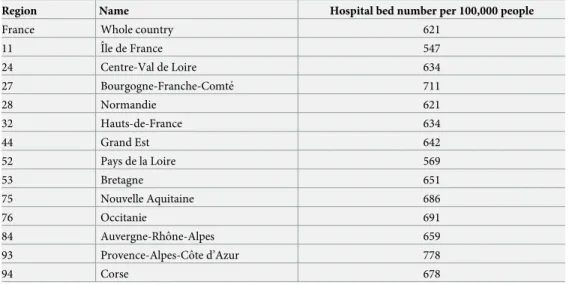
The hospital healthcare system in France offer a mean of 621 Hospital beds per 100,000 people. The hospital healthcare system is fairly evenly distributed throughout the metropolitan territory, as shown inTable 3for regions (www.ecosante.fr).
Fig 2. COVID-19 timeline of hospitalizations (left) and death (right), March, 19 to May, 8 2020, France.
Methods
Age standardization. Since age is a major risk factor for death for COVID-19 patients, to
compare hospitalization rates, mortality rates, or case-fatality rates between districts it’s important to eliminates the differences between districts due to differences in age structure of the population of the districts. We performed an indirect standardization [10] by calculating the rate (hospitaliza-tion rate and hospital lethality rate) per ten-years age group for the whole of France. We also esti-mated lethality rate for the whole of France excluding areas that have been under hospital stress (Ile-de-France and Grand-Est), in order to evaluate hospital case-fatality rates per age group inde-pendently of possible excess mortality due to the saturation of healthcare systems in certain dis-tricts. Classically,Ei(expected number of deaths in districti) is the sum over the different age groups of the district’s population in the age group multiplied by the hospital case-fatality rate of the age group:
Ei¼
X
age class a
Pi;a�Ta
wherePi,ais the population of the age group “a” of the districti and Tais the hospital case-fatality rate of the age group calculated over the whole country.
Standardized case-fatality rate. The Standardized Lethality Ratio (SLR) is equal to the
ratio between the observed death tollOi and the expected death toll Ei. The standardized
hos-pital case-fatality rateLSifor each district is equal to the average rate for France multiplied by the district’s SLR. The significance of the SLR (H0: SLR = 1, no statistically significant over— or under-fatality compared to the expected value) is evaluated for each district by a Breslow & Day test [11,12] in order to account for the statistical significance of the differences in these ratios between districts. In order to take into account the problem of multiple testing [13] when the null hypothesis concerns the whole territory (“is there a district for which the H0 Fig 3. The 96 districts of metropolitan France.
hypothesis is rejected?”), the risk of error was set at 0.0005 in order to apply a Bonferonni cor-rection (which is very conservative when data is spatially autocorrelated). When the study is conducted for a single district (“Is the SLR for this district different from 1?”), the risk of error is set at 0.05. All tests are bilateral.
Besides age, another risk factors for severity and mortality have been observed for COVID-19, including hypertension, cardiovascular disease history, diabetes, obesity. Even if these risk factors are often related to age, to detect another risk factor for lethality (as healthcare saturation) using districts comparison, it would be useful to standardize on these factors to. Unfortunately, apart for age, we do not have the necessary data to evaluate the global case-fatality rates due to COVID-19 for these risk factors or combination of factors. To overcome this difficulty, we analyzed rela-tionships between CFR and health risk factors rates (diabetes, coronary disease, hypertension, respiratory syndrome), but these correlations should be used with caution due to possible ecologi-cal fallacy (they should be done at individual level, but these data are not available).
Cartography. The values of morbidity rates, mortality rates, non-standardized
case-fatal-ity rates, SLRs and their significance were mapped by districts. In order to map case-fatalcase-fatal-ity rates independently of the rate calculation variability, due to differences in hospitalization numbers between districts, rates adjusted with empirical Bayesian estimator (EBE) were calcu-lated [14]. All statistical and spatial analysis and mapping were carried out using the SavGIS geographic information system v. 9.15 (www.savgis.org).
Study of statistical correlations. In order to estimate whether possible congestion in the
healthcare system influenced hospital case-fatality rate, we studied the correlations between hospitalization and hospital lethality by district over the entire period. Inpatient severity was estimated using the ICU rate (number of patients admitted in intensive care /number of inpa-tients). We analyzed also relationship between standardized CFR and healthcare system capac-ity (bed number per people).
Results
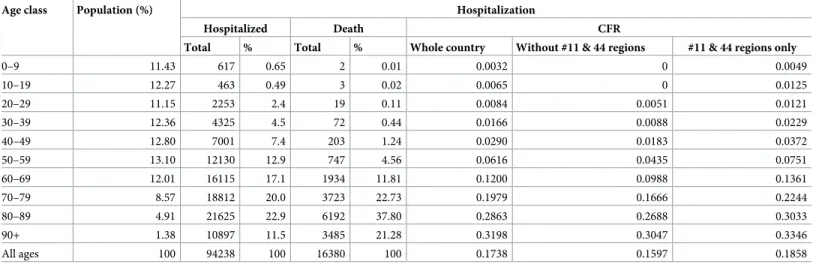
For the whole of France (data from 19 March to 8 May 2020), the hospital case-fatality rate was 0.174. The average hospital case-fatality rates by age group, used in indirect standardization, was calculated from French Public Health data by age class published on 8 May 2020 (Table 4). Table 3. Hospital bed number per 100,000 people, per regions in France.
Region Name Hospital bed number per 100,000 people
France Whole country 621
11 Iˆle de France 547 24 Centre-Val de Loire 634 27 Bourgogne-Franche-Comte´ 711 28 Normandie 621 32 Hauts-de-France 634 44 Grand Est 642 52 Pays de la Loire 569 53 Bretagne 651 75 Nouvelle Aquitaine 686 76 Occitanie 691 84 Auvergne-Rhoˆne-Alpes 659
93 Provence-Alpes-Coˆte d’Azur 778
94 Corse 678
The epidemic in France (data from 19 March to 8 May 2020) presents a very uneven spatial distribution of hospitalizations. It has spread throughout the country at low level, with a mean hospitalization rate of 1.27 per 1,000 (median at 0.88) and a standard deviation of 1.03, except in some regions where transmission has been much more active, such as the Ile-de-France region (mean hospitalization rate 3.01 per 1,000), or the Grand-Est region (mean hospitaliza-tion rate 3.2 per 1,000). The mean hospitalizahospitaliza-tion rate varies from 0.19 per 1,000 (Tarn-et-Garonne) to 4.75 (Territoire de Belfort) (Fig 4).
Table 4. Hospitalization, mortality and case-fatality rates by age group in metropolitan France (2020).
Age class Population (%) Hospitalization
Hospitalized Death CFR
Total % Total % Whole country Without #11 & 44 regions #11 & 44 regions only
0–9 11.43 617 0.65 2 0.01 0.0032 0 0.0049 10–19 12.27 463 0.49 3 0.02 0.0065 0 0.0125 20–29 11.15 2253 2.4 19 0.11 0.0084 0.0051 0.0121 30–39 12.36 4325 4.5 72 0.44 0.0166 0.0088 0.0229 40–49 12.80 7001 7.4 203 1.24 0.0290 0.0183 0.0372 50–59 13.10 12130 12.9 747 4.56 0.0616 0.0435 0.0751 60–69 12.01 16115 17.1 1934 11.81 0.1200 0.0988 0.1361 70–79 8.57 18812 20.0 3723 22.73 0.1979 0.1666 0.2244 80–89 4.91 21625 22.9 6192 37.80 0.2863 0.2688 0.3033 90+ 1.38 10897 11.5 3485 21.28 0.3198 0.3047 0.3346 All ages 100 94238 100 16380 100 0.1738 0.1597 0.1858
(Region 11 = Ile-de-France; region 14 = Grand-Est).
https://doi.org/10.1371/journal.pone.0243606.t004
Fig 4. Hospitalization rate (left) and hospital mortality rate (per 1000 inhabitants) (right) for COVID-19 in metropolitan France for the period March 19 to May 8,
2020.
The hospital mortality rate (not age-standardized) has the same spatial distribution. It varies from 0.01 per 1,000 (Tarn-et-Garonne) to 1.13 per 1,000 (Territoire de Belfort), with a mean of 0.21 (median 0.12) and a standard deviation of 0.21.
Such relative differences in the circulation of the disease reported by districts in French metropolitan area clearly appears in the cartogram displayed below (Fig 5).
The observed gross hospital case-fatality rate calculated by district showed a mean of 0.153 with a standard deviation of 0.045. It varies between 0.046 (Ariège) and 0.258 (Vosges). With-out Ile-de-France and Grand-Est regions, the mean gross case-fatality rate per district is 0.149 with a standard deviation of 0.048 (Fig 6).
Case-fatality rates have evolved over the period of the study. Here we represent non-stan-dardized rates calculated for three periods: March 19 to 31; April 1 to 12; April 13 to 25. Rates are calculated with a 12-day time lag between cases and deaths (Fig 7).
The standardized case-fatality rate per district is between 0.044 (Ariège, SLR = 0.25) and 0.255 (Vosges, SLR = 1.48), with the mean at 0.151 and the median at 0.153. If the Ile-de-France and Grand-Est regions are excluded from the calculation of age-specific case-fatality rates, the CFR is between 0.044 and 0.251, with the mean at 0.144 and a median at 0.147 (SLR between 0.28 and 1.67, mean at 0.99 and median at 1) (Fig 8). In the following, we will consider only the standardized case-fatality rates calculated with age-specific case-fatality rates that do not take into account the Ile-de-France and Grand-Est regions.
The spatial distribution of standardized morbidity rate (hospitalized cases) shows a significant spatial autocorrelation (Moran index: 1.54, p-value < 10−6), and this is expected for an infectious disease [14,15]. The case-fatality rate shows also significant spatial autocorrelation (Moran index: 0.29, p-value < 0.000007), and this is no expected. The analysis of the clusters clearly shows a
Fig 5. Cartogram of the standardized hospitalization rate for COVID-19 in France from March 19 to May 8, 2020.
The geometry of the districts in France is shown in the lower left corner.
clustering of high case-fatality rate values in regions of high morbidity (particularly the Grand-Est), and shows some cases of districts with high case-fatality rate values isolated in areas with low rates.
The Breslow & Day significance test for SLR shows districts where the SLR is statistically significantly different from 1, corresponding to districts with abnormally high (SLR > 1, red) or abnormally low (SLR < 1, green) standardized case-fatality rates. The individual signifi-cance threshold is set at 0.05, and for all districts at 0.0005 to account for multi-testing (Fig 9).
There is no correlation between hospital capacity (bed number per 100,000) and COVID-19 standardized case-fatality rate per district (Bravais-Pearson index r = -0.11).
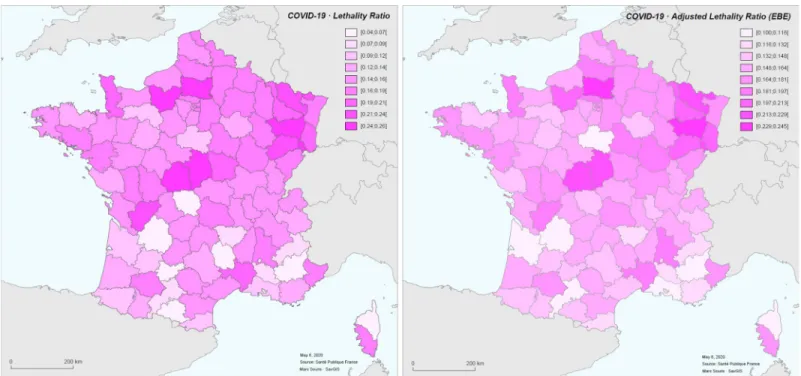
At district level, there is no significant correlation (Bravais-Pearson index r = 0.14) between case-fatality rate and health risk factors rate (coronary disease, hypertension, acute respiratory Fig 6. Case-fatality rate (left) and case-fatality rate adjusted by empirical Bayesian estimator (right) for the COVID-19 epidemic in France from 19 March to 8 May
2020.
https://doi.org/10.1371/journal.pone.0243606.g006
Fig 7. Calculated case-fatality rates by 13-day period.
Fig 8. Standardized Lethality Ratio (SLR) for COVID-19 in metropolitan France for the period March 19 to May 8, 2020.
https://doi.org/10.1371/journal.pone.0243606.g008
Fig 9. Geographical units (districts) with SLR significance: P-value <0.05 (left), p-value < 0.0005 (right).
disease, diabetes). Further investigation with patient data will be necessary to analyze the possi-ble influence of individual health risk factors on SLR at district level
However, there is a significant correlation between the standardized hospitalization rate and the standardized case-fatality rate (Bravais-Pearson index r = 0.40) (Fig 10). The correla-tion increases (0.48) if we limit the calculacorrela-tion to districts whose SLR is significantly (p-value < 0.05) different from 1.
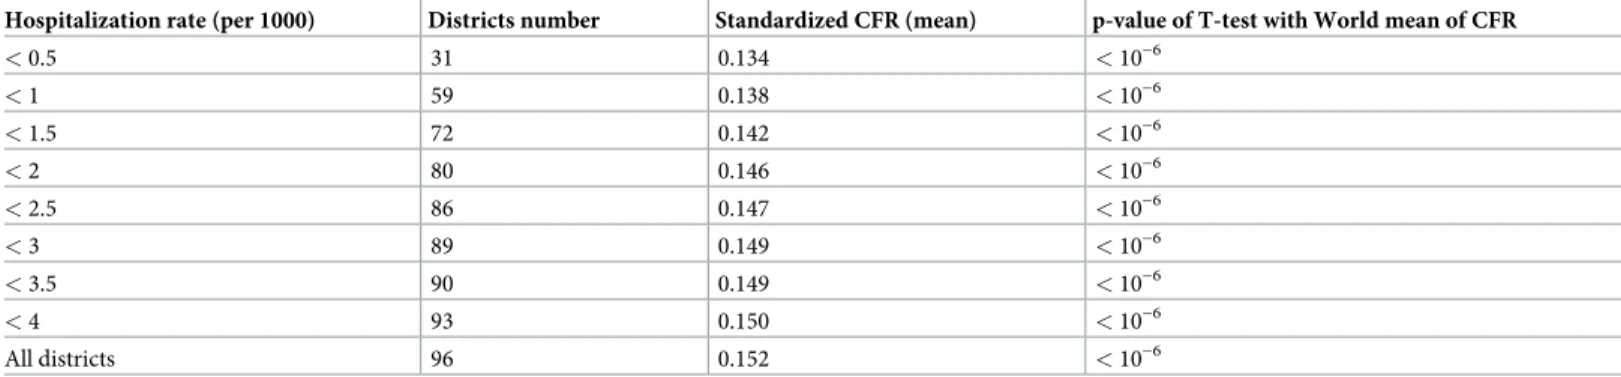
To illustrate the increase of case-fatality rate with hospitalization rate,Table 5gives the mean of the standardized case-fatality rate over the districts according to their standardized hospitalization rate. The average case-fatality rate varies from 0.134 for districts with a low hos-pitalization rate (less than 0.5 per 1000, 31 districts) to 0.152 for all 96 districts. If only districts with high hospitalization rates (above 2 per 1000, 16 districts) are considered, the average case-fatality rate is 0.183. For the eight districts with the highest hospitalization rates (> 3 per 1,000), and considered as district under hospital stress, the average case-fatality rate is 0.191 (Meuse, Moselle, Seine-St-Denis, Hauts-de-Seine, Paris, Val-de-Marne, Haut-Rhin, Territoire de Belfort), while it is 0.149 for all other districts.
A T-test shows that the mean of standardized CFR in France is very significantly (p-value < 10−6) higher than the world CFR average, even for districts with low hospitalization rate.
The mapping of the hospitalization rate and the hospital mortality rate with the SLR shows the strong spatial correspondence of these values (Fig 11).
A typology combining hospitalization rates and case-fatality rates is proposed: low rates (values below the mean by less than one standard deviation), high rates (values above the Fig 10. Correlation between hospitalization rate and CFR during the COVID-19 epidemic in France for the period of time between March 19 to May 8, 2020.
https://doi.org/10.1371/journal.pone.0243606.g010
Table 5. Average standardized CFR as a function of hospitalization rate during the COVID-19 epidemic in France for the period of time between March 19 to May 8, 2020.
Hospitalization rate (per 1000) Districts number Standardized CFR (mean) p-value of T-test with World mean of CFR
< 0.5 31 0.134 < 10−6 < 1 59 0.138 < 10−6 < 1.5 72 0.142 < 10−6 < 2 80 0.146 < 10−6 < 2.5 86 0.147 < 10−6 < 3 89 0.149 < 10−6 < 3.5 90 0.149 < 10−6 < 4 93 0.150 < 10−6 All districts 96 0.152 < 10−6 https://doi.org/10.1371/journal.pone.0243606.t005
mean by more than one standard deviation), so as to represent five classes (low-low, low-high, high-low, high-high, other) (Fig 12). The "high hospitalization-high case-fatality rate" class is spatially clustered. The "low hospitalization rate-high lethality rate" class is dispersed, and the population density is significantly lower in that class than in all the other districts (p-value < 0.02).
We call “severity rate” the ratio between the rate of patients in intensive care unit (for reani-mation or endotracheal intubation) and the rate of hospitalization. It gives in principle an indi-cation of the severity of the patients in hospital. At district level, the hospitalization rate and this severity rate show a low negative correlation (r = -0.22), indicating a decrease in intensive care rate when the hospitalization rate is high. This trend may be due to the saturation of intensive care units. The relationship between hospitalization and severity could also be interpreted as a decrease in less severe hospitalizations in order to be able to manage more severe cases when the healthcare system is overloaded, which would result in an increase in lethality. Nevertheless, in both cases, there is no correlation between the severity rate and the case-fatality rate (r = -0.10), indicating that globally, the differences in use of resuscitative measures or endotracheal intubation does not impact the case-fatality rate. Finally, the severity rate does not have a spatial distribution corresponding to the spatial distribution of the hospitalization rate (Fig 13).
Discussion
The standardized case-fatality rates at district level in France (0.04 for Tarn-et-Garonne to 0.26 for the Vosges district) remain in a ratio of 0.3 to 1.6 compared with the national average (mean 0.14, calculated by excluding districts under hospital stress in order not to take account of possible overloading of the healthcare systems). The relationships between standardized morbidity rates and standardized case-fatality rates in France show a correlation between these two indices, with an increase of SLR with hospitalization rate as shown inTable 5. It is
Fig 11. SLR (symbols) and hospitalization rate (left) and fatality rate (right) during the COVID-19 epidemic in France for the period of time between March 19 to May
8, 2020.
therefore very likely that high medical admission rates and healthcare workers stress over the period under consideration has increased the hospital case-fatality rate: for the 20 districts with the highest hospitalization rates (essentially located in the Grand-Est and Ile-de-France regions), the average case-fatality rate is 20% higher than the average for all districts, and 25% higher than the average for all other districts alone. It is therefore likely that pressure on hospi-tals have increased the national average case-fatality rate by district from 0.145 to 0.153. It can thus be estimated that 2,425 deaths (out of the 16,732 deaths due to COVID-19 in hospital in France from 19 March to 8 May 2020, i.e. 15% of the total number of deaths) are due to the overload of the health system in the Grand-Est and Ile-de-France regions.
As we see, after standardization on age, lethality health risk factors (i.e. co-morbidities) do not show, at the district level, any significant correlation with differences in hospital lethality rates. With regard to behavioral risk factors associated to hospital lethality (e.g. late recourse to hospital care), studies focusing on mortality (i.e. not lethality) show significant differences in excess mortality according to the geographical origin of birth of the deceased [16,17]. The authors of these studies attribute these differences in mortality to differences in the spatial dis-tribution (the foreign-born population is more present in densely populated urban areas, like Ile-de-France region), and not to a risk factors for lethality which could be specific to this population.
There are clearly two risk profiles:
1. the districts where a high rate of hospitalization is coupled with a high case-fatality rate. These districts correspond to the epicenters of the epidemic, are clustered, and include the densely populated areas of Ile-de-France.
Fig 12. Combination of standardized hospitalization (H) and case-fatality (L) rates in five classes.
2. the districts where a low rate of hospitalization is coupled with a high case-fatality rate. These districts are geographically dispersed, sparsely populated and mainly located in rural areas.
The first profile accounts for 60% of the patients (59,878 over 99,970). The case-fatality average for this profile is significantly higher (0.187) as compared with the other districts case-fatality average (0.138). The profile displays a 33% excess mortality, corresponding to 2,716 deaths (11,003 observed vs. 8,287 expected with the CFR 0.138). This excess mortality, corre-sponding to 16% of all deaths, is likely to be the result of increased lethality due to overloading of the healthcare system.
The second profile (more rural) accounts for only 12.5% of the patients (12,514 over 99,970), with an average case-fatality rate significantly high (0.178) corresponding to a 25% excess mortality (2,170 observed vs. 1,731 expected deaths), but of low magnitude. It is possible that this excess mortality is due to a lack of care (medical desert, poor hospital response), which would have led to an increase in hospital lethality.
Some districts in the south of France have both a very low rate of hospitalization and a very low case-fatality rate (Gironde, Dordogne, Gers, Pyre´ne´es Orientales), as a result of a low cir-culation of the virus and an effective response of the health system. Another particular case, is the one of the Bouches-du-Rhoˆne, which appears with a high hospitalization rate (1.96 per 1,000, for a national average of 1.27) and a low case-fatality rate (0.11 for the Bouches-du-Rhoˆne for a national average per district of 0.15). This situation could be due to a medical pol-icy of more active screening and earlier hospitalization of the infected in the district,
Fig 13. Severity ratio during the COVID-19 epidemic in France for the period of time between March 19 to May 8, 2020.
particularly in Marseille metropolitan area. The high value of the hospitalization rate would then be more the result of a non-severe treatment of the infected than of a more active circula-tion of the virus in the region, as for the lower hospitalizacircula-tion rates in neighboring districts (0.9 for Var, 0.56 for Vaucluse, 0.52 for Gars, 0.86 for Alpes-de-Haute-Provence, 0.81 for Alpes-Maritimes, 0.68 for He´rault). However, patient severity profile (expressed as the ratio between the number of patients admitted to intensive care and the total number of patients hospitalized) is not particularly low in the Bouches-Du-Rhoˆne (0.163 for a mean of 0.156 and a standard deviation of 0.06 for all the districts), and this hospitalization policy is therefore not proven to be the primary factor in the low observed case-fatality rate.
Time analysis shows that the case-fatality rate has decreased over time, globally and in almost all districts, showing an improvement in the management of severe patients during the epidemic. This decrease stabilized rapidly and no longer evolved, in a steady manner. However, this result is limited by the difficulty of calculating a case-fatality rate on aggregated data over a short period of time, with eventual death occurring several days after hospitalization. We chose to delay the calculation of the number of deaths by 12 days compared to the calculation of the number of hospitalizations, since 85% of deaths occur on an average of 13 days after hospitalization [9].
WHO data from 219 countries show a mean case-fatality rate of 0.041 (median 0.029, stan-dard deviation 0.045) with values between 0.31 (Nicaragua) and 0.00 (for countries that did not report deaths until May 8, like Vietnam). Even if we consider only the average case-fatality rate calculated only for the French districts with the lowest hospitalization rates (thus not caus-ing possible saturation of the healthcare system), the French CFR average is very significantly higher than the World average (and the rates of most European countries, such as Spain, 11.73, Greece, 5.52, Germany, 4.28, etc.) (Table 1). The internal variability within France appears too low to explain the large differences in case-fatality rate between countries. These differences cannot be either explained by dissimilarities in morbidity between countries, in lethality risk factors between countries, or inpatient treatment, taking into account the quality of the healthcare system in France (Table 1). One can concluded that the difference between the case-fatality rate calculated with France datasets and the case-fatality rates presented using international WHO data is highly probably the result of a disparity in the registration of cases and/or deaths and not due to the quality of healthcare system or treatment. These differences in the counting of cases and/or deaths may be due to the hospitalization and screening policy specific to each country as well as the ability or willingness to hospitalize more non-severe forms, to the differences in case definition, or to insufficient quality of the health system for detecting and reporting cases and deaths. Such finding is reinforced by studies on excess mor-tality (difference to the average mormor-tality of previous years over the same period) showing that in most countries, excess mortality is not fully explained by deaths officially attributed to COVID-19, while France datasets present a slight excess of COVID-19 reported deaths [18].
Conclusion
This study shows that the higher case-fatality rates observed in France in some districts during the first wave of the COVID-19 epidemic (data from 19 March to 8 May 2020) are mostly linked to the level of morbidity in the district, and therefore likely to the congestion of the healthcare systems during the acute phases of the epidemic. When the hospitalization rate is low, high case-fatality rates concern rural districts with low population density and could be linked to healthcare access in these districts.
However, the increase in the standardized case-fatality rate due to exceptional situations during epidemic peaks represents less than 10% of the average case-fatality rate per district in France, and the hospital case-fatality rate without these districts would be reduced from 0.151
to 0.138. This increase cannot therefore explain the extent of the difference observed between the average case-fatality rate in France and the average of the rates reported for all countries by international organizations or information sites (WHO, Wordometer, etc.). These differences probably stem from the reporting of cases and deaths, which is uneven from one country to another, and not from the care or treatment of patients during hospital stress due to epidemic peaks.
Author Contributions
Conceptualization: Marc Souris. Data curation: Marc Souris. Formal analysis: Marc Souris.
Investigation: Marc Souris, Jean-Paul Gonzalez. Methodology: Marc Souris.
Project administration: Marc Souris, Jean-Paul Gonzalez. Software: Marc Souris.
Validation: Marc Souris, Jean-Paul Gonzalez. Visualization: Marc Souris.
Writing – original draft: Marc Souris.
Writing – review & editing: Jean-Paul Gonzalez.
References
1. Morteza AK, Fakher R. Cross-Country Comparison of Case Fatality Rates of COVID-19/SARS-COV-2. Osong Public Health and Research Perspectives 2020; 11(2): 74–80.
2. Rinaldia G, Paradisiba M. An empirical estimate of the infection fatality rate of COVID-19 from the first Italian outbreak. Harvard Economics Department.
3. Spychalski P, Blazynska-Spychalska A, Kobiela J. Estimating case fatality rates of COVID-19. The Lan-cet,https://doi.org/10.1016/S1473-3099(20)30246-2PMID:32243815
4. Baud D, Qi X, Nielsen-Saines K, Musso D, Pomar L, Favre G. Real estimates of mortality following COVID-19 infection. Lancet Infect Dis. 2020 (published online March 12).https://doi.org/10.1016/ S1473-3099(20)30195-XPMID:32171390
5. Porta M. A dictionary of Epidemiology. 5th Ed. Oxford University Press, Oxford, 2008.
6. Collier L, Oxford J. Human Virology. Oxford University Press, 2016.
7. Saluzzo JF, Vidal P, Gonzalez JP. Les virus e´mergents. IRD Edition, 2004.
8. Hurraux JM, Nicolas JC, Agut H, Peigne-Lafeuille H. Traite´ de virologie humaine. Estem/AUF, 2003.
9. Salie H, Tran-Kiem C, Lefrancq N, Courtejoie N, Bosetti P, et all. Estimating the burden of SARS-CoV-2 in France. 2020. Science 13 May 2020.https://doi.org/10.1126/science.abc3517PMID:32404476 10. Bouyer J, He´mon D, Cordier S, Derriennic F, Stuˆcker I, Stengel B, et al. Epide´ miologie, principes et
me´thodes quantitatives. Inserm, 1993.
11. Breslow NE and Day NE, Statistical methods in cancer research, vol. I & II. WHO, International Agency for Reseach on Cancer, 1987.
12. Samuels SJ, Beaumont JJ, Breslow NE (1991). Power and detectable risk of seven tests for SMR. Am J Epidemiology 1991; 133:1191–1197.
13. Miller RG. Simultaneous Statistical Inference. Springer Verlag, 1996.
14. Souris M. Epidemiology and Geography. Principles, methods and tools of spatial analysis. Wiley-ISTE, London, 2019
15. Pfeiffer D, Robinson T, Stevenson M, Stevens K, Rogers D, Clements A. Spatial Analysis in Epidemiol-ogy. Oxford University Press, 2008.
16. Allard T, Bayardin V, Mosny E. L’Iˆle-de-France, re´gion la plus touche´ e par le surcroıˆt de mortalite´ pen-dant le confinement. Insee Analyses Iˆle-de-France n˚ 118, juin 2020.
17. Papon S, Robert-Bobe´e I. Une hausse des de´cès deux fois plus forte pour les personnes ne´esà l’e´tran-ger que pour celles ne´es en France en mars-avril 2020. Insee Focus No 198—juillet 2020
18. Le Temps. L’impact du Covid-19 sous-estime´ dans de nombreux pays. Available online:https://labs. letemps.ch/interactive/2020/surmortalite-et-covid-19/