Current Biology, Volume28
Supplemental Information
Architecture of Lipid Droplets
in Endoplasmic Reticulum Is Determined
by Phospholipid Intrinsic Curvature
Vineet Choudhary, Gonen Golani, Amit S. Joshi, Stéphanie Cottier, Roger Schneiter, William A. Prinz, and Michael M. Kozlov
Figure S1. Qualitative essence of the model of elastic membrane tubule used to obtain the
results presented in Figures 1, 2.
(A) Lipid Droplet inserted into a tubular membrane disrupts the membrane integrity and enables
partial relaxation of the elastic stresses accumulated in the membrane monolayers through
repositioning of the LD-membrane contact line along the LD surface. Insert: transition region
between the membrane and the LD. (B) Two concave monolayer fragments of negative
spontaneous curvature. (C) Coupling of two intrinsically curved monolayers fragments
illustrated in (Figure 1B) results in formation of a flat bilayer fragment whose two leaflets are
elastically frustrated. (D) Acquiring by the bilayer fragment (Figure 1C) of a saddle-like shape
enables a partial relaxation of the elastic energy accumulated in the leaflets.
!" !# Contact line B A C D
Figure S2. Model of the transition region used to obtain the results presented in Figures 1,
2.
(A) Geometry of the transition region. (B) Derjaguin approximation for computation of VdW
interaction between monolayers. Each monolayer element in the transition region is
approximated to be flat and oriented horizontally. The distance between opposing monolayer
elements is 𝑙
#$%&'()+ 2𝑅(1 − 𝑐𝑜𝑠 𝜃 ), where 𝑙
#$%&'()is the width of the bilayer and 𝑅 is the
curvature radius of the transition region.
! !
!
A
AXIS " # = 5 = "%&"'()* " # = "%&"'()*+ ,-(/ − 123 # )
-(/ − 123 # ) 6 --123(#) -(/ − 123 # ) -3&7(#) B
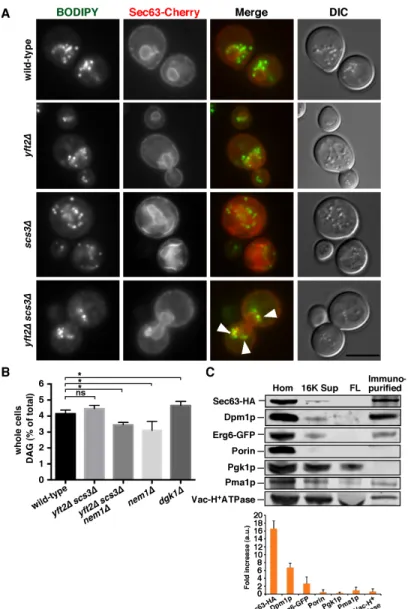
Figure S3. Controls for experiments shown in
Figure
3B-D.(A) Cells with the indicated genotypes contained a plasmid encoding the ER-marker Sec63-GFP and were stained with the LD-maker BODIPY. Cells were visualized by fluorescence microscopy or differential interference contrast microscopy (DIC). Arrows indicate regions where the ER is closely associated with LD in cells lacking FIT2 proteins (
yft2
D scs3D)
). Bar = 5µM. Arrows indicate LDs surrounded by the ER.(B) DAG concentration of whole cell extracts of the indicated strains, mean + SD of 3 independent experiments, difference relative to wt *, p<0.05, ns = not significantly different, relative to wt by one-way ANOVA with Tukey's multiple comparison.
(C) Representative immunoblots used to assess the purity of the immuno-purified ER-derived
membranes used for
Figure
3D; Hom, homogenate; 16K Sup, supernatant from 16,000xg centrifugation; FL, flow through after incubating 16K Sup with anti-HA resin; immuno-purified, eluted from anti-HA resin (markers: ER, Sec63-HA and Dpm1p; LD, Erg6-GFP; mitochondria, Porin; cytoplasm, Pgk1p; plasma membrane, Pma1p; vacuole, Vac-H+ATPase). Bottom panel is the mean + SD of the relative enrichment of proteins in the immuno-purified fraction (a.u. arbitrary units) of three independent experiments.Figure S4. Neutral lipid levels of strains used in
Figure
3.(A) LDs per cell of the indicated strains growing in mid-logarithmic growth phase in YPD (mean + SD, 3 independent experiments).
(B) Relative amount of neutral lipids (TAG and SE) in the indicated strains growing in mid-logarithmic growth phase in YPD,* p<0.05, by one-way ANOVA with Tukey's multiple comparison (mean + SD of 3 independent experiments).
Figure S5. Exogenous lyso-PC does not affect growth rate of cells used in
Figure
4E,F.3D GAL1-LRO1 yft2D scs3D cells were grown in SC raffinose to stationary growth phase and then (time = 0) diluted into fresh SC raffinose (left panel) or SC galactose supplemented with 300 µM lyso-PC
Figure S6. Yft2p and Scs3p levels increase after oleic acid addition to the culture medium. Related to Figure 5.
(A) The strains used for
Figure
6C,D were immuoblotted with antibodies against GFP, to detect the tagged FIT2 proteins or the loading control Pgk1p.(B) Quantification of the relative expression of the FIT2 proteins shown in (A) normalized to Pgk1p. a.u. = arbitrary units. These results are related to those shown in
Figure
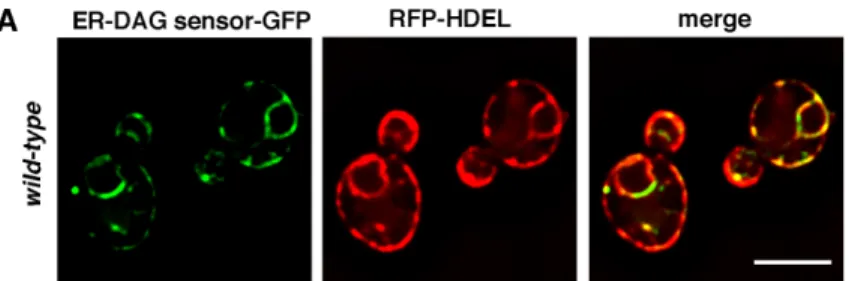
5C,D.Figure S7. The ER-DAG is enriched at LD biogenesis sites. Related to Figure 7.
(A) Wild-type cells expressing the ER-DAG sensor and the ER marker RFP-HDEL were visualized live. Stacks of 3 images with a step size of 0.3µm were taken and deconvolved; images from a single plane are shown. (B) Strains expressing a version of the ER-DAG sensor with a point mutation (P155G) that ablates DAG binding were grown in a medium with oleic acid for 1 hour and visualized as in panel A. (C) Cell expressing the ER-DAG sensor and Yft2-sfGFP were visualized live before (0 hours) or 1.5 hours after oleic acid addition to the medium. Arrows indicate sites where the ER-DAG sensor and Yft2-GFP are enriched. (D) Quantification of experiment shown in panel C, n = 50 cells from 3 independent experiments. In panels A-C, bars = 5µm. These results are controls for the results shown in