Are more interactions at
intersections related to
more collisions for
pedestrians? An empirical
example in Quebec,
Canada
Marie-Soleil Cloutier
*, Ugo Lachapelle
†, Andrew
Howard
‡Feb 16, 2019
TTags:ags: vulnerable road users, pedestrian collisions, traffic interactions, traffic conflicts, road safety, observational study
Institution:
Institution: Institut national de la recherche scientifique Department:Department: Urbanisation Culture Société OR
ORCID iD:CID iD: 0000-0002-8533-4784 Institution:
Institution: Université du Québec à Montréal Department:Department: Département d’études urbaines et touristiques Institution:
Institution: Hospital for Sick Children Department:Department: Child Health Evaluative Science *
† ‡
Abstract
Abstract
This paper examines the relationship between reported collisions involving pedestrians and interaction rates based on field observation of street crossing behavior at selected urban intersections in Quebec, Canada (n=60). Data from a naturalistic observational study of pedestrian street crossing behavior was used to calculate interaction rates (n= 4286 observations) per intersection. Collisions (2003-2012, n=358 pedestrian collisions) were mapped and pooled at the same intersections to evaluate the relationship between the two. We found a positive and significant correlation between collisions (all-years) and interaction rates (Spearman’s coefficient between 0.329 and 0.340). This seems to be particularly the case on larger arterial roads.
RESEARCH QUESTIONS AND HYPOTHESIS
RESEARCH QUESTIONS AND HYPOTHESIS
A traffic conflict was first described as an event where "two or more road users approach each other in space and time to such an extent that a collision is imminent if their movement remains unchanged" (El-Basyouny and Sayed 2013). This definition has been extended throughout the years to include less critical conflicts—situations where road users adapt their behavior ahead of the "conflicting zone," leaving time and space for fluid movement while both road users are on the street, for example. Those common conflicts, including those between pedestrians and vehicles, are referred to as "interactions." Accordingly, conflicts and interactions have been used as surrogate measures of road safety, meaning that they are considered an alternative metric to the use of crash data. This broader definition of conflicts is used in this article.
The claimed relationship between surrogate measures of traffic safety such as conflicts, interactions, and collisions is based on two hypotheses:
1. All collision severities are part of a road safety continuum because they have the same causal patterns. Where road environments lead to more interactions, they might also lead to more conflicts, more injuries, and more deaths at some point (Davis et al. 2011; Gharieh et al. 2014; Guo et al. 2010).
2. There is a relationship between conflicts and collisions, the first being a predictor of the second in statistical models (El-Basyouny and Sayed 2013; Sacchi and Sayed 2016).
While there are published accounts of conflicts between motorists, traffic conflict literature rarely focuses on conflicts involving motorists and pedestrians (Ismail et al. 2009; Kaparias et al. 2015). Pedestrian–vehicle interactions may be meaningful as a surrogate measure of pedestrian safety, even though pedestrian behavior is more complex than motorist behavior (Tageldin and Sayed 2016). However, there is no empirical evidence of the relationship between pedestrian–vehicle interactions and collisions. This article seeks to fill this gap by describing the relationships between pedestrian interaction rates based on field
observation at selected urban intersections (n = 60) and reported collisions involving pedestrians (within a 10-year prior period). Our hypothesis is that a higher percentage of observed crossings with an interaction is related to a higher number of collisions for the same intersection.
METHODS AND DATA
METHODS AND DATA
Two sources of data are used for this project. First, interactions were retrieved from an observational study of street-crossing behavior (n = 4,286 observations) (for more details on the method, see (Cloutier et al. 2017; Lachapelle and Cloutier 2017). Data collection was undertaken between May and October 2013 in four different cities in the province of Quebec, Canada: Montreal, Laval, Longueuil, and Sainte-Julie. Observation sites were selected to represent a variety of street-crossing situations at intersections. Interactions were recorded when the pedestrian's and driver's paths crossed while the pedestrian was still on the pavement. We combined the total number of pedestrian observations (recorded per crossings) per intersection; we only kept intersections with more than 25 observations (n = 60 from 101 intersections total) and we calculated an interaction rate for each (number of observed interactions/total number of observed pedestrians × 100). Using rates instead of counts takes into account the short and various duration of our observation period (only a few hours per day) and the changing total number of observations from one intersection to the other. Two intersection types were created: intersections where at least one of the street segments was an arterial/major street (n = 39/60) and local-street-only intersections.
Second, pedestrian collisions were obtained from the Automobile Insurance Board of Quebec (Société d'assurance automobile du Québec) and mapped by the Montreal Public Health Directorate. The collision database covers a 10-year period before our street-crossing observation data collection (2003–2012). All pedestrian collisions within a 30-m radius from the center of the intersection were retained. Since no denominators were available, total, mean, and median number of pedestrian collisions per intersection were compiled for the 10-year period and the two 5-year periods within. Five-year periods were used to evaluate
whether relationships changed based on a known downward trend in collisions in time, yielding to possible stronger correlations. Since observations were only recorded for six months of the year, we consider the distribution of collisions per month for both the "warmer" months (May to October, our data collection period) and the "colder" ones (November to April; see Figure 1). Because the correlation coefficient between collisions during warmer months and collisions all year long was quite strong and significant (Spearman's rank coefficient = 0.86; p < 0.000), we decided to keep all collisions in our analyses. Observations of collisions and interaction rates were correlated using Spearman's rank coefficient. It was chosen as a relevant test because collision counts are not normally distributed. It is also less influenced by outliers and better suited to small datasets (Laerd Statistics 2017).
Figure 1: P
Figure 1: Pedestrian Collision Fedestrian Collision Frequencies per Month (2003–2012)requencies per Month (2003–2012)
FINDINGS
FINDINGS
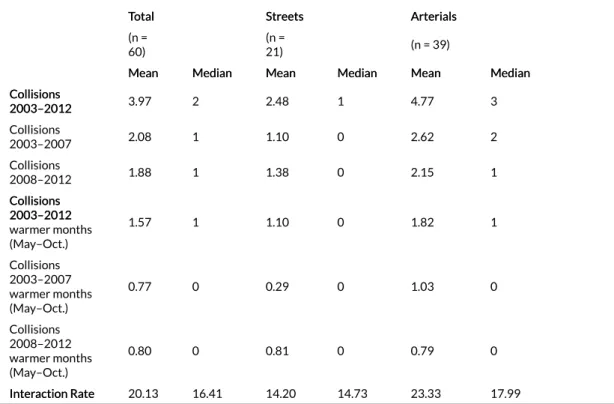
Table 1 presents the mean and median pedestrian collision counts and the interaction rates for each period. The highest collision mean (and median) can be found for the 10-year period at 3.97 collisions per intersection. Each 5-year period had similar mean and median collision counts. Over the 10-year period, the mean number of collisions is twofold when there is an arterial road at the intersection (mean = 4.77) compared to local streets only (mean = 2.48). The percentage of observed crossings with an interaction was also higher when there was an arterial road at the intersection (23.33% compared to 14.20%).
TTable 1: Mean and Median Number of Pable 1: Mean and Median Number of Pedestrian Collisions and Interedestrian Collisions and Interaction Rate per Intersection (n = 60)action Rate per Intersection (n = 60)
TTotalotal StreetsStreets ArterialsArterials (n =
60) (n =21) (n = 39) Mean
Mean MedianMedian MeanMean MedianMedian MeanMean MedianMedian Collisions Collisions 2003–2012 2003–2012 3.97 2 2.48 1 4.77 3 Collisions 2003–2007 2.08 1 1.10 0 2.62 2 Collisions 2008–2012 1.88 1 1.38 0 2.15 1 Collisions Collisions 2003–2012 2003–2012 warmer months (May–Oct.) 1.57 1 1.10 0 1.82 1 Collisions 2003–2007 warmer months (May–Oct.) 0.77 0 0.29 0 1.03 0 Collisions 2008–2012 warmer months (May–Oct.) 0.80 0 0.81 0 0.79 0 Inter
Interaction Rateaction Rate 20.13 16.41 14.20 14.73 23.33 17.99
Table 2 presents the Spearman's correlation coefficients between pedestrian collision counts in different time periods and interactions observed per intersection. Spearman's correlations between interaction rate and collision counts were lower but still significant, including for the different collision time periods. For all intersections, coefficients range from 0.329 (p-value = .01) to 0.340 (p-value = .008), and for intersections with an arterial road, coefficients range from 0.329 (p-value = .041) to 0.331 (p-value = .039). Intersections with local streets only did not have a significant correlation between collisions and interaction rate, possibly due to the small number of intersections in this category (n = 21).
TTable 2: Spearmanable 2: Spearman’s Correlation Coefficients Between Collision Counts and Inter’s Correlation Coefficients Between Collision Counts and Interaction Rate peraction Rate per Intersection (n = 60) Intersection (n = 60) Inter Interactionaction Rate
Rate CollisionsCollisions2003–20122003–2012 CollisionsCollisions2003–20072003–2007 CollisionsCollisions2008–20122008–2012 TTotal Number of Intersections (n = 60)otal Number of Intersections (n = 60)
Inter
Interaction Rateaction Rate 1 Collisions 2003–2012 0.337**0.337** 1 Collisions 2003–2007 0.340**0.340** 0.928***0.928*** 1 Collisions 2008–2012 0.329**0.329** 0.922***0.922*** 0.746***0.746*** 1 Intersections with LIntersections with Local Streets Only (n = 21)ocal Streets Only (n = 21)
Inter
Interaction Rateaction Rate 1 Collisions 2003–2012 0.309 1 Collisions 2003–2007 0.348 0.809***0.809*** 1 Collisions 2008–2012 0.277 0.885***0.885*** 0.555**0.555** 1 Intersection with Arterials (n = 39)
Intersection with Arterials (n = 39) Inter
Interaction Rateaction Rate 1 Collisions 2003–2012 0.3320.332** 1 Collisions 2003–2007 0.294 0.950***0.950*** 1 Collisions 2008–2012 0.329*0.329* 0.907***0.907*** 0.751***0.751*** 1 *p ≤ .05. ** p ≤ .01. ***p ≤ .001.
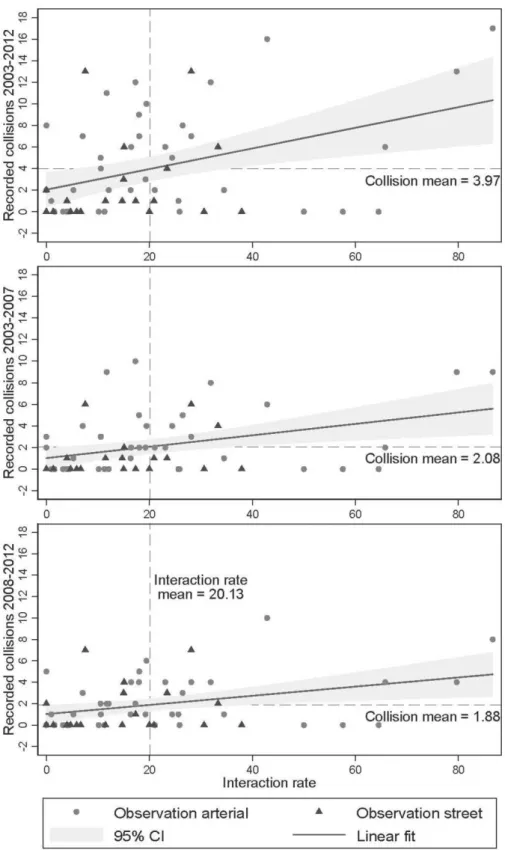
We can see in Figure 2 (one graph per collision period) that the relation between collision counts (y-axis) and interaction rate (x-axis) is weakly positive but not linear. There are outliers in each of the quadrants implying that other variables beyond interactions will be important in predicting collision counts accurately. Using either a 5- or 10-year collisions period did not significantly change the results.
Our analysis shows that interactions as measured by observations at street intersections are correlated to actual pedestrian collisions, but correlation coefficients were modest. This means that further development of conflict or interaction measures could potentially provide early information on the safety performance of intersection modifications without having actual pedestrians injured.
Figure 2: Scatter Plot of P
Figure 2: Scatter Plot of Pedestrian Collision Counts and Interedestrian Collision Counts and Interaction Rates peraction Rates per Intersection and per Time P
Intersection and per Time Perioderiod
ACKNOWLEDGMENTS
ACKNOWLEDGMENTS
Research Board Meeting. This project was supported by two grants from the Actions concertées Research Program, jointly funded by Transports Québec, the Société de l'assurance automobile du Québec, and by the Fonds de recherche du Québec (FRQ-Société et culture, Nature et technologie et Santé). The views expressed here are those of the authors and do not necessarily represent those of the sponsoring agencies. We would like to thank both the PARI (INRS-UCS) and the ESSAIM (U. Montréal) team for taking part in the development of the observation tools and we are grateful to all the students involved in the data collection.
References
Cloutier, Marie-Soleil, Ugo Lachapelle, Andrée-Anne d’Amours-Ouellet, Jacques Bergeron, Sébastien Lord, and Juan Torres. 2017. “‘Outta My Way!’ Individual and Environmental Correlates of Interactions between Pedestrians and Vehicles during Street Crossings.”Accident Analysis & Prevention 104 (July): 36–45.
https://doi.org/10.1016/j.aap.2017.04.015.
Davis, Gary A., John Hourdos, Hui Xiong, and Indrajit
Chatterjee. 2011. “Outline for a Causal Model of Traffic Conflicts and Crashes.”Accident Analysis & Prevention 43 (6): 1907–19.
https://doi.org/10.1016/j.aap.2011.05.001.
El-Basyouny, Karim, and Tarek Sayed. 2013. “Safety Performance Functions Using Traffic Conflicts.”Safety Science 51 (1): 160–64.
https://doi.org/10.1016/j.ssci.2012.04.015.
Gharieh, K., F. Farzan, M. Jafari, and T. Gang. 2014.
“Probabilistic Pedestrian Safety Modeling in Intersections Using Surrogate Safety Measure.” InThe Intelligent Transportation System 21st World Congress. Detroit, MI, United States. Guo, F., S.G. Klauer, M.T. McGill, and T.A. Dingus. 2010. “Evaluating the Relationship between Near-Crashes and Crashes: Can near-Crashes Serve as a Surrogate Safety Metric for
Crashes?”Transportation Research Board.https://trid.trb.org/
view/1353218.
Ismail, Karim, Tarek Sayed, Nicolas Saunier, and Clark Lim. 2009. “Automated Analysis of Pedestrian–Vehicle Conflicts Using Video Data.”Transportation Research Record: Journal of the Transportation Research Board 2140 (1): 44–54.https://doi.org/ 10.3141/2140-05.
Kaparias, I., M.G.H. Bell, T. Biagioli, L. Bellezza, and B. Mount. 2015. “Behavioural Analysis of Interactions between Pedestrians and Vehicles in Street Designs with Elements of Shared Space.” Transportation Research Part F: Traffic Psychology and Behaviour 30 (April): 115–27.https://doi.org/10.1016/ j.trf.2015.02.009.
Complexity of Finishing a Crossing on Time: Elderly Pedestrians, Timing and Cycling Infrastructure.”Transportation Research Part A: Policy and Practice 96 (February): 54–63.https://doi.org/ 10.1016/j.tra.2016.12.005.
Laerd Statistics. 2017. SPSS Statistics Guide.
Sacchi, E., and T. Sayed. 2016. “Conflict-Based Safety Performance Functions for Predicting Traffic Collisions by Type.”Transportation Research Record 2583: 50–55.
Tageldin, Ahmed, and Tarek Sayed. 2016. “Developing Evasive Action-Based Indicators for Identifying Pedestrian Conflicts in Less Organized Traffic Environments.”Journal of Advanced Transportation 50 (6): 1193–1208.https://doi.org/10.1002/ atr.1397.