REFRACTIVE SURGERY
Longitudinal change of refraction over at least 5 years
in 15,000 patients
David Goldblum&Annette Brugger&
Andreas Haselhoff&Stefanie Schmickler
Received: 21 September 2012 / Revised: 7 November 2012 / Accepted: 9 November 2012 / Published online: 28 November 2012 # Springer-Verlag Berlin Heidelberg 2012
Abstract
Background To report the natural, longitudinal history of shifts in refractive errors in different age groups in a large western European cohort over at least 5 years in the same patients. Methods The electronic database of a large regional clinic containing 225,000 patients was searched for records of patients with a follow-up of at least 5 years, excluding all patients who had received any surgical interventions in any eye. This search retrieved 15,799 patients aged 3 months to 79 years (median 37.8 years) with refractive follow up of at least 5 years (mean 8.8 years) and no surgical interventions. Differences in spherical equivalents (sum of sphere +1/2 cylinder) and cylinder between first and last visit in the same patients in only the right eye were calculated, and used as the measure of refractive shift. Subsequently differences in change between the right and left eye were also determined. Results Refractions were found to be mostly stable from 25 to 39 years (n03,155 right eyes), with 50 % of these patients
not changing their refraction. In patients aged 20–24 (n0825
right eyes), only 39 % of the refractions remained stable, whereas 49 % experienced a myopic shift. In the age group 40–69 years (n06,694), 40–45 % remained stable, with an increase in hyper-opic shifts. Eighty-five percent of all patients had bilateral sym-metric shifts, and 61 % showed stable cylindrical values. Conclusions This report documents clinical relevant changes in spherical equivalents in all age groups within 5 to 10 years in the largest examined European cohort. Re-fractive surgery patients in particular should be selected
accordingly, and be informed about the physiological changes which might still occur during their lifetime. Keywords Refraction . Progression . Myopia . Refractive surgery . Ocular development
Introduction
Decrease of visual acuity due to alteration in refractive error is a common reason to visit an ophthalmologist. Many patients or parents will ask for the likelihood of further change of their or their children’s refraction over the next few years. This question becomes indeed relevant in patients undergoing re-fractive surgery, as the most important factors for satisfaction after treatment are the immediate residual refractive error and its stability over time. Only limited data is available to answer this question longitudinally. The existing data focused on only relatively small samples, restricted age groups, and was sel-dom longitudinal. A few larger studies evaluated the preva-lences at one time point in different age groups, but rarely the refractive changes over a few years longitudinally and even more seldom separated for different age groups.
In this report, we aimed to give an extensive overview in a large cohort of patients for a follow-up of a minimum of 5 years over all age groups, and to calculate the probability of changing one's individual refraction from the initial refrac-tion in different age groups from childhood to senescence.
Patients and methods
The electronic database of a large German regional private clinic providing basic optometric care as well as refractive and ophthalmic surgical services was used for this study. D. Goldblum (*)
:
A. BruggerDepartment of Ophthalmology, University Hospital Basel, University Basel, 4031 Basel, Switzerland
e-mail: [email protected] A. Haselhoff
:
S. SchmicklerAugenärzte Gemeinschaftspraxis Ahaus–Gronau–Lingen, 48683 Ahaus, Germany
The complete database contained 225,000 individual patients in September 2008. All patients aged 3 months to 79 years, with at least two consecutive bilateral refractions after at least 5 years, without any surgical intervention in any eye in these 5 years (or until the time of last refraction) were included. This search retrieved 15,820 patients. After a manual control, 21 patients were excluded for obvious false data (e.g., alphabetical entries instead of numerical), result-ing in 15,799 eligible patients for final analysis.
The patients were clustered according to their age at their first visit into the age groups 0 to 9 (n02,701), 10 to 19 (n01,714), 20 to 24 (n0825), 25 to 29 (n0983), 30 to 34 (n01,077), 35 to 39 (n01,095), 40 to 49 (n02,619), 50 to 59 (n02,402), 60 to 69 (n01,673) and 70 to 79 (n0710) years of age. In each age cluster, the initial refraction (spherical
equivalent) was again grouped into less than −6 diopters
(D),−4 to −5.9 D, −2 to −3.9 D, −1.5 to −1.9 D, −1 to −1.4
D,−0.5 to −0.9 D, emmetropic [defined as spherical
equiv-alent from−0.4 ≥ to ≤ +0.4 diopters (D)], +0.5 to +0.9 D, +1
to +1.4 D, +1.5 to +1.9 D, +2 to +3.9 D, +4 to +5.9 D, and over +6 D. Differences in spherical equivalents (sum of sphere+½ cylinder) and cylinder values between first and last visit (minimum 5 years apart) in the same patients in only the right eye were then calculated, and used as the measure of refractive shift. Secondly, the difference in change of refrac-tive development between the right and left eye in the same patient was also determined. All children up to 14 years received cycloplegic refractions (0.5 % tropicamide or atro-pine 0.5 % if <4y; and cyclopentolat 1 % if >4y).
After that age, all refractions were determined using a standard auto-refractometer (Topcon KR 8100, Tokyo, Ja-pan) without any cycloplegia or dilatation prior to the exam. The retrospective study was approved by the local and cantonal ethical board.
Results
The overall median age in all 15,799 patients (6,520 men) was 37.8 years, and the mean overall follow-up was 8.8 (± 2.4) years. Over all age groups, 492 patients (3.1 %) had an initial refraction in their right eyes (spherical equivalent) of less than −6 diopters (D), 513 persons (3.2 %) ranged from less than −4
to−5.9 D, 1,114 (7.1 %) from −2 to −3.9 D, 471 (3 %) from
−1.5 to −1.9 D, 789 (5 %) from −1 to −1.4 D, 1,308 (8.3 %)
from−0.5 to −0.9 D; 2,771 (17.5 %) were roughly emmetropic
(−0.4 to 0.4 D), 2,012 individuals (12.7 %) were measured as
+0.5 to +0.9 D, 1,673 (10.6 %) as +1 to +1.4 D, 1,230 (7.8 %) as +1.5 to +1.9 D, 965 (6.1 %) as +2 to +3.9 D, 1,749 (11.1 %)
as +4 to +5.9 D, and 712 (4.5 %) as over +6 D. Table1shows
the detailed number of patients in each age group for each
initial refraction and the relative distribution (%) in this age Table
1 Summarizes the number of analysed patients and the respective percentages regarding their initial refractive error (spherical equivalent in diopt ers) in each age group SE (D) < − 6 − 4 − 2 − 1.5 − 1 − 0.5 0 0.5 1 1.5 2 4 >6 Sum n (%) Age (years) 0– 9 18 (0.7) 15 (0.6) 45 (1.7) 25 (0.9) 40 (1.5) 73 (2.7) 122 (4.5) 189 (7.0) 423 (15.7) 453 (16.8) 369 (13.7) 628 (23.3) 301 (1 1.1) 2701 (100) 10 –19 59 (3.4) 73 (4.3) 159 (9.3) 87 (5.1) 121 (7.1) 182 (10.6) 282 (16.5) 164 (9.6) 162 (9.5) 78 (4.6) 55 (3.2) 186 (10.9) 106 (6.2) 1714 (100) 20 –24 42 (5.1) 49 (5.9) 100 (12.1) 33 (4.0) 74 (9.0) 120 (14.5) 207 (25.1) 71 (8.6) 34 (4.1) 18 (2.2.) 18 (2.2) 43 (5.2) 16 (1.9) 825 (100) 25 –29 62 (6.3) 59 (6.0) 131 (13.3) 53 (5.4) 90 (9.2) 142 (14.4) 218 (22.2) 85 (8.6) 28 (2.8) 18 (1.8) 15 (1.5) 55 (5.6) 27 (2.7) 983 (100) 30 –34 74 (6.9) 60 (5.6) 147 (13.6) 55 (5.1) 81 (7.5) 120 (1 1.1) 255 (23.7) 99 (9.2) 54 (5.0) 27 (2.5) 21 (1.9) 51 (4.7) 33 (3.1) 1077 (100) 35 –39 54 (4.9) 65 (5.9) 11 3 (10.3) 46 (4.2) 69 (6.3) 120 (1 1.0) 274 (25.0) 137 (12.5) 73 (6.7) 38 (3.5) 29 (2.6) 53 (4.8) 24 (2.2) 1095 (100) 40 –49 99 (3.8) 103 (3.9) 202 (7.7) 76 (2.9) 135 (5.2) 233 (8.9) 732 (27.9) 514 (19.6) 200 (7.6) 99 (3.8) 48 (1.8) 11 6 (4.4) 62 (2.4) 2619 (100) 50 –59 50 (2.1) 55 (2.3) 126 (5.2) 57 (2.4) 96 (4.0) 179 (7.5) 407 (16.9) 441 (18.4) 373 (15.5) 196 (8.2) 168 (7.0) 187 (7.8) 67 (2.8) 2402 (100) 60 –69 23 (1.4) 23 (1.4) 61 (3.6) 23 (1.4) 54 (3.2) 85 (5.1) 177 (10.6) 239 (14.3) 238 (14.2) 220 (13.2) 187 (1 1.2) 285 (17.0) 58 (3.5) 1673 (100) 70 –79 11 (1.5) 11 (1.5) 30 (4.2) 16 (2.3) 29 (4.1) 54 (7.6) 97 (13.7) 73 (10.3) 88 (12.4) 83 (1 1.7) 55 (7.7) 145 (20.4) 18 (2.5) 710 (100) Overall 492 (3.1) 513 (3.2) 11 14 (7.1) 471 (3.0) 789 (5.0) 1308 (8.3) 2771 (17.5) 2012 (12.7) 1673 (10.6) 1230 (7.8) 965 (6.1) 1749 (1 1.1) 712 (4.5) 15799 (100)
group, hence the relative‘prevalence’ of that refraction in that age group.
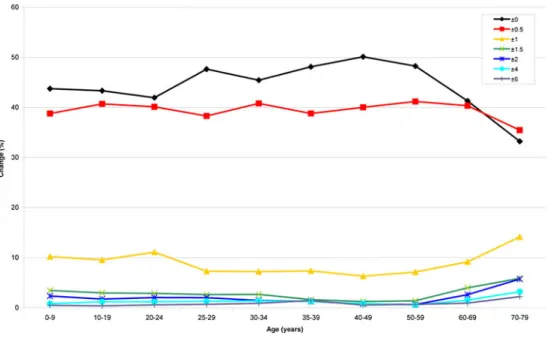
Figure1 shows the cumulative relative probabilities of
refractive stability (black line) change for each age group (in right eyes), with remarkably only 50 % of refractive stability from 25 to 39 years. The known myopic shift in childhood (orange and red lines) is visualized, as well as the hyperopic shift starting at 40 years and reaching its peak between 50
and 59 years. Figure2 illustrates the likelihood of stability
(equals ±0.25 D) or the amount of change for each initial
refraction, in all of the different age groups. Figure3depicts
the differences in refractive change over time between the right and left eye. Almost 50 % of the left eyes change their refraction (or not) synchronized to their contralateral right eye and overall 90% will not have a greater anisometric shift than ±0.5 D between right and left.
The change of cylinder was also not calculated in further detail for all age groups, since over all ages, 61 % of the right eyes did not change their cylinder at all within 5 years, and 34 % changed between 0.5 and 1 D.
Discussion
Refractive errors have a high prevalence, and are a common reason to consult an ophthalmologist or optometrist. Refractive stability over time seems to be important for many patients, but it is certainly of interest for parents of younger children with refractive errors, as well as patients and doctors undergoing/ performing refractive surgery. In retrospectively analysing our large database longitudinally, we were able to inform our interested patients with their probability, if and how much their refractive error is likely to change over the next 5 years.
Due to the large quantity of patients in our database, we had the possibility of clustering patients in defined, appro-priate age groups, without being restricted to specific cate-gories and still calculating with an appropriate and reliable number in these clusters. Previous studies investigated re-fractive changes in specific cohorts.
Lee at al. described the change in refractive error in 2,362 right eyes, in a population 43 to 84 years old followed
longitu-dinally for 10 years. In their age group 43 to 59 years (n01,456),
only 3.6 % experienced a myopic shift (< −0.5D), whereas
45.7 % in that age population changed refraction toward
hyper-opia (> +0.5D) [1]. These findings correspond well with our
results, in which we found among the age groups 40 to 49 years (n02,619) and 50 to 59 years (n02,402), a 44 % and 52 % hyperopic shift respectively. In contrast, we determined in the same age groups a 14 % and 7 % change toward myopia respectively. Above that age, a further increase in myopisation was found, which probably reflects the increase of nuclear scle-rosis. Comparable results were also found by Guzowski et al. among Blue Mountain residents (n01,850) aged 49 to 75+ years,
followed longitudinally over 5 years [2], by Gudmundsdottir et
al. in 846 individuals between 50 and 96 years followed over
5 years [3], and by Wu et al. among Barbados residents
(n02,230) 40 to 70+ years followed over 9 years [4].
McBrien and Adams observed 166 microscopists aged 21 to
55 years for over 2 years longitudinally [5]. Within this time,
45 % of the observed eyes became more myopic (>−0.37 D
SE), and 55 % did not change their refractive error. This compares well with our data, where 39 % to 51 % in these
age groups did not change their refractive error (Fig.1). Jorge et
al. followed 118 students longitudinally (mean age 20.6 years)
over 3 years [6]. Within that time, 78 % of their students
experienced no change in refraction; 22 % became more my-opic, among whom only 2.5 % had a myopic shift of >1 D. Comparing these results to our data and those of McBrien and Adams, one would have expected a larger refractive variability in that age group. This might be related to a selection bias in the different cohorts. While we only found 24 % to have initial hyperopic refractive errors in that age group, Jorge’s cohort showed a 49 % incidence of hyperopic students.
Dirani et al. evaluated the long-term refractive out-comes after LASIK or PRK in 389 myopic eyes (229
patients) [7]. Although at 1 month postoperative a mean
SE of 0.01 D was reached, over the years a progressive
myopic shift of up to −0.78 D was observed 6 to 9 years
Fig. 1 Shows the cumulative relative probabilities of refractive stability (black line) change for each age group (in right eyes), with remarkably only 50 % of refractive stability from 25 to 39 years. The known myopic shift in childhood (orange and red lines) is visualized, as well as the hyperopic shift starting at 40 years and reaching its peak between 50 and 59 years
later. The authors did not indicate any age details, but
one of the more probable reasons for this ‘recurrence’
might be just the physiological refractive development which would have happened in these patients. Koshi-mizu et al. recently also reported their results 10 years after PRK for myopia in 42 eyes aged 21 to 60 years. Depending on the initial refractive error they found
recurrences of−0.9 to −1.2 D [8]. Pietilä et al. followed
92 myopic eyes longitudinally over 8 years after PRK, aged 19 to 54 years (mean 32 years). Thirty-five
per-cent of their initial low myopes (< −6D) still changed
their refraction and became more myopic (−0.5 to −2D)
between 2 and 8 years after the intervention [9]. This
seems not surprising, since stable refraction over 5 years is only reached in 50 % of myopic patients above 25 years of age. Below that age, refractive stability is unlikely, a reason why refractive correction might be postponed or overcorrected, or why at least patients should be thoroughly informed about the likelihood of further ongoing natural refractive change.
Myopisation in children due to axial length growth is
a well-known fact [10]. Unfortunately, no reports exist
to date indicating the likelihood of refractive change from an initial refractive error in children up to 20 years.
Figure 2 clearly shows that, for example, a child (0–
9 years) with initially −1 D has a probability of 25 %
of 'increasing' his/her myopia by another −1.25 to −3 D,
and an even higher likelihood of 35 % to 'increase' over
< −3.25 D within the following 5 years of life.
Mäntyjärvi followed 46 hyperopic and 133 myopic chil-dren (aged 7 to 15 years) over 5 to 8 years, and found
that the mean myopic progression was ‘faster’ in the
initial myopic children, with−0.55 D/y compared to −0.12 D/y
among the hyperopic children [11].
Since we did not measure axial length or keratometry, we only report on the overall refractive changes found. The etiological reasons are probably not the same for all the different age groups. Due to the fact that our cohort is an ophthalmic patient cohort, our database has the advantage and the shortcoming of this bias. Nevertheless, we believe, having analysed such a large number of patients, that the patient cohort will be comparable for any clinic and practice in the west. Furthermore, some pathologies known to affect refractive changes (e.g., hyper- or hypoglycaemia, macular oedema) might in a few cases have falsely influenced our results. Another possible bias lies in the consequent non-cycloplegic autorefractor measurement in all patients over 14 years of age. Although more consistent and less examiner-dependent results can be expected, it might still be possible to underestimate the fraction of hypermetropia, in younger adults, while giving reliable results for myopics
[12]. Consistency of measurements made by different
observers measuring the same patients over time is crucial. The ICC for our device used was assessed and calculated to be 0.98 for spherical equivalent data, which indicates a very high reproducibility. Módis et al. also described ICCs
be-tween 0.97 and 0.99 for the same device [13].
Knowledge about refractive stability or its development is of importance for any refractive surgeon and pediatric ophthalmologist. The common assumption that refractive stability is reached in the majority of our patients at the
age of 18 years seems out-dated [14].
Fig. 3 Depicts the differences in refractive change over time between the right and left eye. Almost 50 % of the left eyes change their refraction (or not) synchronized to their contralateral right eye and overall 90 % will not have a greater anisometric shift than ±0.5 D between right and left
Fig. 2 Illustrates the likelihood of stability (equals ±0.25 D) or the amount of change for each initial refraction, in all of the different age groupsAcknowledgments We would like to thank Andreas Schoetzau (Uni-versity Hospital Basel) and Anne Theissing (Augenärzte Gemeinschaft-spraxis Ahaus-Gronau-Lingen) for their statistical support.
Financial disclosure No author has a financial or proprietary interest in any material or method mentioned.
Competing interests None
Financial support None
References
1. Lee KE, Klein BEK, Klein R, Wong TY (2002) Changes in refraction over 10 years in an adult population: the Beaver Dam Eye Study. Invest Ophthalmol Vis Sci 43:2566–2576
2. Guzowski M, Wang JJ, Rochtchina E, Rose KA, Mitchell P (2003) Five-year refractive changes in an older population: the Blue Mountains Eye Study. Ophthalmology 110:1364–1370
3. Gudmundsdottir E, Arnarsson A, Jonasson F (2005) Five-year refractive changes in an adult population: Reykjavik Eye Study. Ophthalmology 112(4):672–677
4. Wu SY, Yoo YJ, Nemesure B, Hennis A, Leske MC (2005) Barbados Eye Studies Group. Nine-year refractive changes in the Barbados Eye Studies. Invest Ophthalmol Vis Sci 46:4032–4039
5. McBrien NA, Adams DW (1997) A longitudinal investigation of adult-onset and adult-progression of myopia in an occupational group. Invest Ophthalmol Vis Sci 38:321–333
6. Jorge J, de Almeida JB, Parafita MA (2008) Binocular vision changes in university students: a 3-year longitudinal study. Optom Vis Sci 85:E999–E1006
7. Dirani M, Couper T, Yau J, Ang EK, Islam FM, Snibson GR, Vajpayee RB, Baird PN (2010) Long-term refractive outcomes and stability after excimer laser surgery for myopia. J Cataract Refract Surg 36:1709–1717
8. Koshimizu J, Dhanuka R, Yamaguchi T (2010) Ten-year follow-up of photorefractive keratectomy for myopia. Graefes Arch Clin Exp Ophthalmol 248:1817–1825
9. Pietilä J, Mäkinen P, Pajari T, Suominen S, Keski-Nisula J, Sipilä K, Huhtala A, Uusitalo H (2004) Eight-year follow-up of photo-refractive keratectomy for myopia. J Refract Surg 20:110–115 10. Gordon RA, Donzis PB (1985) Refractive development of the
human eye. Arch Ophthalmol 103:785–789
11. Mäntyjärvi MI (1985) Changes of refraction in schoolchildren. Arch Ophthalmol 103:790–792
12. Krantz EM, Cruickshanks KJ, Klein BE, Klein R, Huang GH, Nieto FJ (2010) Measuring refraction in adults in epidemiological studies. Arch Ophthalmol 128:88–92
13. Módis L Jr, Szalai E, Kolozsvári B, Németh G, Vajas A, Berta A (2012) Keratometry evaluations with the Pentacam high resolution in comparison with the automated keratometry and conventional corneal topography. Cornea 31:36–41
14. Fledelius HC (1981) The growth of the eye from the age of 10 to 18 years: a longitudinal study including ultrasound oculometry. Doc Ophthalmol Proc Series 29:211–215