HAL Id: hal-02196762
https://hal.archives-ouvertes.fr/hal-02196762
Submitted on 29 Jul 2019HAL is a multi-disciplinary open access
archive for the deposit and dissemination of sci-entific research documents, whether they are pub-lished or not. The documents may come from teaching and research institutions in France or abroad, or from public or private research centers.
L’archive ouverte pluridisciplinaire HAL, est destinée au dépôt et à la diffusion de documents scientifiques de niveau recherche, publiés ou non, émanant des établissements d’enseignement et de recherche français ou étrangers, des laboratoires publics ou privés.
Siblings and child development
Elise de la Rochebrochard, Heather Joshi
To cite this version:
Elise de la Rochebrochard, Heather Joshi. Siblings and child development. Longitudinal and Life Course Studies, 2013, 4 (3), pp.276 - 287. �10.14301/llcs.v4i3.248�. �hal-02196762�
Longitudinal and Life Course Studies 2013 Volume 4 issue 3 Pp 276-287 ISSN 1757-9597
RESEARCH NOTE
Siblings and child development
Elise de La Rochebrochard,
Ined, Paris, FranceHeather Joshi,
Institute of Education, London, United Kingdom(Received March 2013 Revised August 2013) doi:10.14301/llcs.v4i3.248
Abstract
Having many siblings, or none, may impair, or improve, a child’s development
compared to being part of a two-child family. Any effect may vary for different
aspects of development. This note describes, cross-sectionally, the observed
association between child development at ages 3 to 7 years and the number of
co-resident siblings, at three sweeps of the UK Millennium Cohort Study.
Indicators of cognitive development (verbal and non-verbal), are taken from
surveys at ages 3, 5 and 7 years. Behavioural problems are reported at the three
surveys on the Strengths and Difficulties Questionnaire. We analyze its five
sub-scales separately, and also the Total Difficulties score. For each of 26 outcomes,
we estimate the risk of falling into the most problematic 10% of the child
population, depending on the number of siblings at each survey, controlling for
the child’s gender and the level of the mother’s education. In this descriptive
exercise, maternal education stands in for a host of possible social covariates;
and allows for the least educated mothers having larger families. Children with
2 siblings generally showed increased odds of adverse outcomes, especially in
cognition at age 3. This is in line with the hypothesis of resource dilution, but
only-children tend, for some outcomes, to score worse than those in two-child
families. The odds ratios (ORs) for boys were, except one, unfavourable, of similar
magnitude to estimates for larger families. The disadvantages associated with
low maternal education were generally greater. These explorations lay the
ground for longitudinal modelling of causal pathways.
Keywords:
child development; school readiness; Strengths and Difficulties Questionnaire; siblings;
resource dilution; Millennium Cohort Study
Abbreviations:
BAS, British Ability Scales; MCS, Millennium Cohort Study; OR, Odds Ratio; PiM,
The Progress in Mathematics; SDQ, Strengths and Difficulties Questionnaire; UK, United Kingdom.
Introduction
Quantitative studies investigating influences on child development often control for the number of siblings, but seldom focus attention on it. There are reasons to expect both positive and negative effects of the number of brothers and sisters.
Children may benefit directly from the learning, company and affection that siblings can provide each other. Siblings may be social, emotional, language and cognitive assets from a child’s point of view (Azmitia & Hesser, 1993; Bowes, Maughan, Caspi, Moffitt & Arseneault, 2010; Brody, 2004; Gass, Jenkins & Dunn, 2007). Research on kindergarten children showed that children having at least one sibling display higher social skills (Downey & Condron, 2004). Children with no siblings may have low behavioural and social skills (self-centred, less cooperative), perhaps because doting parents bring them up to be “little emperors” as suggested in the case of China’s One-Child policy (Cameron, Erkal, Gangadharan & Meng, 2013). Younger siblings could benefit from their older siblings as better agents of cognitive development than immediate age-peers (Azmitia & Hesser, 1993). In return, older siblings could benefit from these teaching interactions, which are considered as an important promoter of verbal intellectual development for the “instructor” child (Smith, 1993).
On the other hand, siblings could be a liability. First, siblings can be bullies, harming a child’s emotional and behavioural development (Wolke & Skew, 2012a). The risk of being bullied at home is reported to rise with the number of siblings, from 46% with 1 sibling, 53% with 2 siblings, to 58% with 3 or more siblings (Wolke & Skew, 2012b). Secondly, siblings could create competition for parental attention, and a dilution of the resources that may be devoted to any one child. Downey posited that parents have finite levels of time, energy, and money, and that these resources are diluted among children as sibship size increases (Downey, 1995; Downey, 2001). This pattern is observed in research based on the Avon Longitudinal Study of Parents and Children (ALSPAC), finding family size to be the strongest influence on parental investment per child, even in wealthy or well educated families (Lawson & Mace, 2009). If parental investment is important for the acquisition of social or human capital, this could be key to a negative link between larger family size and
educational achievement (Becker & Tomes, 1976; Blake, 1981; Coleman, 1988). Not only could siblings “dilute” parental resources, they could also “dilute” the intellectual home milieu, according to the “confluence theory” (Steelman, Powell, Werum & Carter, 2002; Zajonc & Markus, 1975). On this hypothesis, the average intellectual level of the home decreases with the arrival of a new sibling.
While the direction and the potential causal impact of siblings on the development of a given child remains ambiguous (Guo & VanWey, 1999), the number of children in a family may reflect other circumstances which also impinge on child development. This descriptive note takes only preliminary steps towards developing research on the impact of siblings on each other. It presents some basic correlations between the number of siblings and child development in the UK at ages 3, 5 and 7. It paves the way for the elaboration suggested in our conclusions, and offers guidance on how information on siblings might handled in research focussed on other aspects of child development.
Data
We used the UK Millennium Cohort Study (MCS), a representative, but disproportionately stratified, and clustered, sample of around nineteen thousand families having a child born in 2000-2001. Data were collected at 9 months and then at 3, 5 and 7 years through home visits. From age 3, the cognitive assessments of the cohort child were administered by trained interviewers and behavioural problems were parent-reported. Detailed information on the survey is available online (www.cls.ioe.ac.uk/mcs).
Number of siblings
Siblings were defined as co-resident children, whether they were fully related or not to the cohort child. Full siblings, half, step, adopted and foster siblings were all counted. In cases of multiple births in the cohort, one child was randomly defined as the index child for this analysis and his/her twin or triplets were counted among siblings. The number of siblings was recorded four times: at 9 months and then at 3, 5 and 7 years. To allow for possible non-linearity in the relationship between number of siblings and the cohort child’s development, the variable “number of siblings” was coded in
Longitudinal and Life Course Studies 2013 Volume 4 issue 3 Pp 276-287 ISSN 1757-9597 categories: 0 sibling (the cohort child is an
only-child), 1 sibling (the cohort child is in a two-child family), and in our main analysis 2 or more siblings (i.e. a ‘large’ family of a least three children). In supplementary work, we also distinguished 3- and 4+ child families among the latter. As two children is the norm for British families (Office for National Statistics, 2012), having one sibling was set as our reference category.
Measures of child development
We investigated the cohort child’s development based on scores for cognitive and behaviour development at ages 3, 5 and 7 years, adjusted, in the case of the cognitive scores, for age at assessment. We focus exclusively on “low scores” defined as the bottom 10% of each observed distribution. We abandoned our initial intention to look at “high scores” (top 10%) as, for some of the behavioural sub-scales, the top 10% were not defined (up to 30% of the sample obtained the highest score of the distribution).
Measures of the cohort child’s cognitive
development
At age 3, cognitive development was measured by the Revised Bracken Basic Concept Scale (Bracken, 1998). The subtests administered were colours, letters, numbers and counting, sizes, comparisons, shapes. Several measures were based on the British Ability Scales (BAS) (Elliott, Smith & McCulloch, 1997). At ages 3 and 5, the BAS “naming vocabulary” instrument measured expressive (but not receptive) language ability. At age 7, BAS “word reading” measured recognition and oral reading of single words (but not reading comprehension). At age 5, BAS “picture similarities” measured non-verbal reasoning ability. At ages 5 and 7, the BAS “pattern construction” scale was used to measure non-verbal ability, especially spatial. Finally, at age 7, the “Progress in Mathematics” (PiM) test from NFER ( www.gl-assessment.co.uk/products/progress-maths) was used. This included tasks based on numbers, shape, space, measures and data handling. Thus we had eight cognitive scores in total between 3 and 7 years. These cognitive scores measured different dimensions of cognitive development with a strong verbal component for the Bracken and the BAS Naming Vocabulary.
Measures of the cohort child’s behaviour
Behaviour was measured using the Strengths and Difficulties Questionnaire (SDQ) at ages 3, 5 and 7 years (Goodman, 1997). The SDQ (www.sdqinfo.com), is recognised as a psycho-metrically sound indicator of overall child mental health problems (Goodman, Lamping & Ploubidis, 2010; Stone, Otten, Engels, Vermulst & Janssens, 2010; Vostanis, 2006). It consists of 25 items covering five subscales: emotional problems, peer problems, behavioural problems, hyperactivity and prosocial behaviour. The SDQ questionnaire was completed by the main respondent in the MCS, virtually always the mother (at least 97% of the respondents at these surveys). Usually, the SDQ is analysed in terms of its total difficulties score (which sums the four first sub-scales). However, as the presence of siblings could have different effects on the different SDQ sub-scales, we explored not only the total difficulties score but also the five sub-scales separately. At each of the three ages observed, we thus considered 6 SDQ scores with a total of 18 SDQ scores between 3 and 7 years.
Analyses
Basic analyses were carried out on cross-sections at each age, without attempting to trace the experience of individual children across sweeps. This meant that the fullest cross-sectional sample was considered at each age. For example, if a child participated in the age 3 and 7 data collections but not at age 5, s/he was included in the analyses of outcomes at 3 and 7, even if s/he could not be included in analyses of age 5 outcomes. For each different analysis done, the sample size is indicated in Tables 1 and 2 and varies from 13,338 to 14,924.
Logistic regressions were performed on the risk of having a low score (bottom 10% of the dis-tribution) on the 26 child development outcomes.
The models focussed on the number of siblings at each survey. They controlled for just two other factors known to be related to child development: the gender of the cohort child and the level of the mother’s education. The latter, for preliminary purposes, stands in for a host of possible social confounders, from poverty to parenting, including family building intentions (La Rochebrochard (de) & Joshi, 2013). Mother’s level of education was divided in three groups. The highest level was 'college educated', i.e. those with degrees, bachelors or higher, or equivalent vocational
qual-ifications (National Vocational Qualification (NVQ) Level 4 or 5). Middle education covers those who did not proceed to college but gained academic qualifications at secondary school, or equivalent vocational qualifications, at NVQ levels 2 and 3. The low education group had minimal (NVQ Level 1, or other overseas) or no qualifications. In this preliminary research, we did not consider the cohort child’s birth order, characteristics of the siblings, or other factors about the family. All percentages and odds ratios were weighted to reflect the original sampling probabilities. Variances
were estimated with the correction for a finite population. As this is only a preliminary exploration, we treated a 0.05 p-value as a test of significance, even where multiple tests were carried out. A more conservative approach would be to apply a Bonferroni correction (Bland & Altman, 1995) which would set the threshold for significance at a p-value of 0.002. This stricter criterion is also indicated in tables of results. Data analyses were carried out using STATA/SE 11.1 (Stata Press, College Station, TX, US).
Results
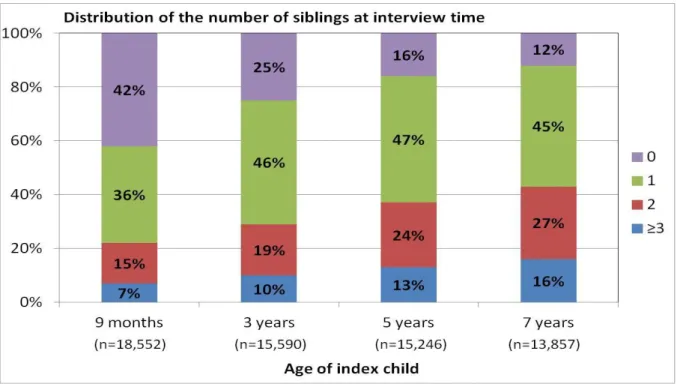
Figure 1. Distribution of the number of siblings when the cohort child is 9 months, 3, 5 and 7
years (UK Millennium Cohort)
Figure 1 shows that that the proportion of cohort children with at least one sibling rose between surveys from 58% to 88%, reflecting particularly the arrival of new babies during the early years of the cohort child’s life. Indeed, at ages 5 and 7, only-children belong to a diminishing minority (16-12%). Meanwhile, the proportion of children with three or more siblings (i.e. in a family of at least four children) rose from 7% to 16%. The two-child family was the most frequent at age 3 and
after. The sample size (see figure 1, horizontal axis labels) declined over time as the survey suffered attrition. In order to check that this survey loss was neutral with respect to family size, the distributions of siblings at 9 months were compared across the samples observed at 9 months, 3, 5 and 7 years. The four distributions (not shown) were very similar and do not indicate any attrition bias associated with number of siblings.
Elise de La Rochebrochard, Heather Joshi Siblings and child development
Figure 2. Distribution of the number of siblings when the cohort child is 7 years by mother’s
level of education (UK Millennium Cohort)
28%
14%
9%
29%
26%
28%
34%
47%
52%
10%
14%
11%
0%
20%
40%
60%
80%
100%
Low
Middle
High
0
1
2
≥3
Mother's level of education when the cohort child is 9 months
Distribution of the number of siblings at age 7
(n=3,449) (n=5,987) (n=4,390)
Figure 2 shows the distribution of number of siblings by mother’s education when the cohort child was 7. For both high and middle educated mothers, the proportions of only-child families and of large families (at least four children) were low (below 15%). Among mothers with no or minimal qualifications, larger families (four plus) occurred most often (28%) and one child families least often (10%).
Table 1 and Table 2 report the estimates from the 26 logistic multivariate regressions on the risk of having a score in the bottom 10% of the observed distribution, adjusted for number of siblings, gender of child and mother’s education. Children with no sibling (ie only-children) are compared to the reference group having 1 sibling in the column headed “only-children”. An adjusted odds ratio (OR) over unity indicates that the
only-child has a greater risk of being in the bottom 10% of the distribution, or vice-versa if the OR is less than one. A child with no siblings tends to do better than a child with one sibling on the Bracken and Naming Vocabulary at age 3 and 5, but s/he tends to do worse than a child with one sibling on the other cognitive outcomes at 5 and 7 (Picture Similarities, Pattern Construction, Word Reading, Number Skills). On the behaviour outcomes, being an only child tends to be an advantage for conduct problems and prosocial behaviour. However, this advantage tends to decrease and even to disappear for only-children aged 5 and 7 years. Being an only child tends to be a disadvantage for peer problems and hyperactivity which tends to increase for the group of children who remain without any sibling at age 5 and 7.
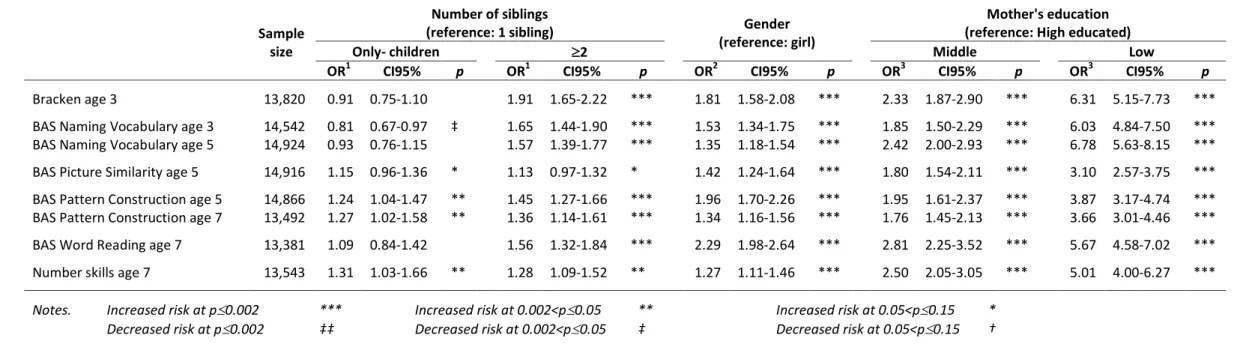
Table 1. Adjusted odds ratios for being in the bottom 10% of the observed scores distributions for cognitive outcomes by (i) number of siblings, (ii) gender and
(iii) mother's education
Sample size
Number of siblings
(reference: 1 sibling) Gender (reference: girl)
Mother's education (reference: High educated)
Only- children 2 Middle Low
OR1 CI95% p OR1 CI95% p OR2 CI95% p OR3 CI95% p OR3 CI95% p
Bracken age 3 13,820 0.91 0.75-1.10 1.91 1.65-2.22 *** 1.81 1.58-2.08 *** 2.33 1.87-2.90 *** 6.31 5.15-7.73 ***
BAS Naming Vocabulary age 3 14,542 0.81 0.67-0.97 ‡ 1.65 1.44-1.90 *** 1.53 1.34-1.75 *** 1.85 1.50-2.29 *** 6.03 4.84-7.50 ***
BAS Naming Vocabulary age 5 14,924 0.93 0.76-1.15 1.57 1.39-1.77 *** 1.35 1.18-1.54 *** 2.42 2.00-2.93 *** 6.78 5.63-8.15 ***
BAS Picture Similarity age 5 14,916 1.15 0.96-1.36 * 1.13 0.97-1.32 * 1.42 1.24-1.64 *** 1.80 1.54-2.11 *** 3.10 2.57-3.75 ***
BAS Pattern Construction age 5 14,866 1.24 1.04-1.47 ** 1.45 1.27-1.66 *** 1.96 1.70-2.26 *** 1.95 1.61-2.37 *** 3.87 3.17-4.74 ***
BAS Pattern Construction age 7 13,492 1.27 1.02-1.58 ** 1.36 1.14-1.61 *** 1.34 1.16-1.56 *** 1.76 1.45-2.13 *** 3.66 3.01-4.46 ***
BAS Word Reading age 7 13,381 1.09 0.84-1.42 1.56 1.32-1.84 *** 2.29 1.98-2.64 *** 2.81 2.25-3.52 *** 5.67 4.58-7.02 ***
Number skills age 7 13,543 1.31 1.03-1.66 ** 1.28 1.09-1.52 ** 1.27 1.11-1.46 *** 2.50 2.05-3.05 *** 5.01 4.00-6.27 ***
Notes. Increased risk at p0.002 *** Increased risk at 0.002<p0.05 ** Increased risk at 0.05<p0.15 *
Decreased risk at p0.002 ‡‡ Decreased risk at 0.002<p0.05 ‡ Decreased risk at 0.05<p0.15 †
1
Adjusted for gender and maternal education
2
Adjusted for number of siblings and maternal education
3
Elise de La Rochebrochard, Heather Joshi Siblings and child development
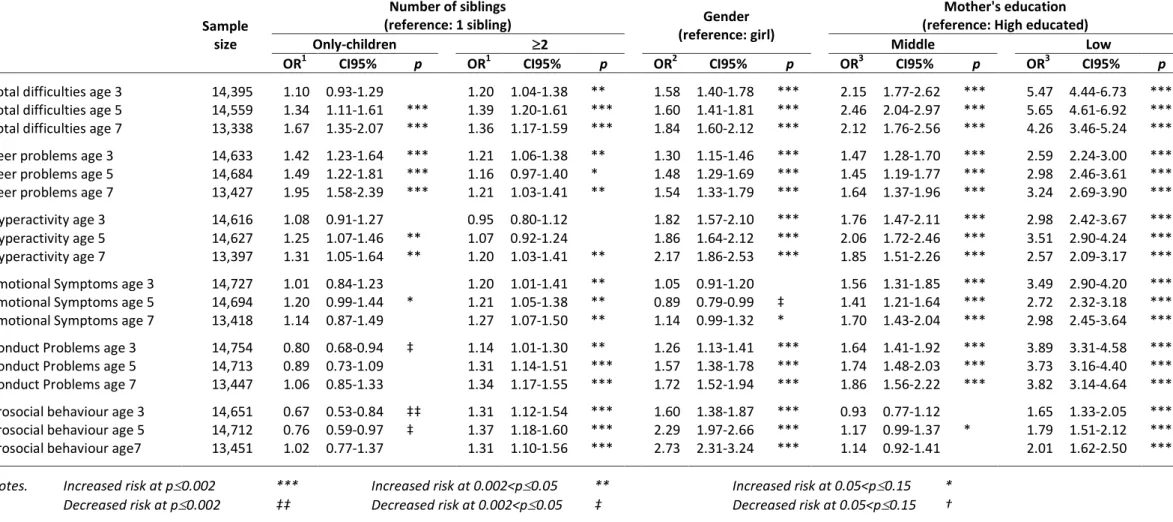
Table 2. Adjusted odds ratios for being in the bottom 10% of the observed scores distributions for behavioural outcomes from the Strengths and Difficulties
Questionnaire (SDQ) by (i) number of siblings, (ii) gender and (iii) mother's education
Sample size
Number of siblings
(reference: 1 sibling) Gender (reference: girl)
Mother's education (reference: High educated)
Only-children 2 Middle Low
OR1 CI95% p OR1 CI95% p OR2 CI95% p OR3 CI95% p OR3 CI95% p
Total difficulties age 3 14,395 1.10 0.93-1.29 1.20 1.04-1.38 ** 1.58 1.40-1.78 *** 2.15 1.77-2.62 *** 5.47 4.44-6.73 ***
Total difficulties age 5 14,559 1.34 1.11-1.61 *** 1.39 1.20-1.61 *** 1.60 1.41-1.81 *** 2.46 2.04-2.97 *** 5.65 4.61-6.92 ***
Total difficulties age 7 13,338 1.67 1.35-2.07 *** 1.36 1.17-1.59 *** 1.84 1.60-2.12 *** 2.12 1.76-2.56 *** 4.26 3.46-5.24 ***
Peer problems age 3 14,633 1.42 1.23-1.64 *** 1.21 1.06-1.38 ** 1.30 1.15-1.46 *** 1.47 1.28-1.70 *** 2.59 2.24-3.00 ***
Peer problems age 5 14,684 1.49 1.22-1.81 *** 1.16 0.97-1.40 * 1.48 1.29-1.69 *** 1.45 1.19-1.77 *** 2.98 2.46-3.61 ***
Peer problems age 7 13,427 1.95 1.58-2.39 *** 1.21 1.03-1.41 ** 1.54 1.33-1.79 *** 1.64 1.37-1.96 *** 3.24 2.69-3.90 ***
Hyperactivity age 3 14,616 1.08 0.91-1.27 0.95 0.80-1.12 1.82 1.57-2.10 *** 1.76 1.47-2.11 *** 2.98 2.42-3.67 ***
Hyperactivity age 5 14,627 1.25 1.07-1.46 ** 1.07 0.92-1.24 1.86 1.64-2.12 *** 2.06 1.72-2.46 *** 3.51 2.90-4.24 ***
Hyperactivity age 7 13,397 1.31 1.05-1.64 ** 1.20 1.03-1.41 ** 2.17 1.86-2.53 *** 1.85 1.51-2.26 *** 2.57 2.09-3.17 ***
Emotional Symptoms age 3 14,727 1.01 0.84-1.23 1.20 1.01-1.41 ** 1.05 0.91-1.20 1.56 1.31-1.85 *** 3.49 2.90-4.20 ***
Emotional Symptoms age 5 14,694 1.20 0.99-1.44 * 1.21 1.05-1.38 ** 0.89 0.79-0.99 ‡ 1.41 1.21-1.64 *** 2.72 2.32-3.18 ***
Emotional Symptoms age 7 13,418 1.14 0.87-1.49 1.27 1.07-1.50 ** 1.14 0.99-1.32 * 1.70 1.43-2.04 *** 2.98 2.45-3.64 ***
Conduct Problems age 3 14,754 0.80 0.68-0.94 ‡ 1.14 1.01-1.30 ** 1.26 1.13-1.41 *** 1.64 1.41-1.92 *** 3.89 3.31-4.58 ***
Conduct Problems age 5 14,713 0.89 0.73-1.09 1.31 1.14-1.51 *** 1.57 1.38-1.78 *** 1.74 1.48-2.03 *** 3.73 3.16-4.40 ***
Conduct Problems age 7 13,447 1.06 0.85-1.33 1.34 1.17-1.55 *** 1.72 1.52-1.94 *** 1.86 1.56-2.22 *** 3.82 3.14-4.64 ***
Prosocial behaviour age 3 14,651 0.67 0.53-0.84 ‡‡ 1.31 1.12-1.54 *** 1.60 1.38-1.87 *** 0.93 0.77-1.12 1.65 1.33-2.05 ***
Prosocial behaviour age 5 14,712 0.76 0.59-0.97 ‡ 1.37 1.18-1.60 *** 2.29 1.97-2.66 *** 1.17 0.99-1.37 * 1.79 1.51-2.12 ***
Prosocial behaviour age7 13,451 1.02 0.77-1.37 1.31 1.10-1.56 *** 2.73 2.31-3.24 *** 1.14 0.92-1.41 2.01 1.62-2.50 ***
Notes. Increased risk at p0.002 *** Increased risk at 0.002<p0.05 ** Increased risk at 0.05<p0.15 *
Decreased risk at p0.002 ‡‡ Decreased risk at 0.002<p0.05 ‡ Decreased risk at 0.05<p0.15 †
1
Adjusted for gender and maternal education
2 Adjusted for number of siblings and maternal education 3
We turn to multi-child families in Tables 1 and 2 (column “number of siblings, 2). Compared to cohort children having just one sibling, children with two or more siblings nearly always exhibited a significantly raised risk of low scores. The adjusted odds ratios are never above 2, but they come closest to it for the Bracken and BAS Naming Vocabulary (OR between 1.6 and 1.9). The other cognitive outcomes and behaviour problems nearly all had adjusted odds ratios in the range 1.2 to 1.4. There was no significant difference in the risk of hyperactive problems between children with one or more than one sibling, at ages 3 and 5. Peer problems and lower levels of pro-social skills, might have been supposed to be less prevalent where there are plenty of siblings from whom to learn social skills, but we do not find such a pattern. On the whole, having several siblings was associated with behavioural and cognitive problems.
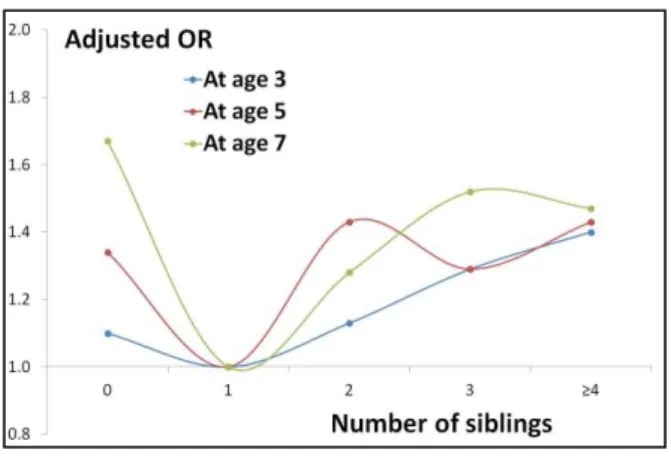
We also undertook a supplementary analysis by splitting those with two and more siblings into three sub-groups: 2 siblings, 3 siblings, and 4 and more siblings (Figures 3 and 4). There were too few families with 5 or more siblings to treat separately, and even between 3 and 4 siblings the confidence limits on odds ratios tend to overlap. For all cognitive outcomes and the total difficulties score, there is a tendency to an increase in the adjusted odds ratios as the number of siblings rises from one to 4 or more. This pattern was also observed to some degree for conduct and peer problems elements, but the relationship with sib size is less clear for the other sub-scales of the SDQ.
To provide some sense of the salience of these differences, Tables 1 and 2 also show the mutually adjusted ORs for the other two variables in the models. For the cohort chid’s gender, girls were set as the reference category, thus an adjusted OR above 1 indicated that boys score worse than girls (all else being equal). In 23 out of 26 outcomes, boys are significantly more at risk of having a low score on cognitive and behavioural outcomes (Tables 1 and 2). The only exception is the emotional symptoms sub-scale of the SDQ at age 5, where girls have a higher risk. These odds ratios are mostly in the same range as the ratios comparing 2 siblings with one sibling. However, the estimates for gender and number of siblings are dwarfed by those estimated for mother’s education. Compared to mothers with high education, the adjusted ORs for mothers with the low level of education were around 6 for the Bracken and the BAS Naming Vocabulary, around 4 for other cognitive outcomes and around 3 for the different sub-scales of the SDQ. We tested for interactions of the number of sibs with child sex and with mother’s education, but found nearly nothing significant (results not shown). The relationships between child's outcomes and number of siblings do not appear to vary for families where there might well be different levels of resources to spread between siblings. The information on social background captured in mother’s education is a considerably stronger correlate of child outcomes than either sibling number or gender.
Elise de La Rochebrochard, Heather Joshi Siblings and child development
Figure 3. Odds ratios for being in the bottom 10% of the observed score distributions for cognitive
outcomes, for four categories of sibling numbers relative to 1 sibling, adjusted for index child’s
gender and mother's education (UK Millennium Cohort)
a) Bracken at age 3, Naming Vocabulary at age 3 and 5, Word Reading at age 7
(1)b) Picture Similarity at age 5, Pattern Construction at age 5 and 7, Maths at age 7, Word
Reading at age 7
Notes.
(1) When the number of siblings is 4, the adjusted OR for the Bracken at age 3 was of 3.92 [CI95%: 3.08, 4.97], the adjusted OR for the BAS Naming Vocabulary was of 2.63 [CI95%: 2.09, 3.31] at age 3 and 2.31 [CI95%: 1.83, 2.91] at age 5.
Figure 4. Odds ratios for being in the bottom 10% of the observed score distributions for
behavioural outcomes, for four categories of sibling numbers relative to 1 sibling, adjusted for
index child’s gender and mother's education (UK Millennium Cohort)
a) Total difficulties
b) Peer problems
c) Hyperactivity
d) Emotional symptoms
e) Conduct Problems
f) Prosocial Behaviour
(1)Notes.
(1) When the number of siblings is 0, the adjusted OR for the SDQ Prosocial Behaviour was of 0.67 [CI95%: 0.53, 0.84] at age 3 and was of 0.76 at age 5 [CI95%: 0.59, 0.97]. These low values reflect high levels of prosocial behaviour.
Elise de La Rochebrochard, Heather Joshi Siblings and child development
Conclusion
Looking across a broad range of indicators of developmental difficulties, we observed that for all outcomes but one (hyperactivity), children with two or more siblings appear at disadvantage compared to children with only one sibling. The differentials associated with having several siblings are more pronounced for outcomes with a strong verbal component than other cognitive and behaviour outcomes. Such a result is in accordance with the resource dilution hypothesis, even though these cross-sectional descriptions are not an adequate test of a causal relationship of harm or gain from having siblings. The hypothesis of social gains from multiple siblings does not seem to fit with our results on behavioural problems. In particular, children in large families do not appear to be protected from peer problems or problems on the prosocial scale and, somewhat contrary to expectations, only-children, at least at 5 and under, have fewer prosocial problems than children with a sibling.
Comparing only-children with those having one sibling presents a more complex pattern. Being an only-child appears an advantage for outcomes with a strong verbal component at young age, but a disadvantage for other cognitive outcomes. On behavioural outcomes, being an only-child could be either an advantage or a disadvantage depending on the sub-scale, however the advantage seems to disappear for older lone children. Bear in mind that the only-child at 5 and 7 years is in a diminishing minority (16%-12%) whereas there were more of them at 3 years (25%). Thus, the fact that the contrast between no sibling and one sibling changes with the child's age, reminds us that family building is a dynamic and possibly a selective process. The apparent ’disadvantages’ of being an only-child could reflect factors which select their parents out of further childbearing. There may be something
particular about the families who do not proceed to have further children, which helps account for the modest extra developmental difficulties we have recorded here. Another hypothesis would be that developmental problems with one child may even inhibit progression to a next birth.
Although this is only a first step in the investigation of whether siblings help or hinder a child’s development, we can report to other researchers who may wish to control for siblings in their investigations of other topics, that it would be better to control for the number of siblings as grouped variables than just a linear term. In this research note, several outcomes have been investigated in order to draw a general picture of differentials by number of siblings. However, each outcome would need to be investigated and discussed more thoughtfully. Moreover, before we can reach any conclusions about the mechanisms whereby siblings may impact on child development, it will be necessary to make use of evidence about the top end of the distributions as well as those in most difficulty, and of the longitudinal nature of the data, to see how children’s scores change over time when the number of siblings changes and to model other factors. The most obvious one is birth order (Black, Devereux & Salvanes, 2005; Lawson & Mace, 2010). Is it an advantage to be the first-born regardless of the number of younger sibs who come along? Is it particularly important to be shielded from resource dilution in the earliest years of life? One could also consider, the interval between births, the age of the cohort child, the siblings' gender, whether the cohort birth or the next one had been intended, the quality of relationship between siblings, the arrival and departure of non-natural siblings, other predictors of parental invest-ment and child developinvest-ment, parental partnership stability, the home learning environment, parenting practice and other circumstances.
References
Azmitia, M., & Hesser, J. (1993). Why Siblings Are Important Agents of Cognitive Development: A Comparison of Siblings and Peers. Child Development 64, 430-444.
Becker, G.S., & Tomes, N. (1976). Child Endowments and the Quantity and Quality of Children. Journal of Political
Economy 84, S143-S162.
Black, S.E., Devereux, P.J., & Salvanes, K.G. (2005). The more the merrier? The effect of family size and birth order on children's education. The Quarterly Journal of Economics 120, 669-700.
Blake, J. (1981). Family Size and the Quality of Children. Demography 18, 421-442.
Bland, J.M., & Altman, D.G. (1995). Multiple significance tests: the Bonferroni method. British Medical Journal 310, 170.
Bowes, L., Maughan, B., Caspi, A., Moffitt, T.E., & Arseneault, L. (2010). Families promote emotional and behavioural resilience to bullying: evidence of an environmental effect. Journal of Child Psychology and Psychiatry and
allied disciplines 51, 809-817.
Bracken, B.A. (1998). Bracken basic concept scale - revised (BBCS-R). San Antonio: Psychological Corporation.
Brody, G.H. (2004). Siblings' Direct and Indirect Contributions to Child Development. Current Directions in
Psychological Science 13, 124-126.
Cameron, L., Erkal, N., Gangadharan, L., & Meng, X. (2013). Little emperors: behavioral impacts of China's One-Child Policy. Science 339, 953-957.
Coleman, J.S. (1988). Social Capital in the Creation of Human Capital. American Journal of Sociology 94, S95-S120. Downey, D.B. (1995). When Bigger Is Not Better: Family Size, Parental Resources, and Children's Educational
Performance. American Sociological Review 60, 746-761.
Downey, D.B. (2001). Number of siblings and intellectual development. The resource dilution explanation. American
Psychologist 56, 497-504.
Downey, D.B., & Condron, D.J. (2004). Playing Well with Others in Kindergarten: The Benefit of Siblings at Home.
Journal of Marriage and Family 66, 333-350.
Elliott, C.D., Smith, P., & McCulloch, K. (1997). British Ability Scales Second Edition (BAS II): Technical Manual. London: nferNelson.
Gass, K., Jenkins, J., & Dunn, J. (2007). Are sibling relationships protective? A longitudinal study. Journal of Child
Psychology and Psychiatry and allied disciplines 48, 167-175.
Goodman, A., Lamping, D.L., & Ploubidis, G.B. (2010). When to use broader internalising and externalising subscales instead of the hypothesised five subscales on the Strengths and Difficulties Questionnaire (SDQ): data from British parents, teachers and children. Journal of Abnormal Child Psychology 38, 1179-1191.
Guo, G., & VanWey, L.K. (1999). Sibship Size and Intellectual Development: Is the Relationship Causal? American
Sociological Review 64, 169-187.
La Rochebrochard (de), E., & Joshi, H. (2013). Children born after unplanned pregnancies and cognitive development at 3 years: social differentials in the United Kingdom Millennium Cohort. American Journal of Epidemiology, advance access published July 25, 2013.
Lawson, D.W., & Mace, R. (2009). Trade-offs in modern parenting: a longitudinal study of sibling competition for parental care. Evolution and Human Behavior 30, 170-183.
Lawson, D.W., & Mace, R. (2010). Siblings and childhood mental health: evidence for a later-born advantage. Social
Science & Medicine 70, 2061-2069.
Office for National Statistics. (2012). Chapter 3: Fertility. In National Population Projections, 2010-based reference
volume (pp. 1-16). UK: ONS.
Smith, T.E. (1993). Growth in Academic Achievement and Teaching Younger Siblings. Social Psychology Quarterly 56, 77-85.
Steelman, L.C., Powell, B., Werum, R., & Carter, S. (2002). Reconsidering the Effects of Sibling Configuration: Recent Advances and Challenges. Annual Review of Sociology 28, 243-269.
Stone, L.L., Otten, R., Engels, R.C., Vermulst, A.A., & Janssens, J.M. (2010). Psychometric properties of the parent and teacher versions of the strengths and difficulties questionnaire for 4- to 12-year-olds: a review. Clinical Child
and Family Psychology Review 13, 254-274.
Vostanis, P. (2006). Strengths and Difficulties Questionnaire: research and clinical applications. Current Opinion in
Psychiatry 19, 367-372.
Wolke, D., & Skew, A.J. (2012a). Bullying among siblings. International Journal of Adolescent Medicine and Health 24, 17-25.
Wolke, D., & Skew, A.J. (2012b). Family factors, bullying victimisation and wellbeing in adolescents. Longitudinal and
Life Course Studies 3, 101-119.
Zajonc, R.B., & Markus, G.B. (1975). Birth order and intellectual development. Psychological Review 82, 74-88.