THE COST AND CYCLE TIME IMPLICATIONS OF SELECTED CONTRACTOR AND AIR FORCE SYSTEM PROGRAM OFFICE MANAGEMENT POLICIES DURING THE
DEVELOPMENT PHASE OF MAJOR AIRCRAFT ACQUISITION PROGRAMS by
SEAN MORGAN
B.A., Philosophy University of Colorado, 1986 B.A., Japanese University of Colorado, 1986 B.S., Aerospace Engineering University of Kansas, 1993
Submitted to the Sloan School of Management and the System Design and Management Program in Partial Fulfillment of the Requirements for the Degrees of
MASTER OF SCIENCE IN MANAGEMENT and
MASTER OF SCIENCE IN ENGINEERING AND MANAGEMENT
MASSACHUSETTS INSTITUTE
OF TECHNOLOGY at the
Massachusetts Institute of Technology ,may 1999
@ 1999 Massachusetts Institute of Technology. All rights reserved.
Signature of Author:__
System Design and Management Program MIT Sloan School of Management May 21, 1999 Certified by:_
Wesley L. Harris Professor of Aeronautics and Astronautics MIT Departjnent of Aeronautics and Astronautics
1
/ / / Thesis SupervisorCertified by:
James H. Hines Senior Lecturer MIT Sloan School of Management Thesis Supervisor Accepted by:
John R. Williams Associate Professor Civil and Environmental Engineering Co-director, System Design and Management Program
THE COST AND CYCLE TIME IMPLICATIONS OF SELECTED CONTRACTOR AND AIR FORCE SYSTEM PROGRAM OFFICE MANAGEMENT POLICIES DURING THE
DEVELOPMENT PHASE OF MAJOR AIRCRAFT ACQUISITION PROGRAMS
by
SEAN MORGAN
Submitted to the Sloan School of Management and the System Design and Management Program in Partial Fulfillment of the Requirements for the Degrees of
MASTER OF SCIENCE IN MANAGEMENT and
MASTER OF SCIENCE IN ENGINEERING AND MANAGEMENT
ABSTRACT
The interactions between an Air Force System Program Office (SPO) and the prime contractor during the research and development phase of a major aircraft acquisition program are investigated using continuous-time simulation models. The cost and cycle continuous-time implications of select management policies are evaluated. The work confirms the high degree of interdependence inherent in the SPO-contractor relationship, indicating that a systems approach to managing this system is desirable. It also demonstrates that effective use of staffing policies and management reserves, as well as attention to process quality, can result in significant cost and schedule performance improvements.
Several basic project management insights are found to underlie many SPO-contractor system behaviors including that: quality drives the level of rework experienced by a program, workforce capability is a prime contributor to project quality, and proper management of the workforce is critical for optimal program cost and schedule performance. Explorations of SPO-contractor system behaviors imply a link between a focus on schedule adherence and increased program cost and schedule slip, and they advise that SPO productive capacity is critical for cost growth mitigation, as is control of contractor and workforce turnover, and that including realistic assessments of quality and productivity in early cost estimates are critical for their accuracy.
THESIS SUPERVISORS:
Wesley L. Harris
Title: Professor of Aeronautics and Astronautics MIT Department of Aeronautics and Astronautics James H. Hines
Title: Senior Lecturer
MIT Sloan School of Management THESIS READER:
Charles W. Boppe Title: Senior Lecturer
ACKNOWLEDGEMENTS
The list of individuals who contributed to this work is long and its quality would have been materially diminished by the absence of even one. Therefore I would like to thank each of those who made this effort possible. However, there are three who deserve special thanks - my advisors, Wes Harris and Jim Hines,
and my wife, Pam Liu. Without these three, the thesis could never have been completed. Each, in their own way, provided indispensable guidance and support. But most of all they were very patient. Thank you.
TABLE OF CONTENTS ABASTRACT ...--- ... . . ---... 2 ACKNOW LEDGEMENTS ...--...----.---..-...---... 3 TABLE OF CONTENTS ...---...---....-. ---... 4 LIST OF SYMBOLS ...---... 6 LIST OF TABLES...----...-- --- -- 7 LIST OF FIGURES...---. . ---...--- 7 1 INTRODUCTION ...-...--...---... 10 1.1 BACKGROUND INFORMATION ... 10
1.1.1 The External Environment ...
11
1.1.2 The Contractor and System Program Office... 12
1.2 RESEARCH AND STUDY METHODOLOGY ... 17
2 THE BASIC PROJECT MODEL ... 19
2.1 T HE R EW ORK C Y CLE ...---...---. 19
2.2 QUALITY ...--. -- - - . - -- -... 24
2.3 PRODUCTIVITY... 28
2.4 WORKFORCE... ...--... 30
2.5 SCHEDULE ...---... 37
3 CONTRACTOR AND SYSTEM PROGRAM OFFICE MODEL... 39
3.1 MODELING THE CONTRACTOR... ... 39
3.1.1 Contractor's Initial Estimates of Project Scope and Cost ... 40
3.1.2 C ontractor C osts...--. 41
3.1.3 R ew ork ...---... .--.... . . --... 42
3.1.4 Q uality ...- ... ---... ---... ... 43
3.1.5 Overtime and Fatigue ... 44
3.1.6 P roductivity...----... -... 45
3.1.7 Rework Discovery Time ... 46
3.1.8 W orkforce... ... 4 7 3.1.9 Schedule.. . . ... ... 50
3.1.10 M anagem ent R eserve ... 51
3.2 MODELING THE SYSTEM PROGRAM OFFICE - KEY DIFFERENCES FROM THE CONTRACTOR ... 53
3.2.1 M ilitary W orkforce... 53
3.2.2 Determination of Manpower by Allocation Rather than by Scope ... 54
3.3 VALIDATION OF THE SPO-CONTRACTOR MODEL ... 55
4 ANALYSIS...---. . ---...----... 57
4.1 CONTRACTOR IN ISOLATION ... 57
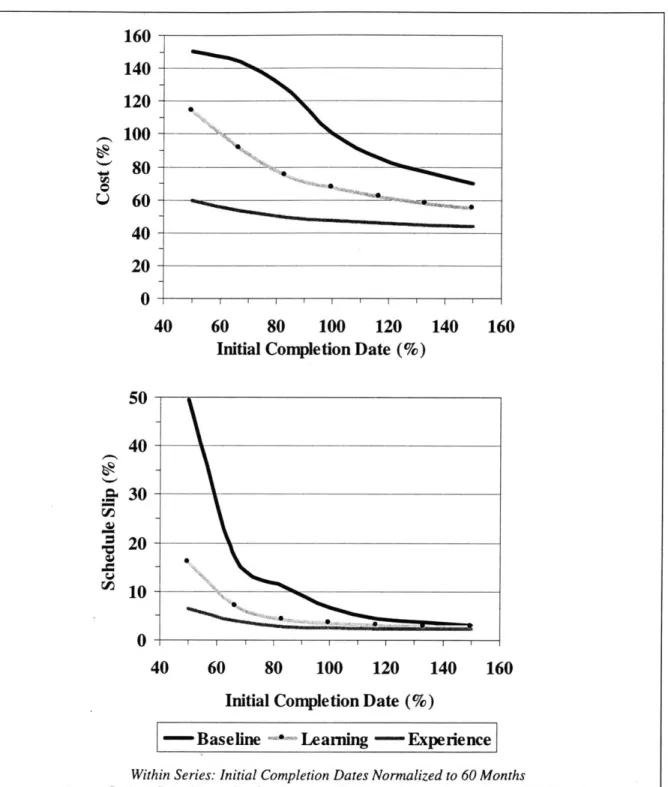
4.1.1 Half the Work in Half the Time Doesn't Cost Half as Much ... 57
4.1.2 Schedule Compression... 62
4.1.3 The Hidden Costs of Overtime ... 68
4.1.4 Workforce Management Revisited ... 71
4.1.5 Management Reserve ... 74
4.2 CONTRACTOR AND PROGRAM OFFICE INTERACTION ... 78
4.2.1 High officer turnover is expensive ... 78
4.2.3 SPO personnel allocation ... 87
4.2.4 The importance of a systems approach to managing the SPO-contractor system... 91
4.2.5 Funding profiles... 94
5 CONCLUSIONS AND RECOMMENDATIONS... 101
6 FU R TH ER IN V ESTIG A TIO N S ... 110
7 REFEREN CES...110
8 APPEN D IX... 114
8.1 ACQUISITION COM M UNITY ORGANIZATION CHART ... 114
8.2 N EVISON O VERTIM E EFFECTIVENESS CHART ... 116
8.3 SYSTEM D YNAM ICS ESSENTIALS ... 117
8.3.1 Causa lloops ... 117
8.3.2 Stock and flow diagrams... 118
8.4 SIM PLE PROJECT M ODEL DOCUMENTATION ... 120
8.4.1 Sim ulation Control Param eters ... 121
8.4.2 W orkforce Experience... 122 8.4.3 Indicated W orkforce... 124 8.4.4 Productivity... 125 8.4.5 Q uality ... 127 8.4.6 Rework ... 129 8.4.7 Schedule... 131 8.4.8 W orkforce... 134
8.5 SPO-CONTRACTOR M ODEL DOCUMENTATION ... 136
8.5.1 Contractor M odel D ocum entation... 137
8.5.2 Program Office M odel D ocum entation... 190
8.5.3 Governm ent M odel Docum entation... 261
LIST OF SYMBOLS
Symbol Definition
C ... Estim ated program cost.
C*... Estimated program cost which includes the effects of quality and productivity.
E... The cost estimation error resulting from not including quality and productivity effects, or the increment to cost from less than perfect quality and expected productivity.
P ... Expected average productivity of the workforce used to make initial cost estimations.
P* ... Actual average gross productivity of workforce during program.
q... A verage project quality.
S... Project scope. The total effort required to complete the project if quality was 100 percent.
5*... Total project scope; the total effort required to complete a project including rework.
W ... A verage cost per worker.
p ... Ratio of actual gross productivity and expected productivity. (P*/P)
Pdy... Productivity
ACTIVE INITIAL(X,Y)... ACTIVE INITIAL(active equation, initial equation) Returns the value of the
active equation during simulation. However, for determining initial conditions the value of the initial equation is returned. Normally this function is used to break a loop of simultaneous initial value equations.
DELAY INFORMATION ... DELAY INFORMATION (input, delay time, initial value) This function returns the value of the input delayed by the delay time - a material delay. IF THEN ELSE ... IF THEN ELSE(condition, true value, false value) This function returns first
true value if the condition is true and false value if condition is false.
INTEG(X,Y)... INTEG(rate, initial value) This function performs the integral of the given rate, starting from the initial value.
MAX(X,Y) ... F Function which returns the greater of X or Y.
MIN(X,Y)... Function which returns the lesser of X or Y.
SMOOTH(X,Y)... SMOOTH(input, delay time) This function is equivalent to INTEG((input -SMOOTH)/delay time, input).
SMOOTHI(X,Y,Z)... SMOOTH(input, delay time, initial value) Essentially the SMOOTH function with a designated initial value. It is equivalent to
LIST OF TABLES
TABLE 1: COMPARISON OF PROGRAM COST AND SCHEDULE PERFORMANCE ... 94
TABLE 2: IMPORTANT SYSTEM VARIABLES AND THEIR IMPACT ON THE SPO-CONTRACTOR SYSTEM ... 106
TABLE 3: D EFINITIONS OF LINK POLARITY ... 117
LIST OF FIGURES FIGURE 1: STUDY BOUNDARIES AND EXTERNAL INFLUENCES... I 1 FIGURE 2: FUNDAMENTAL ELEMENTS OF THE REWORK CYCLE... 20
FIGURE 3: A TYPICAL PATTERN OF PROJECT PROGRESS... 21
FIGURE 4: A TYPICAL TIME TO DISCOVER REWORK TIME SERIES AS A FUNCTION OF PROJECT EXECUTION P E R IO D ... 2 2 FIGURE 5: EFFECT OF TIME REQUIRED TO DISCOVER REWORK ON BUILDUP OF UNDISCOVERED REWORK ... 23
FIGURE 6: TYPICAL VALUES OF QUALITY IN DEVELOPMENT PROJECTS... 24
FIGURE 7: FOUR DETERMINATES OF QUALITY OVER TIME ... 25
FIGURE 8: EXAMPLE OF PROJECT QUALITY OVER TIME... 26
FIGURE 9: EXAMPLE FUNCTIONAL RELATIONSHIPS FOR THE EFFECT OF PAST WORK QUALITY ON P RESEN T Q U ALITY ... 27
FIGURE 10: PROCESS Q UALITY ISOLINES... 27
FIGURE 11: DETERMINATES OF PRODUCTIVITY OVER TIME... 28
FIGURE 12: COMPARISON OF PRODUCTIVITY VALUES ... 29
FIGURE 13: DETERMINATES OF W ORKFORCE SIZE... 30
FIGURE 14: BASIC W ORKFORCE STRUCTURES... 31
FIGURE 15: EXAMPLE WORKFORCE SIZE OVER A PROJECT'S LIFE ... 32
FIGURE 16: DILUTION OF W ORKFORCE EXPERIENCE ... 32
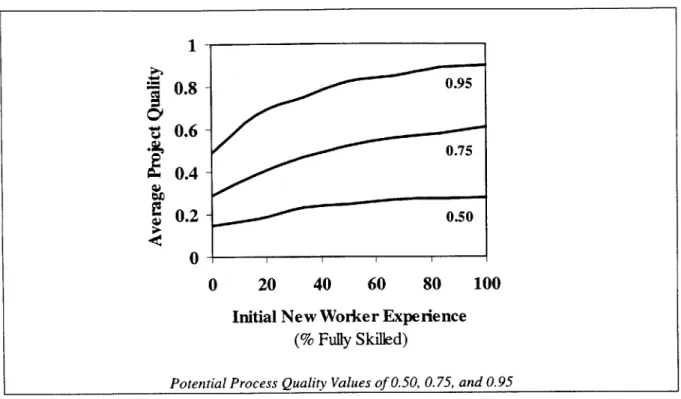
FIGURE 17: GENERAL TRENDS IN PROCESS QUALITY ISOGRAMS FOR AFFECT OF NEW WORKER EXPERIENCE ON AVERAGE PROJECT QUALITY ... 33
FIGURE 18: EXAMPLE QUALITY LEARNING CURVE ... 33
FIGURE 19: TRENDS IN MAXIMUM WORKFORCE WITH STAFF-UP RATE... 34
FIGURE 20: TRENDS IN QUALITY WITH STAFF-UP RATE... 35
FIGURE 21: TRENDS IN SCHEDULE PRESSURE WITH STAFF-UP RATE ... 35
FIGURE 22: TRENDS IN LABOR COSTS WITH STAFF-UP RATE... 36
FIGURE 23: PROJECT SCHEDULE DYNAMIC ELEMENTS ... 37
FIGURE 24: POTENTIAL WORKFORCE BENEFITS OF REALISTIC SCHEDULES ... 38
FIGURE 25: POTENTIAL QUALITY IMPLICATIONS OF REALISTIC SCHEDULES ... 38
FIGURE 26: CONTRACTOR'S INITIAL PROJECT SCOPE AND COST ESTIMATE STRUCTURE... 40
FIGURE 27: CONTRACTOR'S COST CALCULATION STRUCTURE... 41
FIGURE 28: CONTRACTOR'S REWORK CYCLE STRUCTURE ... 42
FIGURE 29: CONTRACTOR'S QUALITY STRUCTURE ... 43
FIGURE 30: OVERTIME AND FATIGUE STRUCTURE... 44
FIGURE 31: PRODUCTIVITY STRUCTURE ... 45
FIGURE 32: DETERMINATES OF CONTRACTOR'S TIME TO DETECT REWORK ... 46
FIGURE 33: CONTRACTOR'S WORKFORCE STRUCTURE ... 47
FIGURE 34: W ORKFORCE EXPERIENCE STRUCTURE ... 48
FIGURE 35: W ORKFORCE SIZING STRUCTURE... 48
FIGURE 36: WORKFORCE SIZE CONTROL STRUCTURE... 49
FIGURE 37: DISTRIBUTION OF EFFECTIVE WORKFORCE STRUCTURE ... 49
FIGURE 38: PROJECT SCHEDULE STRUCTURE ... 50
FIGURE 39: M ANAGEMENT RESERVE STRUCTURE... 51
FIGURE 40: DECISION RULE FOR MANAGEMENT RESERVE RELEASE... 52
FIGURE 41: SPO M ILITARY W ORKFORCE STRUCTURE ... 53
FIGURE 42: SPO CIVILIAN WORKFORCE SIZING INCLUDING CIVILIAN AUTHORIZATION... 54
FIGURE 43: COMPARISON OF REAL AND SIMULATED DATA ... 56
FIGURE 44: NON-LINEAR EFFECTS OF PROPORTIONAL VARIATIONS IN SCOPE AND DESIRED COMPLETION INTERVAL FOR DIFFERENT WORKFORCE LEARNING CURVES, NORMALIZED ACROSS SERIES... 58
FIGURE 45: NON-LINEAR EFFECTS OF PROPORTIONAL VARIATIONS IN SCOPE AND DESIRED COMPLETION INTERVAL FOR DIFFERENT WORKFORCE LEARNING CURVES, NORMALIZED WITHIN SERIES.... 58
FIGURE 46: CROSS SECTIONAL EFFECTS OF LEARNING CURVE VARIATIONS, TIME SERIES COMPARISON ... 59
FIGURE 47: WITHIN SERIES EFFECTS OF SCOPE VARIATIONS, TIME SERIES COMPARISON... 60
FIGURE 48: EFFECTS OF SCHEDULE COMPRESSION ON COST AND SCHEDULE SLIP TRENDS ... 63
FIGURE 49: TIME SERIES COMPARISON OF SCHEDULE COMPRESSION EFFECTS FOR BASELINE C O N FIG U RA TIO N ... 64
FIGURE 50: TIME SERIES COMPARISON OF SCHEDULE COMPRESSION EFFECTS WITH FASTER LEARNING C URVE T RAVERSAL... 65
FIGURE 51: TIME SERIES COMPARISON OF SCHEDULE COMPRESSION EFFECTS WITH HIRING OF MORE EXPERIENCED W ORKERS... 66
FIGURE 52: CROSS SECTIONAL COMPARISON OF LEARNING CURVE AND NEW WORKER EXPERIENCE E FFE C T S ... 6 7 FIGURE 53: EFFECTS OF FATIGUE AND OVERTIME ON PROJECT PERFORMANCE ... 69
FIGURE 54: EFFECTS OF FATIGUE AND OVERTIME ON WORKFORCE NUMBERS ... 70
FIGURE 55: EFFECTS OF PUNCTUATED HIGH WORKFORCE TURNOVER ON QUALITY AND PRODUCTIVITY... 72
FIGURE 56: EFFECTS OF PUNCTUATED HIGH WORKFORCE TURNOVER ON CONTRACTOR SCHEDULE, COST, A ND W ORKFORCE SIZE... 73
FIGURE 57: MANAGEMENT RESERVE EFFECTS ON COST AND SCHEDULE SLIP TRENDS ... 74
FIGURE 58: TIME SERIES COMPARISON FOR MIDDLE SCENARIO, MANAGEMENT RESERVE RELEASED ONLY AFTER 50 PERCENT COMPLETION ... 76
FIGURE 59: TIME SERIES COMPARISON FOR LATE SCENARIO, MANAGEMENT RESERVE RELEASED ONLY AFTER 75 PERCENT COMPLETION... 77
FIGURE 60: EFFECTS OF AVERAGE OFFICER TENURE ON COST AND SCHEDULE SLIP TRENDS... 79
FIGURE 61: TIME SERIES COMPARISON OF AVERAGE OFFICER TENURE EFFECTS FOR BASELINE C O N FIG U RA TIO N ... 80
FIGURE 62: CROSS SECTIONAL COMPARISON OF LEARNING CURVE AND INTERCONNECTIVITY EFFECTS O N S P O ... 8 1 FIGURE 63: CROSS SECTIONAL COMPARISON OF LEARNING CURVE AND INTERCONNECTIVITY EFFECTS ON C O N TR A C TO R ... 82
FIGURE 64: EFFECTS OF QUALITY AND GROSS PRODUCTIVITY ASSUMPTIONS ON COST ESTIMATE P R E C ISIO N ... 84
FIGURE 65: COST AND SCHEDULE SLIP TRENDS WITH SPO SIZE AND LEVEL OF EFFECTIVITY ON CONTRACTOR LATE PROGRAM PRODUCTIVITY ... 88
FIGURE 66: MODE TRANSFORMATION OF SPO QUALITY WITH INCREASING SPO PERSONNEL A LLO C A TIO N ... 89
FIGURE 67: EFFECTS ON CONTRACTOR EFFECTIVE PRODUCTIVITY OF INCREASING LEVELS OF CONTRACTOR DEPENDENCE ON SPO INPUTS NEAR PROJECT COMPLETION ... 89
FIGURE 68: EFFECT OF SPO PERSONNEL ALLOCATION ON ONSET OF HOLD-UP ... 90
FIGURE 69: FUNCTIONAL RELATIONSHIPS BETWEEN PROGRESS AND THE PROGRESS REQUIRED To SUPPORT THAT LEVEL OF PROGRESS... 91
FIGURE 70: EFFECTIVE PRODUCTIVITY RAMIFICATIONS OF DIFFERENT SPO REQUIRED PROGRESS F U N C TIO N S ... 9 2 FIGURE 71: SPO PERSONNEL PROFILES... 95
FIGURE 72: PROFILES OF FUNDING MADE AVAILABLE TO THE CONTRACTOR... 95 FIGURE 73: CONTRACTOR WORKFORCE TIME SERIES WITH CONSTANT SPO PERSONNEL AUTHORIZATION 96
FIGURE 74: CONTRACTOR WORKFORCE TIME SERIES WITH DECLINING SPO PERSONNEL
AUTHORIZATION...----... ---... 96
FIGURE 75: PROGRAM EFFECTS OF VARIATIONS IN AVAILABLE FUNDING PROFILE LEVELS ... 98
FIGURE 76: CONTRACTOR QUALITY AND EFFECTIVE PRODUCTIVITY ... 99
FIGURE 77: ACQUISITION COMMUNITY ORGANIZATION CHART... 115
FIGURE 78: JOHN NEVISON OVERTIME EFFECTIVENESS DATA COMPILATION... 116
FIGURE 79: CAUSAL LOOP DIAGRAM OF REWORK CYCLE ... 117
FIGURE 80: STOCK AND FLow DIAGRAM OF THE REWORK CYCLE ... 118
FIGURE 81: STOCK AND FLOW DIAGRAM NOTATION WITH EXAMPLE ... 118
1 INTRODUCTION
In a period of declining budgets, reductions in cost are seen as the means to maintain or even increase capability and profits, while in periods of rapid technological change, reductions in cycle time are viewed as
the means to reduce long term planning risk - predominately technological and ideological obsolescence. Because both budgetary limitations and rapid advances in technology are relevant concerns for advanced military aircraft development, this study looks at the interactions between an Air Force System Program Office (SPO) and the prime contractor for a major aircraft acquisition program.2 In particular, it investigates the effects of management decisions on cost and cycle time. Its purpose is to develop an improved understanding of the interactions between program coordination, human resource management, and initial estimates of project cost and size, and discusses the resultant effects on program performance. In particular, the effects of staffing policies, process quality, and management reserves are examined.
1.1
Background Information
The SPO and prime contractor operate beneath an organizational structure of over 50 government offices and agencies3 - each with input to the acquisition process. Figure 77 in the Appendix presents an
organizational chart showing positions of the SPO and contractor relative to other acquisition system participants.
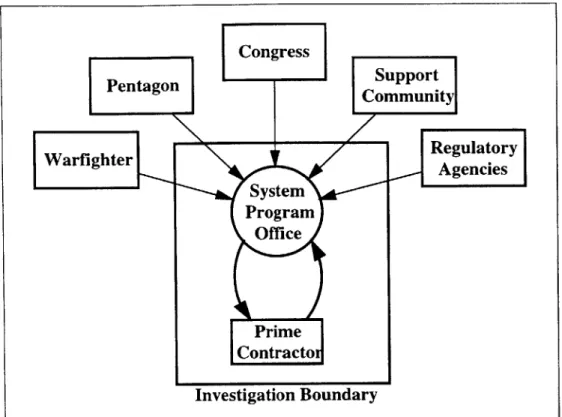
To understand clearly the factors affecting program performance it is important to distinguish between internal and external forces. Because the area of interest is the SPO-Contractor system, all influences external to that system4 are treated as exogenous.5 However, a brief review of some of the major external influences is necessary to provide an adequate context for the study. This is graphically depicted in Figure 1.
Throughout this work, I use the terms "prime contractor" and "contractor" interchangeably. The terms are intended to indicate an entity directly contracted by the SPO to perform a major function related to the completion of an acquisition program. This could include a major sub-system supplier.
2 An example would be the F-22 acquisition program.
3 Based upon the author's survey of U.S. Government World Wide Web sites that reported participation in
the acquisition process.
4 The current trend under IWSIM SPO is to move the support community into the SPO. However complete integration has yet to be realized as of this writing.
Figure 1: Study Boundaries and External Influences
1.1.1 The External Environment
The SPO and contractor are affected by the aggregate external influences of the United States Congress, the Pentagon, various government regulatory agencies,6 the warfighter,7 and support community.8
Congress controls the timing, number and procurement rate of new aircraft through the appropriation and budgeting process. Congressional support is determined by local politics, national politics, and budget considerations. The congressman asks: "Is it good for my constituents? Is it good for the country? Can we afford the program?" They also influence the performance requirements of the aircraft. Congress is never satisfied with parity, consistently demanding that U.S. weapons must be significantly better than the competition. Insufficient performance margin is grounds for cancellation or modification of an aircraft development program. [Franken]
Department of Defense (DOD) exercises control over programs through the budgeting process, where by program guidance and budgets are submitted to Congress, and through oversight and regulation of the services. Each service must defend the funds allocated to it; otherwise, the money goes into the DOD pool.
[Shields, McNutt] At the highest levels of the DOD, need and viability determine the value of a program. Is there a demonstrable need for the system given the prevailing national military strategy, is it technically feasible, and is it affordable? Of course, a program may have political and personal value as well - for example, the continuation of a program for an additional year to secure funds for a different project, or having one's name attached to the successful completion of a previously broken program. [Deutch] To
6 The General Accounting Office and General Services Administration are examples. 7 Unified Combatant Commands and Major Commands, the ultimate user of the aircraft.
8 Logistics and Systems (grouped together under Air Force Material Command) are responsible for maintenance and support of all Air Force systems.
focus on such behavior is to ignore the truth that the real tension between perceived need and available funding creates fertile ground for differences of opinion between well-intentioned individuals. Obviously, the DOD's push to shorten program cycle times and reduce acquisition costs has its source in this tension, with shorter cycle times seen a mechanism that will allow program completion before obsolescence. [McGrath]
An additional important source of funding variability is the levying of "taxes" by the Pentagon to pay for specific military operations.9 Such taxes result in a reduction in program funding for the given fiscal year within which they are levied and have a direct impact on available contractor funding and SPO operation and maintenance budgets. [Ruffkin, Watern, Rutley]
Unified Combatant Commands and Major Commands, the ultimate users of the aircraft, want the equipment to perform the given mission. Their influence is most important very early in the acquisition process during the initial requirements definition. However, during the design build and use phases, they represent a
source of modification and upgrade requests.
Because they are responsible for upgrades, the support community's influence is greatest after the system has become operational. However, as the significant operational cost advantage of designing for
sustainment has been recognized, such issues are being addressed in the earlier program phases, increasing the importance of the support community's input to the early design process.'0
Obviously, the various regulating agencies define the rules and regulations followed by the SPO and contractor, as well as providing independent program auditing.
One interesting and curious result of the acquisition regulations relates to program budget preparation. Because no money may be spent until a program is official; money to support the preparation of a project's budget must be pulled from the SPO's overhead funds pool. This can result in program budgets that are put together very quickly, sometimes the night before they are due. [Ruffkin, Watern]
To summarize, the aggregate influences, from these external agents, are potential changes in: defined program scope - revisions to program requirements having the net effect of increasing or
decreasing the program's official work definition."
programfunding period - the time period over which funds are made available for the program. funding profile - the amount and rate at which funds are disbursed to both contractor and SPO
1.1.2 The Contractor and System Program Office
The main functions of the SPO are contractor oversight and program coordination and integration.1 2 The oversight role is clear in principle - ensure contractor contract compliance. However, project scope, duration, and constituencies conspire, making the oversight process anything if not contentious. As discussed in the previous section, each constituent has a different set of priorities and different means to influence the process. In addition, the SPO's actual authority is limited to contract enforcement and day to
9 U.S. operations in Bosnia resulted in acquisition programs being charged a "Bosnia Tax."
1* The Lean Sustainment Research Project, a joint research project between Headquarters Air Force
Material Command (HQ AFMC/LG), Air Force ManTech, and MIT created in 1997, is indicative of the importance of this issue to the Air Force.
"1 This is in contrast to the actual effort that must be expended to complete the project. This will be address
in more detail in Section 3.1.3.
12 Contractor oversight, perhaps the most visible SPO function, becomes important only after the program is
day operational decisions - they have almost no authority.3 This suggests that the most important function of the SPO is program coordination. In its role as coordinator, the SPO acts as the communications interface between the disparate project constituencies and facilitates the integration process.
The SPO's functions demand a product focus - its ultimate purpose is building the aircraft the warfighter needs at a fair price. Thus while at higher levels of the acquisition system, a program's value is determined
by the capability it provides and the perceived need it fills, at the SPO level, value is determined by product
delivery, value to the taxpayer, and of course, value to the warfighter. [Rutley]
Several unique features of a SPO, which provide an important context for understanding its function and behavior must be mentioned. First, its maximum staff level is set every year by the Acquisition or Logistics Center responsible for the SPO.4 [Rutley] There is no formulaic way to size a SPO though, there have been past efforts to do so. [Sutton] It has a dual workforce, military and civilian, with different program tenures and career tracks. Finally, three distinct categories of funding for specific functions flow through the SPO: civilian workforce, operations and maintenance, and SPO administered. These result in important structural differences between the SPO and contractor.
Providing design, manufacturing, and integration services to the SPO, resulting in delivery of the desired aircraft, is the contractor's purpose. These contractors are typically large, widely held public corporations, with the ultimate requirement of providing shareholder value. This value is generated by only undertaking positive net present value projects.'5 If the company fails to follow this maxim, the investors will withdraw
their funds and the company will soon collapse. Obviously then the terms of any acquisition program must provide the contractor the potential of positive net present value. However, because aircraft design and manufacture requires large quantities of very specialized assets, both physical and human, diversification is not prevalent. This results in fierce competition between companies and as demand has dwindled, has lead to industry consolidation.'6 In a further effort to maintain shareholder value, the industry has begun to embrace lean production techniques, pioneered by Toyota'7 and later adopted by the United States auto industry, as a mechanism to reduce costs while at the same time to improve productivity and quality. This has brought a new understanding of the values of process consistency and innovation.,
In its most basic form, the acquisition process, as directly related to the contractor and SPO, begins with presentation of the initial desired requirements for the aircraft to the contractor - the request for proposal (RFP).'9 The requirements are then refined through discussions between the contractor and the SPO. With agreement reached on the requirements, contracts are written, entered, and money for design begins to flow. As the program progresses there are continued interactions between the contractor and SPO. For example, requirement changes are negotiated, oversight materials are prepared and transmitted, and various tests are
1 This depends to some extent on the rank of the SPO director. If the individual is of General officer rank, their decision authority increases. However, for things such as source selection and milestone approval,
decisions are made at the Pentagon level. [Rutley]
1 Air Logistics Center (ALC) or the Product Center [Rutley]
"5 The sum of the project cash flows, discounted by the opportunity cost of capital, should be greater than
zero. See Brealey, Richard. A. and Myers, Stewart. C., Principles of Corporate Finance, McGraw-Hill,
1996, Page 989
16 The number of major airframe manufacturers has been reduced from at least nine in the late 1970's to two in 1998. See: Distillation of the Defense Industry, Air Force Magazine, July 1998, Pages 54-59.
* See: Ohno, Taiichi, Toyota Production System: Beyond Large-Scale Production, Productivity Press, Portland OR, 1988
18 See: Kandebo, Stanley W. and Scott, William C., Lean Aerospace Manufacturing, Aviation Week &
Space Technology, McGraw-Hill, July 28, 1997, Pages 56-66
19 Of course, this is ignoring the contractor's efforts to direct the acquisition planning process before the
RFP is issued.
coordinated and conducted. Work continues until the program is either completed or cancelled. With cost,2 0 schedule,2 1 and aircraft performance used as the metrics of program success.
Interactions between the contractor and SPO fall into two broad transactional categories: material and information exchanges, the salient characteristics of which are the transaction's opportuneness2 2 and quality
- providing the required product on time. Consider the history of the C-17 program which demonstrates the complexity of the SPO-contractor relationship, as well as how deficiencies in these characteristics can reverberate through the SPO-contractor system and the resulting implications for cost and schedule.
On October 1, 1992, a C-17 static test article "flying" at 32,100 feet and weighing 585,000 pounds was hit with a simulated strong wind gust. As the wings bent to handle the stress, a symmetrical crack occurred on the upper wing skin between fuel access doors on both wings. Later calculations determined the wing had failed in conditions
representing only 128 percent of the load requirement. The contract requires the plane's wings to be able to withstand 150 percent of the load requirement.
Specialists from McDonnell Douglas and the Air Force pored over test data and the static article itself to determine what had gone wrong. They concluded the root causes were a computational error by the McDonnell Douglas engineers who designed the wing, optimistic design assumptions, and a high and uneven distribution of the test pads on the wing.
Program officials tended to downplay the gravity of the wing failure and contended that it would require only $ 50 million to fix the static article and incorporate a fix on the production line aircraft. Congressional officials, skeptical of that estimate, expect the total cost ultimately will be higher.
McDonnell Douglas test official Ned Newman said the company is almost finished with repairs on the static article. The solution appears to be a fairly modest technical chore of bolstering isolated areas of the wing with "stiffeners." This change, like many others, will add weight -- another 744 pounds. GAO claims the effect of the computational error is being seen in other areas of the wing and fuselage.
Here an error made during the initial aircraft design remained undetected for over 10 years2 4. Furthermore, while the design error remained undiscovered, it generated additional errors in work that relied on the original design. The C- 17 demonstrates two important characteristics of complex system design: mistakes can remain undiscovered for significant periods and a single error can propagate throughout the system. The first order effect of the C-17 wing design error was the wing structure had to be redesigned. However, the "fix" increased the weight of the already over-weight aircraft, requiring structural modifications in other parts of the aircraft and spurred additional effort to reduce the aircraft's total weight. This increased the
20 Cost non-performance is called an overun, defined as the incremental increase in real cost over the
official cost estimates.
21 Schedule non-performance is referred to as schedule slip, the incremental increase in time required to
achieve any particular program milestone.
22 In this context, opportuneness is progress relative to required progress. For example, near the end of a
program, the contractor may require SPO certification of a particular modification. If the SPO has not completed the work required to make a determination about the modification within the expected time interval, it has not made sufficient progress relative to that required.
23 Lynch, David J., Despite The Problems, The Air Force Still Believes This Is The Airlifter Of The Future,
Air Force Magazine, July, 1993 Page 34-37. 24 Preliminary design for the C-17 began in 1981.
effort required to complete the project - beyond the initial estimates. As a result, the contractor's costs were increased through additional wages and fixed costs because the increased level of effort required increasing the effective workforce2 5 and slipping the schedule. Moreover, because the contractor is bared from including the correction of unanticipated errors in the initial scope definition, these costs augmented the aircraft's budget over-run.
Unanticipated errors by the contractor can affect the SPO as well. The flight test plan for the aircraft is a prime example.
The first few C-17s arrived at Edwards requiring additional work before they were ready for full-scale operations. Then, persistent fuel leaks slowed progress. Finally, McDonnell Douglas found itself well behind schedule -- the result, perhaps, of what Air Force officials now call an overly ambitious test plan.
The original schedule, drafted by McDonnell Douglas and approved by the Air Force, called for a ninety-one percent efficiency rate in the testing, with an average of thirty-three flight hours per aircraft per month. The General Accounting Office maintains that the actual figures have been forty-seven percent efficiency and twenty-nine hours per aircraft per month.
McDonnell Douglas was to finish C-17 testing by January 1994. The GAO, which recently conducted a critical review of the program, claims that the program is likely to be nineteen months late. The Air Force projects a fifteen-month slip.
Since delivery to the test site, the C-17s have spent more than one-third of their time in "work programs to perform maintenance, complete deferred work, fix problems such as fuel leaks, and correct other aircraft design and system problems," according to GAO.26
Here, the contractor did not expect the aircraft to spend one-third of the test program under repair and thus underestimated the time required for the flight test program. The SPO working from the contractor's inputs evaluated and approved the program. However, the test program could not be executed according to plan because the amount of rework had been underestimated, causing the development program to slip. This underscores another important characteristic of complex development programs - partner interdependency
amplifies the effects of error propagation. The C-17 shows that undiscovered contractor errors can induce errors by the SPO. Of course, the reverse is also true, and both have cost and schedule implications, directly increasing cost and schedule slip through rework of the errors.
One last example illustrates the complexity of aircraft development programs and hints at the intimate relationship between workforce management and program performance.
McDonnell Douglas officials vigorously dispute the GAO testimony, insisting they have made the necessary investments [needed to improve production and the aircraft's design]. Likewise, the company disputes the office's figures showing that the amount of work being redone because of failure to do it right the first time has been holding steady at close to forty percent. McDonnell Douglas figures show such so-called rework declining on each new plane.
25 This is accomplished by adding more workers, working existing employees overtime, or both. 26 Ibid Footnote 23.
GAO disputes this. It claims that, if one uses another measure of production efficiency,
McDonnell Douglas had its worst month to date in January -- completing just twenty-six cents of planned work for each dollar spent. McDonnell Douglas says the GAO numbers are based on outdated contract work plans.
Both sides agree on one thing: The C-17 program has been hurt by constant and increasing labor turnover. Because the aircraft program shares McDonnell Douglas's Long Beach facility with the company's commercial jet assembly lines, workers laid off from the MD- 11 and MD-80 passenger jet programs can exercise union seniority rights to claim jobs on the C-17 line. This has led to constant churning. Up to one-third of the company's 10,000 C-17 workers came into the program last year. Up to one-half of the work force will be replaced this year.
This illustrates the connection between high levels of rework and high workforce turnover. When a worker from the passenger jet program claimed a job on the C-17 line, he or she displaced a skilled worker already familiar with its procedures and idiosyncrasies. This reduced the productivity and quality of the workforce. For the new worker to attain the same level of skill and productivity as the displaced worker required training and experience. Naturally, the new workers were trained by the remaining experience workers, causing a further reduction in productivity. Finally, until the new workers had traversed the learning curve, their error rates were higher than normal, increasing the amount of rework. In essence, the workforce never moves up the learning curve.
Aside from presenting the connection between workforce turnover and rework, it is a prime example of how a distant, seemingly unrelated management decisions can create problems - the poor performance of a McDonnell Douglas's commercial business helped degrade its military contract performance because of a labor contract.
While the forgoing examples were specific to the C-17 program, the problems they portray are
characteristic of aircraft development programs in general and serve to illustrate the complexity of the SPO-contractor relationship. Rare is the program that delivers the desired aircraft on time and on budget. It is for just this reason that the study of the SPO-contractor system is important.
1.2
Research And Study Methodology
Undoubtedly, the causes of aircraft development program cost, and schedule under-performance are varied, complex, and interrelated. Consequently, this study employs a methodology that facilitates the investigation
of such complex phenomenon. System dynamics or industrial dynamics are terms frequently applied to the quantitative analysis of organizations using continuous time series simulation.
Industrial dynamics models are built on the same information and evidence used for the manager's usual mental model of the management process. The power of industrial dynamics models does not come from access to better information than the manager has. Their power lies in their ability to use more of the same information and to portray more usefully its implications.2 8
A concise understanding of the implications of a management decision, allows the development of global
solutions, mitigating the tendency of local optimizations to provide less than optimum system performance - unintended consequences.
In its most analytic form, the system dynamics methodology provides a convenient tool for manipulating large numbers of integral equations -the explicit rendering of a system's structure and management's decision making processes in mathematical terms. The methodology is especially useful when the equations constitute a high-order system of interconnected multiple feedback-loop structures with nonlinear
relationships. The number of integral equations required to describe a system determines the order of that system. Feedback loops are cause and effect relationships which are recursive in nature and can be either goal-divergent or goal-seeking. Although some feedback relationships are proportional, many are nonlinear. The combination of these characteristics defines a complex system,29 and their interplay causes
dynamically complex behavior.
Using system dynamics as a tool to analyze research and development project performance is rooted in the works of Roberts,30 Cooper,31 and Lyneis. This study, as an extension of their work applied to the SPO-contractor system during a new aircraft development program, affords a novel perspective on the aircraft acquisition program performance.
The classic project model structure was adapted to reflect the unique structures of the SPO-contractor system through extensive discussions with system experts and participants.3 3
Following the work of Lyneis34
and Sterman3 5
on the interaction between development system partners, SPO-contractor quality and productivity interactions were modeled.
28 Forrester, Jay W. Industrial Dynamics. Portland OR, Productivity Press, 1961, Page 117. 29Forrester, J. W. (1969), Urban Dynamics, pp. 107-114.
30
Roberts, Edward, B., The Dynamics of Research and Development, Harper & Row, New York, 1964 31 Cooper, Kenneth G., Naval Ship Production: A Claim Settled And a Framework Built, Interfaces, Vol.
10, No. 6, December 1980, Pages 20-36.
Cooper, Kenneth G., THE $2,000 HOUR: How Managers Influence Project Performance Through the
Rework Cycle, Project Management Journal, Vol. XXV, No.1, March 1994
32 Lyneis, James M. Corporate Planning and Policy Design. Portland OR: Productivity Press, 1980 3 A listing of all individuals consulted in this capacity is found in the Reference Section.
34 Lyneis, James M. Course Lecture Notes, 15.976: Project Management, MIT, Fall 1997.
3s Sterman, John D., et al, Unanticipated Side Effects Of Successful Quality Programs: Exploring a
Paradox of Organizational Improvement, MIT Sloan School of Management, Cambridge MA 02142,
March 1994, Revised August 1994, D-4390-1.
Although cost and cycle time are inextricably linked and thus can not be studied in isolation, previous studies have not looked at the SPO-contractor system in such terms, but rather have tended to focus on cost or cycle time, separately. By utilizing a system dynamics approach, their intimate relationship can be captured and analyzed. By making explicit the system's causal structure and simulating its behavior under the governing decision rules, greater insight into the causes of aircraft development program performance is obtainable than through the use of more traditional modeling techniques.36
In the next section, the basics of the classical project model are introduced. Armed with the insights it provides, the contractor and SPO models are then presented in Section 3. Analysis and conclusions
naturally follow.
36 Regression models or financial models are examples.
2
THE BASIC PROJECT MODEL
This section introduces the basic project model structure37, 38 and discusses the essential, project
management insights applicable to aerospace development projects derived therefrom.39 It also serves as an introduction to both contractor and SPO models, providing a core from which to understand their structure and behavior.
2.1
The Rework Cycle
The central element of a project model is the rework cycle. It captures the truths that some portion of the effort expended on any project is spent redoing work previously thought to be complete and that this "rework" may lay undiscovered for a significant fraction of the project's duration. Figure 2 is a
representation of the rework cycle. The five factors that govern the cycle's behavior are: the initial amount of work," workforce productivity, average work quality, and the time required to discover rework. It is important to recognize that not all parts of the rework cycle are easily visible to project managers: Work to
be Done, Perceived progress, Productivity and Apparent progress rate are the most accessible. Of course,
the other parameters can be estimated, but to do so requires effort and an intimate understanding of the flow of work around the cycle.
An analogy can be drawn between the rework cycle and a hydraulic system. In Figure 2 the rectangular boxes can be thought of as reservoirs interconnected by pipes with valves or pumps in various locations -represented by the hourglass shaped symbols. To start, all the reservoirs are empty except Work to be
Done, which is full. In this analog, the goal of a project is pumping the tasks from the Work to be Done
reservoir to the Real Progress reservoir. Workforce Productivity is the pump, which pushes the tasks through the system. Quality controls two valves, diverting the task flow partly to the desired destination,
Real Progress, but also to the Undiscovered Rework reservoir. The level in the Undiscovered Rework
reservoir builds, increasing pressure on the Discovering Rework valve. The flow through this valve is determined by reservoir level and rework detection time, with its outflow rate increasing with increased
Undiscovered Rework level and reduced Time to detect rework. Once through the valve, the rework flows
back into the Work to be Done reservoir - to be pumped around again and again, until the Work to be Done reservoir is empty. How the rework cycle functions in the context of a development project is described next.
37 Section 8.3 in the Appendix provides the essential elements required to read the stock and flow diagrams used to describe the structures presented in this and following sections.
38 This basic project model borrows heavily from one developed by James M. Lyneis as part of System and Project Management, 15.962, a class he co-taught in the Fall of 1997 at the Massachusetts Institute of Technology. A complete listing of the equations for this model may be found in the Appendix, Section 8.4.
39 Many of these insights are presented in Cooper's compelling analysis of project mismanagement: Cooper, Kenneth G., The $2,000 Hour: How Managers Influence Project Performance Through the
Rework Cycle, Project Management Journal, vol. XXV, No.1, March 1994
40 For simplicity, in this example the project's size is assumed to be known from its initiation and constant
for its duration. However, relaxation of this assumption does not alter the important dynamics.
Productivity
Figure 2: Fundamental Elements of the Rework Cycle
Starting with the known set of tasks required to complete the project, work begins. As the workforce completes tasks, some of their work will contribute to the finished product - real progress - but some tasks will need to be repeated because the work contains undiscovered errors.41 This collection of tasks, with yet to be detected defects, is undiscovered rework. However, because it can not be distinguished from real progress, both contribute to the project's perceived progress.
As shown in Figure 2 the factor that directs the flow of completed tasks is quality. Essentially, it is the fraction of tasks, at any given time, which are completed with no defects. Determined by the aggregate product of workforce skill, process influences, and other factors, the notion of quality is central to the project model and will be discussed in detail in Section 2.2. Of course, managers have long known that quality was important, what then distinguishes the rework cycle from other project models?
The crucial insight of the rework cycle is that rework is not discovered immediately, but remains hidden for some period - often a significant fraction of the time allotted for the project - and requires additional work to reveal its existence.4 2
Once discovered, the rework flows back to the list of tasks that must be completed,
41 A deliberately iterative design process can be thought of as a series of small projects, one for each
iteration. The sum of real progress and undiscovered rework of the first project would determine the
work to be done of the second and so on. Work would not beginning on the second until sufficient perceived progress had been made on the first. Obviously, errors that remain undetected in the first
iteration would create errors in the second. This perspective provides two insights. First, defining a process as iterative is an official recognition of rework. In essence there is admission that a task or set of tasks will need to be repeated several times to "get it right." Second, rework can become
institutionalized, a crutch to support poor design practice. The distinction between the two is a focus on continuous process improvement.
42 An example would be the discovery of cracks in the C-17's wing during loads testing, which required the
wing to be redesigned. In this case design was begun in 1981 and the rework was not discovered until the Fall of 1992.
Time to detect rework
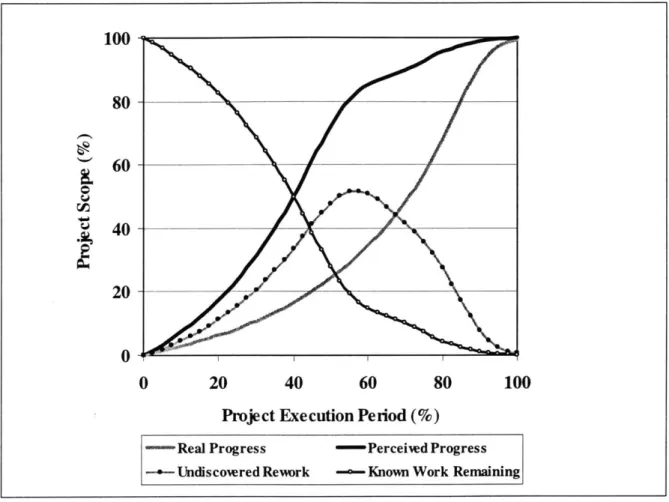
increasing the total effort which must be expended to bring the project to completion. Of course, any rework that remaining undiscovered before the project is delivered would be defects in the finished product. It is the delay between rework creation and discovery, which creates the familiar pattern of project progress: initially progress appears satisfactory, but then begins to slow or even go backward during the latter stages. [Milauskas] Figure 3 demonstrates how undiscovered rework, invisible to the project manager, builds. It also shows that the perceived slow down in progress is just that, perceived. Real progress has been increasing steadily and does so until near the end of the project, when the remaining work to do is predominately newly discovered rework. What has happened is that the rework discovery rate becomes a significant fraction of the apparent progress rate - rework is being discovered almost as fast as the
workforce can produce. To the casual observer it appears that huge amounts of effort, and therefor money, are being spent and yet little progress is being made.43
100
-80
i
60
.
0W
40-20
0
0
20
40
60
80
100
Project Execution Period (%)
- Real Progress - Perceiwd Progress
-e- Undiscowred Rework - Known Work Remaining
Figure 3: A Typical Pattern of Project Progress
Figure 4 is a typical time series for the time required to discover rework. Initially, the period is high and relatively constant because so little is known about the design that rework discovery is practically
impossible. However, as the project begins to coalesce, and real progress is made, rework discovery time begins to decline. Toward the end of a project, the nature of the tasks changes to work for which mistakes are easier to find, for example from structural design and analysis to writing certification documentation.
43 The typical response is to increase the effective size of the workforce by hiring or increasing overtime. This will be examined in more detail in Section 3.1.5.
100-80
94
60
40
E20
0-0
20
40
60
80
100
Project Execution Period (%)
Rework Discovery Time Normalized to Project Execution Period
Figure 4: A Typical Time to Discover Rework Time Series as a Function of Project Execution Period The effects on the growth of undiscovered rework resulting from increasing or decreasing the time required to discover rework are compared in Figure 5. It indicates that decreasing the time to discover rework, reduces the buildup of undiscovered rework. This also tends to reduce schedule slip because the slower than expected progress rate is detected earlier causing a slight increase in the initial workforce buildup.
However, care must be taken in jumping to the conclusion that shorter is always better. In the early stages of a program, when the design is in flux, obsolescence can flush rework from the system. Effort is saved by not fixing errors in designs that will be abandoned. However, because early errors in the final design have tremendous cost, quality, and schedule leverage over the rest of the program, it is important to discover these errors early.44'45 This is but one of the seeming contradictions which make program management so
46
complex.
"Roskam, Jan, Airplane Design: Part VIII: Airplane Cost Estimation: Design, Development,
Manufacturing And Operation, Roskam Aviation and Engineering Corp., Ottawa, KS 1990, Page 10 45 McMasters, John H., Commercial Aircraft Design And Systems Engineering, Engineering Division
Summer Internship Training Program Manual, Boeing Commercial Aircraft Group, Aerodynamics Engineering, August 1994
46 A partial solution to this contradiction is better human resource management, which will be discussed in
Section 4.1.
0 I-i 0 ri~ 0
100
80
60
40
20
0
0
20
40
60
80
100
Project Execution Period (%)
Rework Discovery Time Normalized to Project Execution Period
100
0 "0 ~I. 0 "080
60
40
20
0
0
20
40
60
80
100
Project Execution Period (%)
-- Baseline -- 150% of Baseline -A-50% of Baseline
Rework Normalized to Project Scope4 7
Figure 5: Effect of Time Required to Discover Rework on Buildup of Undiscovered Rework
47 For the run, 150% of Baseline, the time to detect rework calculated by the model was multiplied by 1.5.
Similarly, for the 50% of Baseline run, a multiple of 0.5 was used. Differences in program execution period are responsible for the seeming contradiction in the top graph where the ratio of 150% of Baseline
to Baseline is only 1.36. The Baseline program execution period was 38 months, while the 150% and
50% runs had execution periods of 42 and 33 months respectively.
2.2
Quality
Quality
in the context of the rework cycle is the fraction of any completed task, which will never need to be reworked.48 Shown in Figure 2, quality is one of the prime determinates of program performance. If quality and scope are assumed constant over the course of the project, the total effort required to complete the project can be shown to be the quotient of scope and quality.49 Conversely, if the total project effort isknown relative to the actual project scope, the project's average quality may be estimated. Figure 6 aggregates data on average project quality derived by Pugh-Roberts Associates/PA Consulting Group for development projects ranging from aerospace to large construction. Note that one rework cycle is equal to the project's scope. Thus for example, if quality equals 0.5, the total effort is two hundred percent of the expected value and number of rework cycles is one.
Figure 6: Typical Values Of Quality In Development Projects5 0
While the average project quality is a good indication of aggregate performance, it is important to recognize that quality is not constant over the life of a project. The utilized processes, workforce skill, and other
factors, in particular the quality of previous work determine, its value. Of course, the extent to which past quality affects the present quality is a function of the complexity of the system being developed.
48 Cooper, Kenneth G., The Rework Cycle: Benchmarks For The Project Manager, Project Management
Journal, Number 1, Volume XXIV, March 1993, Project Management Institute, Drexel Hill, PA
49 Total Effort = Scope (I + (1-q) + (1-q)2 + (1-q)3 + ---+ (1-q)") where q = Quality
Multiplying through by (1-q) and subtracting from the first equation, for 0 q I and n -+ -o, gives:
q(Total Effort) = Scope or: Total Effort = Scope/q 50 This graph is copied from the reference in Footnote 48.
10 - _ _ _ _ _ _ _ _ _ _ _ _ _ _ _ 4- Aerospace
9
-
8-6lectronic6
Systems 5 - Large4
_Construction---3
2 -1S - oftae 0-0 -0.1 -0.2 -0.3 -0.4
0.5
0.6 0.7 0.8 0.9
Average Project Quality
Figure 7 shows four of the more important factors that affect quality.5' Process potential quality is
determined by the existing processes - the optimal quality that can be achieved with a skilled workforce using the given tools and methods. The goal of quality improvement techniques, such as the Toyota Production System, is to increase this variable's value. Because the minimum possible project effort is determined by the maximum process quality, the desirability of implementing Lean practices is underscored.52 In practice, intervening factors prevent the achievement of any process's full potential.
Average workforce experience Average time for
worker to attain potential quality
Workforce fraction of experience required to attain potential quality
Real Progress
(
Un-Discovered ReworkAverage Work Quality
/,<effect of past quality on present quality f> <quality learning curve
Average workforce fraction of potential quality Process potential quality Quali Effect of work quality on quality Effect of schedule )pressure on quality
Figure 7: Four Determinates Of Quality Over Time
One reason why full process quality is seldom obtained is an under-skilled workforce, which degrades the basic process performance to something often far less than its potential. Because it takes training and experience to become proficient, the shape and duration of the learning curve are paramount in determining the level of quality over the course of the project. For example, during the initial staff-up the influx of novice workers drags down quality as they learn the processes used on the project. A typical response of quality to workforce changes can be seen in Figure 8. The initial precipitous drop in quality is the direct result of introducing inexperienced workers onto the project, both directly through average workforce experience and indirectly through the feedback effect of past work quality on present quality.
51 Quality is modeled as the product of the input variables. See Equation 47 in the Appendix, Section 8.4.5. 52 For example, if process quality is 0.75 the minimum effort required to complete the project will be 130%
1
0.8-Maximum Potential Quality
S0.6
CV 0.4
-0.2
-
0-0
0.2
0.4
0.6
0.8
1
Project Execution Period (%)
Figure 8: Example Of Project Quality Over Time
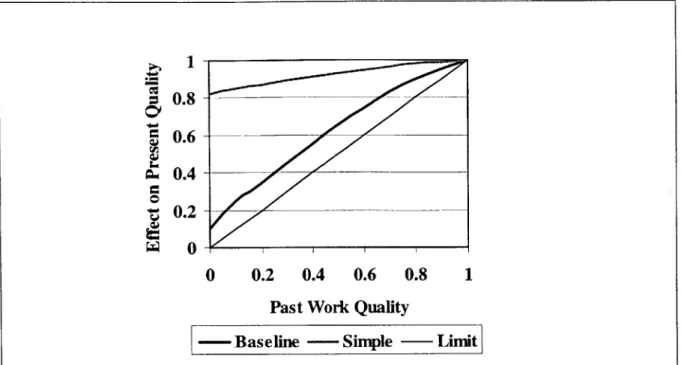
Crucial to the understanding of project quality, the effect of past quality on present quality captures error propagation through the project and is reflective of system complexity. It also suggests that a system design that carefully manages component interfaces would have tremendous cost leverage by containing error propagation.5 3
, 54
Figure 9 depicts several possible functional relationships reflecting different levels of system complexity. For example, using the "Limit" curve, if past work quality is 80% then current quality is reduced by 20% - quality that would have been 0.75 is instead 0.60. If a function were to lie below the "Limit" curve the project would never be completed as the value of quality would converge to zero. For the system in this section, the "Baseline" curve was used. The quality on quality effect exacerbates the initial drop in the quality triggered by unskilled new hires.
In Figure 8, approximately half way through the project, the tide of new workers begins to ebb and quality begins to improve. However, rushing to meet schedule thwarts the gains in quality that result from
increasing experience. Under pressure to meet a deadline, even a highly skilled worker's error rate will go up. This is the effect of schedule pressure on quality. It is particularly acute at the very end of the project and responsible for quality's final down turn.
" Suh, Nam P. Principles of Design, Oxford University Press, New York, 1990
1-a 0.8
0.6
0.4
S0
0
0.2
0.4
0.6
0.8
1
Past Work Quality
- Baseline - Simple - Limit
Figure 9: Example Functional Relationships For The Effect Of Past Work Quality On Present Quality
To complete this section on quality, Figure 10 presents project duration trends for constant values of potential process quality and varying rework discovery times. It serves to reinforce the benefits of intrinsically high quality, transparent processes that allows the production of a minimum number of mistakes, and the early discovery of those that slip through.
160
140-0.50
120-100 0.75
80
-0.9560-
40-40
60
80
100
120
140
160
Rework Discovery
Time
(%)
Time and Duration Normailzed to Baseline Potential Process Quality Values of 0.50, 0.75, and 0.95Figure 10: Process Quality Isolines