Does the Siting of Neighborhood Incarceral Facilities Influence Local Police Behavior? By
Sarah H. Edgar
SB in Urban Studies and Planning Massachusetts Institute of Technology
Cambridge, MA (2019)
Submitted to the Department of Urban Studies and Planning in partial fulfillment of the requirements for the degree of
Master in City Planning at the
MASSACHUSETTS INSTITUTE OF TECHNOLOGY May 2020
© 2020 Sarah H. Edgar. All Rights Reserved
The author here by grants to MIT the permission to reproduce and to distribute publicly paper and electronic copies of the thesis document in whole or in part in any medium now known or hereafter created.
Author _________________________________________________________________ Department of Urban Studies and Planning
May 18, 2020 Certified by _____________________________________________________________
Professor Amy Glasmeier Department of Urban Studies and Planning Thesis Supervisor
Accepted by _____________________________________________________________ Ceasar McDowell Professor of the Practice Chair, MCP Committee Department of Urban Studies and Planning
Does the Siting of Neighborhood Incarceral Facilities Influence Local Police Behavior? by
Sarah H. Edgar
Submitted to the Department of Urban Studies and Planning on May 18, 2020 in partial fulfillment of the requirements
for the degree of Master in City Planning
ABSTRACT
This research studies NYPD Stop and Frisk data from before and after the reopening of the Brooklyn Detention Complex in 2012 to determine whether the introduction of carceral facilities to a neighborhood changes policing habits in the area. This research hopes to aid in wider
discussions of devolution as a means for decarceration by answering an important question about the impacts of neighborhood siting. Though the research was inspired by the policy decision to close Riker’s Island facilities in New York, the question of devolution is not limited to one city. Ultimately the research aims to help U.S. organizations and political officials interested in carceral devolution to better understand possible ramifications of neighborhood facilities. The main methodology for this research is quantitative analysis of pre-existing data applied to the natural experiment of the reopening of a neighborhood carceral facility. The NYPD publically hosts datasets for its “Stop, Question, and Frisk” program from 2003-2018 on the nyc.gov website. Within that timeframe, the Brooklyn Detention Complex reopened after years of inactivity. Methods focus on time disparity and difference in difference comparisons. The time from disparity and distance from facility are used as independent variables to form a gradient approach to analysis. Dependent and grouping variables describe characteristics of police behavior, including the number of stops, frequency of use of force, and race of persons stopped.
I hypothesize that police behavior will become more aggressive near carceral facilities immediately after opening, in the form of a greater number of stops and arrests and a higher propensity toward using force. I also hypothesize an increase in the racial bias of these
behaviors. Ultimately, I find few changes in police behavior apart from a consistent increase in officer use of force localized to the precinct home to the facility.
Thesis Supervisor: Amy Glasmeier
INTRODUCTION
New York City has recently made the decision to close its controversial Riker’s Island incarceral facilities. In replacement, the city plans to rely on four borough based jails and decrease capacity overall (DiPrinzio, 2018). This example is part of the wider debate over the use of prison devolution as a tool for decarceration on a greater scale.
The decarceration movement advocates for public policy that reduces the number of incarceral facilities as well as the total population of both incarcerated persons and persons under government supervision, such as those on probation or parole. In this context, prison devolution refers to a shift from larger federal, state, or city wide facilities to smaller capacity, local city or neighborhood-based facilities. Proponents of devolution argue that such facilities are closer to the homes and families of the incarcerated and improve visitor access. Supporters of devolution and decarceration generally agree on the ills of mass incarceration and the U.S. criminal justice system. However, some abolitionists are opposed to devolution, arguing that building new facilities cannot be consistent with a wider goal of decarceration. This “No New Jails Movement” contends that what is needed is a radical overhaul of the criminal justice system (“Background,” n.d.). Those in favor of devolution contest that radical change will take time and political capacity and that in the interim prison and justice reform can serve as a powerful tool for protecting the rights and wellbeing of detainees.
Even outside of the devolution debate, the siting of jail and prison facilities can be controversial and often hotly contested, especially by those who live near prospective sites. NIMBY, or Not In My BackYard, arguments against local siting tend to focus on negative narratives about the incarcerated and crime (DiPrinzio, 2018). Existing literature shows that incarceral geographies and populations influence local public narratives about crime, detainees, and criminal justice practices. While police are a government institution in the U.S., individual police officers are generally part of the community in which they serve. Even if officers are not residents, they may at least be influenced by that community and take on some of its narratives. Furthermore, there exists a wealth of research in the field of environmental criminology that argues that police behavior may be affected by perceptions of neighborhood as much as the identity or behavior of suspects (Crawford, 2018). This has been shown in a number of studies both qualitatively and quantitatively. However, these studies consider neighborhood character largely through demographic data and crime rates. I propose that local institutions may also play
a role in defining perception. I therefore question whether the siting of incarceral facilities impacts policing behavior nearby.
In this thesis, I use NYPD data from its “Stop, Question, and Frisk” program to measure geographic changes to police behavior before and after the reopening of the Brooklyn Detention Complex in 2012. I attempt to determine whether the introduction of such a facility changes policing habits in the area so that readers can better understand potential community concerns about local carceral development which may help improve planning for decarceration and devolution. To do this, I ask the following question: does the quantity or character of police activity in a U.S. neighborhood change following the introduction of a new carceral facility?
Given the existing literature on social narratives constructed around police practice, prison geographies, and neighborhoods, I hypothesize that police behavior will become more aggressive in neighborhoods near carceral facilities immediately following their opening, and specifically that there will be a greater number of stops and arrests and a higher propensity toward using force. Additionally, I hypothesize an increase in the racial bias of the
aforementioned behaviors due to social narratives about race and crime and existing disparities in the incarcerated population. Ultimately I find no such changes in behavior with the exception of an increase in officer use of force localized to the precinct home to the facility.
This research hopes to aid in wider discussions of devolution as a means for
decarceration by answering an important question about the impacts of neighborhood siting. Though the research was inspired by the policy decision to close Riker’s Island facilities in New York, the question of devolution is not limited to one city. Ultimately the research aims to help organizations and political officials interested in ending mass incarceration in the United States to better understand a fuller scope of ramifications of one possible method for doing so which is popular in the current narrative.
LITERATURE THEORY
There is a wealth of sociological literature surrounding the way neighborhoods may shape
social narrative and vice versa, much of it centered around issues of race and class (Garrioch & Peel, 2006). Such narratives can also extend to public perception of crime and the incarcerated, especially as they often intersect with narratives of race and class. Bonds argues in “Discipline and Devolution: Constructions of Poverty, Race, and Criminality in the Politics of Rural Prison
Development” that mass incarceration has often replaced social welfare policy such that perceptions of the poor and perceptions of crime are linked and both are conflated with race (Bonds, 2009).
Similarly, in “Narratives of Crime and Criminals: How Places Socially Construct the Crime Problem,” Leverentz compares perception of criminals in two different neighborhoods of Boston with high crime rates. Residents of one of the neighborhoods generally had more punitive values whereas residents of the other had more faith in redeemability. She links some of this discrepancy to differences in racial makeup of the neighborhoods and to racial narratives of crime and ex-offenders (Leverentz, 2012). This research may help to inform how public narratives may be impacted by the presence of a jail or prison and how those narratives may impact policing practices.
There is also a wealth of literature regarding how public narratives may influence police practice. Many in the field of policing believe in theories of environmental criminology wherein geographic location plays a large role in the prevalence of crime. Some argue that location may be as strong a predictor of crime as the identity of the perpetrator (Crawford, 2018). One of the more important studies in the field of ecological criminology is the 1967 paper by Werthman and Piliavin, “Gang members and the police.” The authors found that negative police perceptions of youths were often set simply by virtue of the neighborhood wherein that individual lived. The authors termed this phenomenon “ecological contamination” (Werthman & Piliavin, 1967).
A 2003 paper by Terrill and Reisig supports Werthman and Piliavin’s findings by showing that officers are statistically more likely to use force on individuals in “disadvantaged” or high-crime neighborhoods. These results maintained even when controlling for suspect behavior and other elements. The authors also found that controlling for neighborhood reduced the effect of the suspect’s race suggesting that neighborhood character plays a role in police bias beyond segregation.
With respect to public perception, there is research that supports their conclusion while also accounting for some effects of race. In his 1999 paper Weitzer found disparities in reported police interactions along the basis of neighborhood economic class. He also found what he termed a “safe haven effect” and “racial halo effect” (Weitzer, 1999, p.843). In the former, race played a larger role in police behavior for Black interviewees outside of Black neighborhoods.
Conversely, in the latter, White interviewees were less likely to report negative interactions even outside of majority White neighborhoods.
There are a number of theories that may support a hypothesis that opening a carceral facility could change police behavior in a neighborhood. For example, in one common method of crime prevention, the aim is not necessarily to lower crime rates but to enforce neighborhood norms. Such a goal instills in officers a suspicion of ‘strangers’ to the neighborhood (Crawford, 2018). As such, officers may disproportionally stop ‘strangers’ for ‘suspicious’ behavior given that their presence is defined as in-and-of itself more suspicious. Opening a new institution that draws visitors will necessarily create an influx of ‘strangers’. Furthermore, in conjunction with Weitzer’s “racial halo effect” we might expect a disproportionate number of these stops to go toward people of color.
Conversely, some have argued that perception of a neighborhood as more ‘criminal’ may lead to under-policing. The claim is that when police view a victim as themselves ‘criminal’ or otherwise more ‘deserving’, they may be slower to pursue the perpetrator(s) (Lersch in
Crawford, 2018).
Crawford notes that police may hold personal biases that lead them to view ‘minority spaces’ as inherently more dangerous. He also argues that similar biases in the public may lead citizens to issue more complaints to police departments and creating bureaucratic pressure to institute policies of neighborhood bias. Similarly, a disparity in arrest rates for persons of color will influence the demographics of the facility population and its visitors. If this results in the site of the facility being perceived as ‘minority space’ it therefore stands to reason that it may change police behavior.
Discussions of bias in police behavior often become weighted down by debates over the importance of proving biased intent versus impact. Coleman et al. argue in their article,
“Rethinking the ‘Gold Standard’ of Racial Profiling: §287(g), Secure Communities and Racially Discrepant Police Power,” that racial profiling can be difficult for social scientists to prove. Furthermore, they claim that by focusing on efforts to prove racial profiling has occurred, scientists are neglecting serious issues of “racially discrepant” policing. While racial profiling has often judicially been defined to include racist intent on the part of the police, the broader scope of racially discrepant action by police is harmful even when unintentional, they argue (Coleman et al., 2019).
In my specific context of New York City in the 21st century, a 2019 report by the NYCLU on New York’s Stop, Question, and Frisk program shows evidence of racial bias in policing (NYCLU, 2019). The report found that while the overall number of stops had been reduced by 98%, there was still a significant racial bias in the program. The majority of stops (81%) during this time period are of Black and Latino men. Furthermore, the report also found that Black and Latino men are more likely to be frisked, to be found weaponless when frisked, to experience use of force by officers, and to be innocent. The second and fourth concerns, when in conjunction with the higher rates of stops and frisks for Black and Latino men, suggest a racial bias among officers conducting stops that cannot be explained by neighborhood segregation and disparate crime rates. In fact, even in the precincts with the smallest Black and Latino
populations, Black and Latino residents made up the majority of total stops.
LITERATURE METHODS
For “Narratives of Crime and Criminals” Leverentz used interviews and observation to determine how community narratives about crime may be tied to place and neighborhood (Leverentz, 2012). Werthman and Piliavin’s, “Gang members and the police” used similar qualitative measures in the form of observations of and interviews with patrol officers in San Francisco and Oakland, California to establish their theory of “ecological contamination” (Werthman & Piliavin, 1967). In a complement to their work, Weitzer’s 1999 paper interviewed residents from several Washington, DC neighborhoods about their past experiences with and perceptions of police (Weitzer, 1999).
In their 2003 paper Terrill and Reisig departed from these more qualitative studies by using statistical analysis of incidents of police use of force. They also made use of statistical controls such as neighborhood, suspect race and behavior, and other elements of interactions. As in previous studies, the research made use of observations of and interviews with officers; however, the authors also examined census demographic data and police crime records. The study added statistical evidence to what had been a largely qualitative field (Terrill & Reisig, 2003).
The 2019 report by the New York Civil Liberties Union on New York’s Stop, Question, and Frisk (SQF) program is perhaps the most important methodological influence to this thesis (NYCLU, 2019). The report used the same SQF datasets provided by the New York Police
Department on all recorded stops between 2014 and 2017. It used data from the year 2011, the program’s peak and the subject of NYCLU’s prior research, as a benchmark for analysis. Stops were compared on a precinct-by-precinct basis in terms of both the total quantity of stops and frisks – two separate activities – and the proportion of stops that fall into relevant categories. These categories include: reported reasons for stop, race of persons stopped and/or frisked, rate of weapon recovery from frisks (the stated legal purpose of frisking), use of force, and innocence of person stopped and/or frisked. The latter three categories are also broken down by race.
The NYCLU report also provides important context critical to determining a time frame for analysis. For example, the report shows that the possible value entries for the field ‘reason stopped’ changed substantially in 2017 and may not be easily comparable with earlier years. Finally, the NYCLU report makes use of a precinct-based approach. Of note, the precinct home to the Brooklyn Detention Complex, pct. 84, is among the precincts with the highest number of stops and is ranked third overall in reported stops when normalized by resident population, though it should be noted that stops fall by nearly four fifths after 2014.
In general, the above studies make use of a neighborhood comparison approach to study, wherein the presence of a studied “treatment” differs between the neighborhoods allowing for measuring of the treatment’s effects. With large enough sample sizes or factors controlling for other disparities between the neighborhoods unrelated to the treatment, the effects may be determined. Smaller studies with limited comparison points may need to use different strategies.
A difference in difference model is often used in research of “natural” experiments wherein a treatment occurred for non-research purposes. In such studies there is often no ideal control group whose circumstances are identical to the treatment group apart from not receiving the treatment. For this reason treatment and non-treatment groups are compared both before and after a “time disparity”, or the time at which treatment began. Differences between groups during the period prior to disparity are used to establish a baseline difference. The differences between groups post disparity are then compared to this baseline difference to determine the effect of the treatment (Wing, 2018). This will be the primary method of analysis employed in this thesis.
CONTEXT
Building off the sociological theories of public narrative as well as quantitative analysis of neighborhood impacts of prison siting, I wish to examine a potential impact of prison siting I believe has been under-examined. There is a wealth of sociological theory linking racial bias to the criminal justice system within the U.S., one such example being in the form of racial profiling. There is a similar wealth of research showing that public narratives and police
perceptions of neighborhood impact police practice within those neighborhoods. However, most existing research of neighborhood bias in policing characterizes neighborhoods by demographics such as race and class. I intend to expand upon this research by considering the impact of a specific institution, namely, carceral facilities.
This study also differs from existing research in that, while most use a neighborhood comparison approach to study, I make use of the time disparity of the facility reopening to construct a difference in difference model of the impacts in a single surrounding area. This helps to isolate the impacts of the facility reopening, as there is a smaller risk of additional
discrepancies between neighborhoods confusing the results.
By connecting the theory that public narratives of race and the incarcerated are impacted by incarceral geographies with the theories of racial bias in criminal justice and neighborhood bias in policing I construct a theory that incarceral geographies may create a cycle of racial narratives and profiling. This stems from two existing theories: “ecological contamination” and the policing of “strangers” to a neighborhood. In the first, we might expect the opening of a facility to change police perceptions of the neighborhood, “contaminating” their perceptions of anyone in it. In the second, we might expect the facility to increase the number of non-residents near the facility, either leaving detention themselves or visiting a client, partner, friend, or family member in detention, and therefore increasing the rate at which police make stops.
In this respect NIMBY campaigns toward carceral devolution may not be simply about narratives regarding the incarcerated, but how those narratives could influence policing to change perception of current residents. Determining the extent to which this conception of incarceral geographies and policing is accurate, may therefore be critical to conversations about devolution. This research is expected to be most applicable to such conversations in contexts of urban neighborhoods with average crime rates. High crime, low income, and minority
less room for additional “contamination”. Conversely, suburban, wealthy, and White
neighborhoods may find more of a “stranger” effect resulting in less change for policing of the residents.
This research hopes to aid in wider discussions of devolution as a means for
decarceration by answering an important question about the impacts of neighborhood siting. Though the research was inspired by the policy decision to close Riker’s Island facilities in New York, the question of devolution is not limited to one city. Ultimately the research aims to help organizations and political officials interested in ending mass incarceration in the United States to better understand a fuller scope of ramifications of one possible method for doing so which is popular in the current narrative.
In this thesis I study NYPD Stop and Frisk data from before and after the reopening of the Brooklyn Detention Complex to determine whether the introduction of carceral facilities to a neighborhood changes policing habits in the area in order to inform community concerns about local carceral development and help improve planning for decarceration and devolution.
Based on the prevailing literature regarding social narratives constructed around prison geographies and neighborhoods, as well as the NYCLU’s findings of racial bias within NYPD stops, my hypothesis is that police behavior will become more aggressive in neighborhoods near carceral facilities immediately following their opening, or in this case reopening. More
specifically, I hypothesize that there will be a greater number of stops and arrests, a higher rate of ‘innocence’ among persons stopped, and a higher propensity toward use of force by officers. Additionally, I hypothesize an increase in the racial bias of the aforementioned behaviors due to social narratives about race and crime and existing disparities in the incarcerated population.
METHODS
As the aim of this research is to prove potential impacts on police behavior and not any potential bias in intention on the part of officers, the methodology focuses primarily on changes to measurable practices rather than interviews or other qualitative measures.
The main methodology for this research is quantitative analysis of pre-existing data using the natural experiment of a reopened carceral facility. The New York Police Department
publically hosts datasets for the “Stop, Question, and Frisk” (SQF) program from 2003-2018 on the nyc.gov website. It is possible that data provided by the NYPD may not reflect an unbiased
depiction of policy behavior; however, this research hopes only to show how behavior may change as a result of facility siting rather than the full scope of police action. Furthermore, if this research does show changes to police behavior that may negatively depict the NYPD, a bias in favor of police as recorders of the data can only suggest an equal or stronger impact than found.
The data was subset to the years 2006-2016 in order to avoid data management issues caused by changes to record keeping by the NYPD. Within that timeframe, specifically in February of 2012, the Brooklyn Detention Complex reopened after years of inactivity, providing a disparity for analysis. It is true that this facility is not truly “new” to the neighborhood and that neighborhood perceptions from its earlier operations may linger. However, the Complex had not been active for nearly a decade, allowing time to establish a new neighborhood baseline. Proof of a neighborhood shift in attitude lies in the public backlash that met announcements of plans to reopen the facility (Bergson, 2011). Given the limited number of carceral facilities that opened during the time period of the SQF datasets, the reopening of the Brooklyn Detention Complex was selected as the best case for this analysis.
I make use of the time disparity of the facility reopening to construct a difference in difference model of the impacts in a single surrounding area. This helps to isolate the impacts of the studied treatment from other neighborhood disparities in policing. In analysis, timeframes are often further subset to the years 2011-2012 or 2010-2013. Because the time disparity occurs early in 2012, limiting the data to the year directly before and directly after reopening allows for a closer examination of possible changes to trends. Since many of the trends observed lasted for approximately two-years, a two-year bracket around the disparity also provided useful insight. This is especially true as declines in total numbers of persons stopped reach a point in 2014 and 2015 such that outliers in the limited data often obscure larger trends.
Over the course of the time frame analyzed the number of daily stops decreased. In latter years there were many days with absolutely no stops in range. For this reason a regular aggregate average was needed to compare trends over time. Weekly averages often suffered from the same issues as daily ones. Annual averages would be unlikely to show anything but the longest scale changes, such as the decrease in stops over time, and would likely hide any changes to behavior resulting from reopening the facility. Monthly averages and counts were therefore used as the primary method of time analysis.
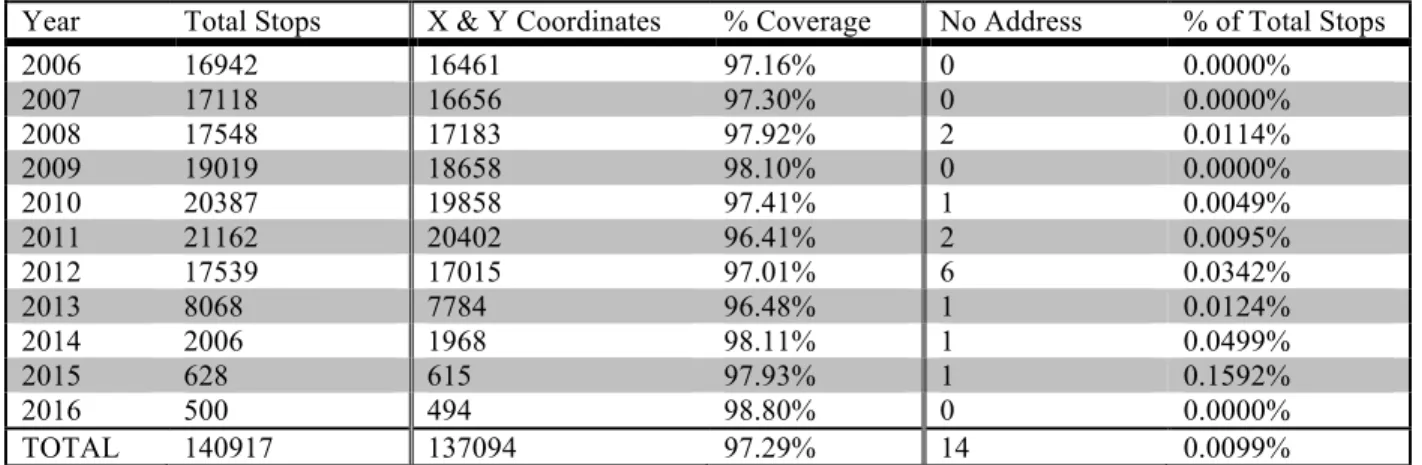
Ta b le 2 – Fi el d D es cr ip ti on s Va lu es 2006 - 2016 76, 78, 84, 88 0 - 2000 M – ma le , F – fe m al e, Z Un kn own A – As ia n/ P ac if ic I sl an de r, B – Bl ac k, I – Am er ic an I nd ia n/ Al as ka n Na ti ve , P – Bl ac k-Hi sp an ic , Q – Wh it e-Hi sp an ic , U – Un kn own , W – Wh it e, Z Ot he r 0 - no, 1 - ye s 0 - no, 1 - ye s 0 - no, 1 - ye s 0 - no, 1 - ye s 0 - no, 1 - ye s 0 - 9 Da ta T yp e Nu m er ic YYYY -MM -DD Nu m er ic Nu m er ic Ch ar ac te r Ch ar ac te r Bo ol ea n Bo ol ea n Bo ol ea n Bo ol ea n Bo ol ea n Nu m er ic De sc ri pt io n In w ha t y ea r di d th e st op o cc ur? On wh at d ay d id th e st op o cc ur ? In w ha t p ol ic e pre ci nc t d id th e st op o cc ur? Wh at w as th e di st an ce o f th is s to p fr om th e B ro ok ly n De te nt io n C om pl ex in m et er s? Wh at w as th e se x of th e pe rs on s to pp ed a s id en ti fi ed b y th e o ff ic er ? Wh at w as th e ra ce o f th e pe rs on st op pe d as id en ti fi ed b y th e o ff ic er ? Di d a fr is k oc cu r? Di d a se ar ch o cc ur ? Di d a fr is k or s ea rc h di sc ov er c on tr ab an d or we ap on s? Di d th e st op d is co ve r co nt ra ba nd o r we ap on s or ot he rw is e re sul t i n fur the r ac ti on? Wa s an y ki nd o f ph ys ic al f or ce u se d by th e of fi ce r? Co un t o f ty pe s of f or ce u se d by th e of fi ce r. Fi el d ye ar da te st op pc t di st anc e se x ra ce fr is ke d se ar ch ed se ar ch _su cc ess st op _su cc ess of fi ce r_f or ce of _c ount X a nd Y c oor di na te s gi ve n for the va st m aj or it y of s tops a re f or the “ N ew Y or k-L ong Is la nd S ta te P la ne C oor di na te S ys te m ” (E P S G -2908) . C oor di na te s ar e gi ve n for a ppr oxi m at el y 97% of s tops a nd no le ss tha n 96% of s tops f or a ny one ye ar (T abl e 1) . A ppr oxi m at el y 0. 001% of s tops r ec or de d no addr es s da ta . T he r em ai ni ng st ops di d re cor d unc le an addr es s da ta , but no
coordinates, and these stops were dropped from the dataset for ease of analysis given that they were few in number and evenly distributed across the four nearby precincts.
After SQF files were cleaned and subset in order to reduce computational processing needs, the data was geolocated through QGIS, a desktop geographic information system. Using the detention center address, a distance matrix was created for all stops to create a field with the distance in meters of each stop from the facility. Data was then further subset within a two- kilometer buffer from the facility. The two-kilometer radius was chosen to ensure that there were some areas far enough from the facility that its reopening wouldn’t impact police perceptions of the neighborhood. Data was limited to the two-kilometer radius both to simplify analysis and to better reflect the neighborhoods indicated on the NYPD precinct maps and NYC Neighborhood Maps hosted on the nyc.gov website.
When evaluating racial disparities in the SQF program I have created three additional categories aggregating stops of separate records of racial groups. These include aggregations of stops of persons identified as persons of color or non-White and Hispanic persons, stops of Black and Black-Hispanic identified persons, and stops of Black- and White-Hispanic persons.
I have created a number of fields aggregating variables from the existing datasets. These aggregated variables were chosen to allow for easier analysis of the data. All variables
aggregated were initially Boolean and recorded as ‘Y’ or ‘N’. Variable names and values were consistent across all datasets within the timeframe used (2006-2016).
The 2019 NYCLU Report evaluates the merit of stops based on the stopped persons
“innocence”. Based on this report, I have created two fields for measuring “innocence”. I have labeled these similar fields as search- and stop- “success” to reflect that individuals are presumed innocent until proven guilty in a court of law. Use of the word “success” is intended to reflect whether or not the “Stop, Question, and Frisk” program was effective in achieving its goals in that specific stop. A stop wherein the officer did not discover any weapons or contraband and from which no further action was taken, could in this way be considered an unsuccessful and therefore unnecessary stop. The first, “search_success”, is a Boolean variable representing whether frisks and/or searches found any contraband or weapons on the person stopped. The second, “stop_success”, is a Boolean variable representing whether further action was taken (e.g. an arrest made or summons issued) as well as the results of “search_success”.
Table 3 – Aggregation Tables
search_success
Subfield Description Data Type
contrabn WAS CONTRABAND FOUND ON SUSPECT ? Boolean
pistol WAS A PISTOL FOUND ON SUSPECT ? Boolean
riflshot WAS A RIFLE FOUND ON SUSPECT ? Boolean
asltweap WAS AN ASSAULT WEAPON FOUND ON SUSPECT ? Boolean
knifcuti WAS A KNIFE OR CUTTING INSTRUMENT FOUND ON SUSPECT ? Boolean
machgun WAS A MACHINE GUN FOUND ON SUSPECT ? Boolean
othrweap WAS ANOTHER TYPE OF WEAPON FOUND ON SUSPECT Boolean
stop_success
Subfield Description Data Type
arstmade WAS AN ARREST MADE ? Boolean
sumissue WAS A SUMMONS ISSUED ? Boolean
search_success DID A FRISK OR SEARCH DISCOVER CONTRABAND OR WEAPONS? Boolean officer_force
Subfield Description Data Type
pf_hands PHYSICAL FORCE USED BY OFFICER - HANDS Boolean
pf_wall PHYSICAL FORCE USED BY OFFICER - SUSPECT AGAINST WALL Boolean pf_grnd PHYSICAL FORCE USED BY OFFICER - SUSPECT ON GROUND Boolean pf_drwep PHYSICAL FORCE USED BY OFFICER - WEAPON DRAWN Boolean pf_ptwep PHYSICAL FORCE USED BY OFFICER - WEAPON POINTED Boolean
pf_baton PHYSICAL FORCE USED BY OFFICER - BATON Boolean
pf_hcuff PHYSICAL FORCE USED BY OFFICER - HANDCUFFS Boolean
pf_pepsp PHYSICAL FORCE USED BY OFFICER - PEPPER SPRAY Boolean
pf_other PHYSICAL FORCE USED BY OFFICER - OTHER Boolean
The 2019 NYCLU Report evaluates the merit of stops based on the stopped persons “innocence”. Based on this report, I have created two fields for measuring “innocence”. I have labeled these similar fields as search- and stop- “success” to reflect that individuals are presumed innocent until proven guilty in a court of law. Use of the word “success” is intended to reflect whether or not the “Stop, Question, and Frisk” program was effective in achieving its goals in that specific stop. A stop wherein the officer did not discover any weapons or contraband and from which no further action was taken, could in this way be considered an unsuccessful and therefore unnecessary stop. The first, “search_success”, is a Boolean variable representing whether frisks and/or searches found any contraband or weapons on the person stopped. The
second, “stop_success”, is a Boolean variable representing whether further action was taken (e.g. an arrest made or summons issued) as well as the results of “search_success”.
I have also created two fields for evaluating officer use of force. The first,
“officer_force”, is a Boolean variable representing whether any type of force was used by an officer during the stop. The variable “wepfound” is only present for the 2006 file and was suspected to be an aggregation of other values in the dataset. This was proven by creating such an aggregation and comparing the two for a match. Variables aggregated into “wepfound” include: “pistol”, “riflshot”, “asltweap”, “knifcuti”, “machgun”, and “othrweap”. For this reason “wepfound” was excluded from the aggregation. The second created officer force variable, “of_count”, is a numeric count of the distinct types of force used during a stop (i.e. a count of the Boolean ‘Y’s of the subfields.
Methods of analysis focus on time disparity and difference in difference comparisons. Using the reopening of the facility as the “disparity” we can compare trends in behavior pre- and post- reopening. By separately considering the trends of different groups within the data, such as neighborhood, we can compare the changes to trends for each group pre- and post- reopening, thus isolating treatments effects from pre-existing group or neighborhood disparities. If the reopening of the facility does change perceptions, then proximity to the facility should have some relation to police behavior, but only once the facility has reopened. Any relation
preexisting the reopening would represent some sort of neighborhood baseline. In turn, if that relation (slope, etc.) changes (or deviates from how it has been changing) specifically around the time disparity when the facility reopens, then there may be a case. Accordingly, distance from the facility and time are used as the primary independent variables to form a gradient approach to analysis. Dependent variables are intended to describe characteristics of police activity and behavior, such as the number of stops, frequency of use of force, and race of persons stopped. The bulk of the findings are based on graphical analysis as well as geographic maps of the data. There is also some statistical analysis.
ANALYSIS
A number of elements of stop behavior remain consistent regardless of the status of the facility. Police stop and frisk locations were often clustered around transit stops. For example, in Figure 1, in the first third of the data there is one particular and consistent outlier for the number
of stops at a given distance. By examining data as from the 300-400m range, three possible sources for this outlier were identified: the first spike ~318m at the intersection of Schermerhorn St. and Hoyt St., the second ~338m at Willoughby St. and Jay St., and the third ~350m at Bergen St. and Smith St. The first is the site of a subway station. The latter two are the site of two and one bus stations respectively. Based on observation utilizing Google Maps data, proximity to transit stops is the most logical cause for the discrepancy.
If police conduct more stops at transit locations, we may expect that an increased number of persons around transit stops will lead to more stops overall. Reopening the facility may result in increased use of those stops as formerly incarceration persons leave the facility or attorneys, family, friends, and partners visit currently incarcerated persons. Furthermore, many of those individuals may be “strangers” to the neighborhood and thus more likely to be stopped. In this way, increased visitation to the stops may have been a factor in changes to behavior post-reopening without any changes to policy or intention on the part of police. Yet, we do not find
2014 2015 2016 2010 2011 2012 2013 2006 2007 2008 2009 0 500 1000 1500 2000 0 500 1000 1500 2000 0 500 1000 1500 2000 0 500 1000 1500 2000 0 300 600 900 1200 0 300 600 900 1200 0 300 600 900 1200
Distance From Facility (m)
Number of Stops
evidence supporting this conclusion.
Regardless of time, location, or controls, stops of persons from which no further action proceeded and no weapons or contraband were found far outnumbered those that did. This finding is consistent with that of the NYCLU in 2019. Furthermore, there was no significant difference between “successful” and “unsuccessful” stops in the monthly average distance of stops relative to the facility both before and after reopening (Figure 2). There is a brief period immediately prior to reopening for which average distance of “unsuccessful” stops is lower, but such periods of discrepancy in either direction are not unprecedented and do not suggest
characteristics of behavior.
As I have defined success to mean that weapons or contraband were found or that further action, such as an arrest, took place, we would expect changes to the success rate to indicate that police were more or less likely to stop someone based on the same evidence or that the
“criminality” of the average person changed. A lack of geographic changes to “success” indicates that police did not change their behavior in deciding when to stop someone based on proximity to the facility and that the relative criminality of persons did not change in proximity to the facility.
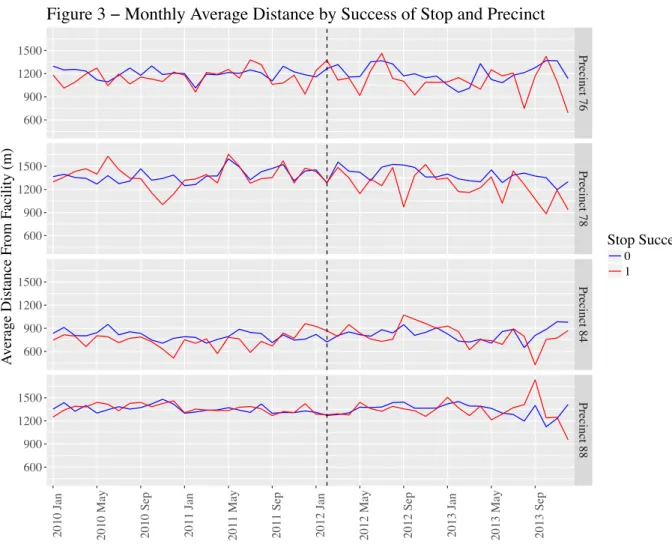
It is important to check whether findings remain when controlling for the precinct in which the stop occurred as different police precincts may have different policies or different policy changes due to their different administrators. In this case, the above findings about the relation of distance to “success” held when broken down by precinct (Figure 3), with the possible exception of Precinct 78 for which “successful stops” had a consistently lower average distance in the two years after opening. However, the difference in distance is slight and is more likely the result of coincidence than not. Distances were shorter in Precinct 84 than all others both before and after reopening as it houses the facility. Opposite to Precinct 78, average distances of “successful” stops were consistently lower in 84 for two years prior to opening, which may indicate treatment effect. In other words, in the precinct home to the facility, police may have been less likely to stop persons based on the same evidence closer to the facility, or persons near the facility may have been more “criminal” in the period post-reopening. As in Precinct 78, however, these differences are slight and may be coincidence. There is not enough evidence to draw conclusions.
after opening for stops where police conducted a frisk or for stops where police conducted a search (Figures 4 & 5). We can conclude then that police were not more likely to frisk or search someone near the facility post-reopening. These findings were also preserved when controlling for precinct (Figures 6 & 7).
There was also no noticeable difference in the monthly average distance before and after reopening when controlling for sex (Figure 8). On average, stops of female identified persons were consistently closer to the facility, but only slightly and this finding remained consistent across time periods. In the months immediately surrounding reopening stops of female identified persons were more markedly closer to the facility than others. It is possible that police were more likely to stop women near the facility as women were otherwise stopped at low rates and may have been more impacted by an “ecological contamination” theory. However, such periods are not inconsistent with the data any may be coincidence. Stops of persons of “unknown” sex were likewise consistently further from the facility. Given that few records of such persons are recorded month to month, and outliers are thus easily able to influence averages, it would be difficult to draw conclusions. It is most likely that geographic bias in sex of person stopped occurred after reopening.
There were no noticeable changes to monthly average difference immediately before and after reopening when controlling for race. Beginning approximately one year after reopening, there is a two-year period in which stops of White persons are, on average, consistently farther from the facility than those of non-White persons, despite this not being the case in earlier years (Figure 9). This trend holds for comparisons of stops for White persons and stops of Black and/or Hispanic persons specifically (Figure 10).
It is possible that such trends are the result of coincidence or of an additional factor in neighborhood policing. Alternatively, it may be the result of demographic shift in the
neighborhood in the time post-reopening. As the trend only lasts two years, does not occur immediately after reopening, and does not coincide with time periods of later findings, it cannot be definitively attributed to our treatment effect of facility reopening. In general, race did not appear to be a significant factor in the average distance of a stop from the facility either pre- or post-reopening. This suggests that race of persons stopped was not geographically impacted by the facility reopening.
facility was in use of officer force. In Figure 11 we can see that for approximately two years immediately after opening the monthly average distance from the facility of stops wherein force was used was between 50m and 200m less than that of forceless stops. Such consistently large discrepancies are observable nowhere else in the decade examined by this study. This suggests that after reopening officers were more likely to use force during stops nearer the facility. Further support for this conclusion can be found in the fact that the distance variable is more correlated with the variable for officer force than other behavior variables such as whether or not the stopped person was frisked (Table 5). This means that there is a stronger, and negative,
relationship between distance and force than distance and other behaviors, though it does not say whether that relationship is causal or coincidental. This finding is also notable as, while use of force is somewhat correlated with whether a stopped person was frisked or searched, those factors were not as strongly correlated with distance. This means that there is something about officer force specifically that is related to distance. Such consistently large discrepancies are
750 1000 1250 1500 1750
2006 Jan 2006 May 2006 Sep 2007 Jan 2007 May 2007 Sep 2008 Jan 2008 May 2008 Sep 2009 Jan 2009 May 2009 Sep 2010 Jan 2010 May 2010 Sep 2011 Jan 2011 May 2011 Sep 2012 Jan 2012 May 2012 Sep 2013 Jan 2013 May 2013 Sep 2014 Jan 2014 May 2014 Sep 2015 Jan 2015 May 2015 Sep 2016 Jan 2016 May 2016 Sep
A
verage Distance From F
acility (m)
Officer Force 0
1
observable nowhere else in the decade examined by this study.
The rate at which force was used during stops does not show significant change during this two-year interval post-reopening when calculated for the entire studied area (Figure 12). Neither does the monthly average count of types of force used in forceful stops (Figure 13). These two findings, in conjunction with the earlier result, suggest that overall behavior regarding the use of force did not change in this time period and that difference in forceful versus forceless stops is a geographic change specifically. Such a conclusion is further supported in Figure 14 by mapping the rate at which force was used in each of eight 250m concentric rings surrounding the facility. In the two years prior to reopening rates were lowest directly outside the facility and at a middle distance. In contrast, during the two years post-reopening rates were lowest in the farthest rings and significantly higher within a 500m radius from the facility. We can see, therefore that the rate at which force was used increased near the facility post-reopening. The 500m radius is significant as it includes the transit stops at which a large number of stops were made throughout the decade studied, and as we might expect a large number of visitors to the facility to travel through those stops.
Insofar as proximity to the reopened facility is impacting officer use of force, it largely appears to factor into the initial decision to use force. When breaking results down by number of counts of officer force per stop, no noticeable difference in average distance from the facility can be seen for stops with 1-3 counts of force either pre- or post-reopening (Figure 15). In other words, a stop wherein three separate counts of force were recorded was no closer on average than one where only one count of force was recorded. For stops with 4 counts of force, average distance from the facility is consistently smaller post-reopening. However, such stops are sparse in the dataset and even more so after SQF’s peak in 2011, making this result inconclusive and, more likely than not, the result of chance.
One possible explanation for the change in force behavior could be that police made fewer stops near the facility post-reopening, focusing on only the most “necessary” of stops and thus increasing the likelihood that officers would need to use force in that area. By breaking down the monthly number of stops in each of four 500m concentric rings surrounding the facility we see that while the number of stops as a whole decreased following its 2011 peak, none of the rings decreases in a manner inconsistent with the others or with its own past behavior (Figure 16). That is to say, the number of stops decreased at similar rates in each 500m ring of increasing distance from the facility.
Furthermore, in a more gradient analysis, proximity to the facility may have had a positive impact on the number of stops made after reopening. When using a difference in difference analysis to calculate treatment effects, as described in the methods, the effects of proximity post-reopening on number of persons stopped were positive when the proximity dummy variable was set for distances less than 1kilometer and negative for larger distances (Table 6). In terms of magnitude, the effects were strongest at shorter distances and weakest at farther distances. In other words, when stops within a 1km radius were compared to stops outside that radius before and after the facility reopened, the treatment (being within 1km of an open carceral facility) was associated with police making a much greater number of stops. Conversely, being within 1.5km of an open carceral facility was associated with police making slightly fewer stops. The analysis for distances less than 1km suggests that proximity is in fact positively correlated with the number of stops when using a difference in difference time disparity analysis. That is to say that police were more likely to make stops nearby an open carceral facility.
from police bias, the difference in average distance of forceful and forceless stops is the result of an increased presence near the facility of individuals who act out during stops, leading to an increased use of force in that area. For this to be true, we would expect to see a change in “success” rates near the facility, or higher rates of arrests and/or of finding weapons or contraband on persons stopped.
Overall, the rise and fall of success rates of stops was moderately consistent before and after opening (Figure 17). Rates decline throughout 2011 and rise for much of 2012 before dropping again and continuing to oscillate. It is possible that fewer stops in the area could have lead to the increasing “success” rate in 2012, but given that this rate is substantially lower in 2013 than in 2010 despite the significant fall in number of stops in 2013 when compared with 2010, such a conclusion is unlikely.
Comparing geographic “success rates” we can find additional evidence against this
rationale. Were we to believe that reopening the facility would attract more violent persons in the form of visitors, thus creating this change in officer force behavior, we might expect to see
increased “success” rates near the facility and especially near local transit stops. In Figure 18 by mapping “success” rates in each of eight 250m concentric rings we see that post-reopening rates are highest at a middle distance from the facility and often low or at their lowest nearer the facility. In fact, the 250m – 500m ring showed the greatest decrease in “success” rates from 2011 to 2012. This ring, as established, is home to a number of transit stops around which stops cluster. The low success rates in these areas suggest that the change was only to officer force behavior, not to the behavior or characteristics of persons in the area.
Most conclusively, in Figure 19 when we control for stop “success”, the 50-200m difference in average distances of forceful and forceless stops still appears. The presence of this pattern in stops of innocent persons suggests a geographic bias in police behavior. Furthermore, the trend appears to be slightly stronger for forceless stops than forceful ones. This weaker trend may support conclusions that the characteristics and behavior of local persons may not be as correlated as police bias in geographic disparities of use of force.
Unsuccessful Stops
Successful Stops
2010 Jan 2010 May 2010 Sep 2011 Jan 2011 May 2011 Sep 2012 Jan 2012 May 2012 Sep 2013 Jan 2013 May 2013 Sep
800 900 1000 1100 1200 1300 800 900 1000 1100 1200 1300 A
verage Distance From F
acility (m)
Officer Force 0
1
The difference in average distances of forceful and forceless stops post-reopening is preserved when the results are broken down by identified sex of the person stopped (Figure 20). The trend is strongest for male identified persons and appears for over two years after the facility reopened. In fact, the effect may have been stronger among male identified persons, as the difference in average distance was roughly 50-250m in range. This is somewhat intuitive given the higher incarceration rates for male-identified persons. The trend was less strong for stops of female identified persons, and at times in the two-year period, the average distance of forceful stops exceeded that of forceless stops. However, there are significantly fewer instances of stops of female identified persons and the data may be more easily skewed by outliers. Though the trend does also appear for stops of persons whose sex was identified as “unknown”, very few such stops were recorded and conclusions cannot be drawn.
This finding is similarly preserved when results are broken down by identified race of persons stopped (Figure 21). The trend is not present or less evident for some races with fewer recorded stops, namely: “Asian/Pacific Islander”, “American Indian/Alaskan Native”, and “Other”. However, because relatively few of these stops were recorded, their data may be more easily skewed by outliers and no definitive conclusions can therefore be drawn about their trends (Figure 22). For stops of White, Black, and Hispanic identified persons the change in force behavior appears for the same two year time period. Similarly to the results for male identified persons, the effect may have been stronger when controlling for race. For stops of persons identified as White or Hispanic the difference in average distances at times exceeded 200m. The difference was also most consistent month to month for persons identified as Black. The
difference was, conversely, least consistent for persons identified as “Black-Hispanic”.
Comparatively fewer of these records exist, though still more than of the races that did not show the trend, and therefore the data may still be more subject to outliers.
The difference in average distances of forceful and forceless stops post-reopening is not preserved, however, when the results are broken down by precinct in Figure 23. Though the average distances differ for each precinct, they do not show differences for forceful and forceless stops within each precinct. It should be noted that the average distances over time appear
smoother for Precinct 84 as that precinct is home to the facility and thus recorded more stops within range, decreasing the impacts of outliers. Because the location of police precincts plays an obvious role in distance from a particular point, it is important to examine stop rates and rates of
use of force on a precinct level to better understand the role that precincts play in this behavior change.
It has been remarked earlier in this thesis that following the peak of the SQF program in 2011, the number of persons stopped began to decline. When limited to those stops within a two-kilometer range of the facility, monthly counts of stops fell at different times and rates for the four nearby precincts (Figure 24). Prior to falling, Precinct 78 consistently had the fewest stops in range. Precinct 88 often had the most. The two precincts closest to the facility, Precincts 76 and 84, were generally fairly consistent with one another, though Precinct 76 typically had slightly fewer stops in range than Precinct 84, which houses the facility. In the year prior to reopening, the two precincts diverged as the number of stops by Precinct 76 dropped off slightly and the number of stops by Precinct 84 continued to rise becoming more consistent with Precinct 88. The numbers of stops in range by Precincts 76 and 78 did not begin to fall consistently until mid-2013. The numbers of stops in range for Precincts 84 and 88 began falling early in 2012
Precinct 76
Precinct 78
Precinct 84
Precinct 88
2010 Jan 2010 May 2010 Sep 2011 Jan 2011 May 2011 Sep 2012 Jan 2012 May 2012 Sep 2013 Jan 2013 May 2013 Sep
750 1000 1250 1500 1750 750 1000 1250 1500 1750 750 1000 1250 1500 1750 750 1000 1250 1500 1750 A
verage Distance From F
acility (m)
Officer Force 0
1
around the time the facility reopened, though the number of stops for Precinct 88 fell at a faster rate. After this fall, Precinct 84 consistently recorded the most stops in range.
When broken down by precinct in Figure 25, clear changes to the rate of officer use of force appeared after the facility reopened. The rates of use of force for Precincts 78 and 88, the farthest precincts, remained consistent across the time disparity. Prior to reopening, the rate for Precinct 84 generally stayed consistent with Precincts 78 and 88. The rate of use of force for Precinct 76 was consistently the highest pre-reopening and slowly falls from 2008 until 2013, when it settled briefly before stop counts became so low as to obscure trends in the rate data. Beginning a few months before reopening and ending a few months after, the rate for Precinct 84 increased and settled at its new height for approximately 1.5 years. It jumped again for the rest of 2013 before falling to pre-disparity levels briefly, before low stop counts obscure trends.
Rates of force remain relatively consistent when controlling for stop “success,” which, as established earlier, means that changes to force behavior are not likely to be caused by changes in the characteristics of persons in the area (Figure 26). Furthermore, precinct “success” rates
0% 25% 50% 75% 100% % of Stops Resulting in Of ficer Use of F orce Precinct 76 78 84 88
remain consistent across the time disparity, and the rates for Precinct 84 specifically are similar to those of Precincts 76 and 78, further supporting this conclusion (Figure 27).
For the majority of the two years following reopening Precinct 84, home to the Brooklyn Detention Complex, had the highest rate of use of force of all the precincts by far. It was also the only precinct whose rate of force increased around the time that the facility reopened. As the decrease in stops for Precinct 84 coincides with a similar decrease for at least one other precinct and as the success rates in Precinct 84 are similar to those in other precincts and do not change around the time disparity, we can conclude that this change to force behavior in Precinct 84 cannot be explained by other variables in the data. Because distances in Precinct 84 are significantly shorter than those in other precincts, it is therefore likely that policy changes specific to Precinct 84 may be responsible for much of the difference in the average distances of forceful and forceless stops post-reopening.
CONCLUSION
Based on existing literature, I hypothesized that police behavior would have become more aggressive near the Brooklyn Detention Complex after its reopening, and specifically that there would have been a greater number of stops and arrests and a higher propensity toward using force. I also hypothesized an increase in the racial bias in the measures of police behavior outlined above. While I did not find evidence for the latter hypothesis or for a geographic change in the number of stops or arrests, I did find evidence that stops were more forceful near the reopened facility. However, the post-reopening increase in officer use of force was localized to the precinct in which the facility sits and was geographically homogenous within that precinct. For many aspects of police behavior, it seems that proximity to incarceral facilities either plays a limited role in defining behavior or plays no role at all. With respect to use of force specifically, it seems that proximity to incarceral facilities may increase forceful behavior by police for a limited time after a facility first opens, or in this case reopens. However, this effect was localized to the precinct home to the facility. Given that the treatment effect on officer use of force is completely controlled by precinct and not just significantly reduced, if we were to
believe that the change could be attributed to the reopening of the Complex it may mean that: 1. Police perceive local institutions as impacting their precinct as a whole and not any internal neighborhoods AND / OR 2. Change in police behavior following the introduction of carceral
facilities happens institutionally – through official policy or informal direction – and not as the result of individual officer bias.
It is possible that the changed behavior with respect to officer use of force in Precinct 84 is the result of policy changes unrelated to the facility reopening. I suspect that this may not be the case for three reasons. The first reason is that, since the increased rates of force are
completely localized to this precinct, it is not likely to be the result of changes in NYPD policy as a whole, changes in policy or climate specific to Brooklyn, or even changes in climate in local neighborhoods bordering the precinct. The second reason is that the precinct saw no changes in leadership around the beginning of the change, either from internal leadership like the Deputy Inspector (Scales, 2012) or external partners like the Civilian President of the 84th Precinct Community Council (Abruzzese, 2014). The third reason is that the change begins precisely around the time of the facility reopening and in the absence of the first two explanations this becomes the most likely reason.
However, it is not fully within the methods of this thesis to determine whether this
change in behavior was due to: (1) changed perceptions of individual police officers, (2) changed precinct policies intended to respond to the reopening of the facility, (3) coincidental changed precinct policies responding to other external or internal factors or some combination of the above. Though I suspect it is the second, there is no evidence eliminating the other two
possibilities. Future research should seek to answer this question for this specific context as well as replicate these findings in other contexts to show generalizability.
ADDITIONAL TABLES AND FIGURES
Table 1 – X & Y Coordinate Coverage
Year Total Stops X & Y Coordinates % Coverage No Address % of Total Stops
2006 16942 16461 97.16% 0 0.0000% 2007 17118 16656 97.30% 0 0.0000% 2008 17548 17183 97.92% 2 0.0114% 2009 19019 18658 98.10% 0 0.0000% 2010 20387 19858 97.41% 1 0.0049% 2011 21162 20402 96.41% 2 0.0095% 2012 17539 17015 97.01% 6 0.0342% 2013 8068 7784 96.48% 1 0.0124% 2014 2006 1968 98.11% 1 0.0499% 2015 628 615 97.93% 1 0.1592% 2016 500 494 98.80% 0 0.0000% TOTAL 140917 137094 97.29% 14 0.0099%
Table 4 – Summary Statistics
Field Min. 1st Qu. Median Mean 3rd Qu. Max.
year 2006 2008 2010 2009 2011 2016 distance 23.54 798.8 1177.62 1146.97 1467.97 1999.9 frisked 0 0 0 0.4352 1 1 searched 0 0 0 0.08448 0 1 search_success 0 0 0 0.03253 0 1 stop_success 0 0 0 0.1271 0 1 officer_force 0 0 0 0.1337 0 1 of_count 0 0 0 0.1677 0 7 Factors precinct 76: 23847 78: 9760 84: 30876 88: 34531 sex F: 9108 M: 88512 Z: 1394 race A: 2056 B: 60996 I: 403 P: 4120 Q: 17808 U: 575 W: 11012 Z: 2044
Table 5 – Correlation Matrix
distance frisked searched search_success stop_success officer_force of_count distance 1 frisked 0.001 1 searched -0.009 0.311 1 search_success -0.015 0.15 0.357 1 stop_success 0.008 0.179 0.383 0.481 1 officer_force -0.043 0.364 0.284 0.151 0.167 1 of_count -0.04 0.331 0.315 0.175 0.208 0.893 1
Table 6 – Difference in Difference Tables
0.5km Proximity Dummy Variable
=============================================== Dependent variable: --- # of Stops --- Within 0.5km Proximity -215.122*** (14.530) Post-Reopening -237.651*** (10.995) Proximity : Post Reopening 164.514***
(21.937) Constant 328.000*** (7.265) --- Observations 526 R2 0.557 Adjusted R2 0.554 Residual Std. Error 108.243 (df = 522) F Statistic 218.604*** (df = 3; 522) =============================================== Note: *p<0.1; **p<0.05; ***p<0.01
1km Proximity Dummy Variable
=============================================== Dependent variable: --- # of Stops --- Within 1km Proximity -155.466*** (13.407) Post-Reopening -257.549*** (14.372) Proximity : Post Reopening 122.123***
(20.275) Constant 351.953*** (9.480) --- Observations 526 R2 0.497 Adjusted R2 0.494 Residual Std. Error 115.329 (df = 522) F Statistic 171.840*** (df = 3; 522) ===============================================
1.5km Proximity Dummy Variable =============================================== Dependent variable: --- # of Stops --- Within 1.5km Proximity 36.689** (17.345) Post-Reopening -177.229*** (22.772) Proximity : Post Reopening -25.903
(26.273) Constant 246.703*** (15.021) --- Observations 526 R2 0.368 Adjusted R2 0.365 Residual Std. Error 129.216 (df = 522) F Statistic 101.496*** (df = 3; 522) =============================================== Note: *p<0.1; **p<0.05; ***p<0.01
900 1000 1100 1200
2010 Jan 2010 May 2010 Sep 2011 Jan 2011 May 2011 Sep 2012 Jan 2012 May 2012 Sep 2013 Jan 2013 May 2013 Sep
A
verage Distance From F
acility (m)
Stop Success 0
1
Precinct 76
Precinct 78
Precinct 84
Precinct 88
2010 Jan 2010 May 2010 Sep 2011 Jan 2011 May 2011 Sep 2012 Jan 2012 May 2012 Sep 2013 Jan 2013 May 2013 Sep
600 900 1200 1500 600 900 1200 1500 600 900 1200 1500 600 900 1200 1500 A
verage Distance From F
acility (m)
Stop Success 0
1
600 800 1000 1200 1400
2006 Jan 2006 May 2006 Sep 2007 Jan 2007 May 2007 Sep 2008 Jan 2008 May 2008 Sep 2009 Jan 2009 May 2009 Sep 2010 Jan 2010 May 2010 Sep 2011 Jan 2011 May 2011 Sep 2012 Jan 2012 May 2012 Sep 2013 Jan 2013 May 2013 Sep 2014 Jan 2014 May 2014 Sep 2015 Jan 2015 May 2015 Sep 2016 Jan 2016 May 2016 Sep
A
verage Distance From F
acility (m)
Frisked 0 1
750 1000 1250
2006 Jan 2006 May 2006 Sep 2007 Jan 2007 May 2007 Sep 2008 Jan 2008 May 2008 Sep 2009 Jan 2009 May 2009 Sep 2010 Jan 2010 May 2010 Sep 2011 Jan 2011 May 2011 Sep 2012 Jan 2012 May 2012 Sep 2013 Jan 2013 May 2013 Sep 2014 Jan 2014 May 2014 Sep 2015 Jan 2015 May 2015 Sep 2016 Jan 2016 May 2016 Sep
A
verage Distance From F
acility (m)
Searched 0 1
Precinct 76
Precinct 78
Precinct 84
Precinct 88
2010 Jan 2010 May 2010 Sep 2011 Jan 2011 May 2011 Sep 2012 Jan 2012 May 2012 Sep 2013 Jan 2013 May 2013 Sep
750 1000 1250 1500 750 1000 1250 1500 750 1000 1250 1500 750 1000 1250 1500 A
verage Distance From F
acility (m)
Frisked 0 1
Precinct 76
Precinct 78
Precinct 84
Precinct 88
2010 Jan 2010 May 2010 Sep 2011 Jan 2011 May 2011 Sep 2012 Jan 2012 May 2012 Sep 2013 Jan 2013 May 2013 Sep
500 1000 1500 2000 500 1000 1500 2000 500 1000 1500 2000 500 1000 1500 2000 A
verage Distance From F
acility (m)
Searched 0 1
500 1000 1500
2006 Jan 2006 May 2006 Sep 2007 Jan 2007 May 2007 Sep 2008 Jan 2008 May 2008 Sep 2009 Jan 2009 May 2009 Sep 2010 Jan 2010 May 2010 Sep 2011 Jan 2011 May 2011 Sep 2012 Jan 2012 May 2012 Sep 2013 Jan 2013 May 2013 Sep 2014 Jan 2014 May 2014 Sep 2015 Jan 2015 May 2015 Sep 2016 Jan 2016 May 2016 Sep
A
verage Distance From F
acility (m)
Identifed Sex Female Male Unknown
800 1000 1200
2010 Jan 2010 May 2010 Sep 2011 Jan 2011 May 2011 Sep 2012 Jan 2012 May 2012 Sep 2013 Jan 2013 May 2013 Sep 2014 Jan 2014 May 2014 Sep
A
verage Distance From F
acility (m)
Identified Race Non−White White
800 1000 1200
2010 Jan 2010 May 2010 Sep 2011 Jan 2011 May 2011 Sep 2012 Jan 2012 May 2012 Sep 2013 Jan 2013 May 2013 Sep 2014 Jan 2014 May 2014 Sep
A
verage Distance From F
acility (m) Identified Race Non−Hispanic Black Black (Total) Hispanic (Total) Non−White White
0% 10% 20% 30% 40% 50%
2006 Jan 2006 May 2006 Sep 2007 Jan 2007 May 2007 Sep 2008 Jan 2008 May 2008 Sep 2009 Jan 2009 May 2009 Sep 2010 Jan 2010 May 2010 Sep 2011 Jan 2011 May 2011 Sep 2012 Jan 2012 May 2012 Sep 2013 Jan 2013 May 2013 Sep 2014 Jan 2014 May 2014 Sep 2015 Jan 2015 May 2015 Sep 2016 Jan 2016 May 2016 Sep
% of Stops Resulting in Of
ficer Use of F
orce
1.0 1.2 1.4 1.6
2006 Jan 2006 May 2006 Sep 2007 Jan 2007 May 2007 Sep 2008 Jan 2008 May 2008 Sep 2009 Jan 2009 May 2009 Sep 2010 Jan 2010 May 2010 Sep 2011 Jan 2011 May 2011 Sep 2012 Jan 2012 May 2012 Sep 2013 Jan 2013 May 2013 Sep 2014 Jan 2014 May 2015 Jan 2015 May 2015 Sep 2016 Jan 2016 May 2016 Sep
A
verage Counts of Of
ficer F
orce Per F
orceful Stop
500 1000 1500 2000
2010 Jan 2010 May 2010 Sep 2011 Jan 2011 May 2011 Sep 2012 Jan 2012 May 2012 Sep 2013 Jan 2013 May 2013 Sep
A
verage Distance From F
acility (m) Counts of Force 1 2 3 4
0 200 400 600 800
2006 Jan 2006 May 2006 Sep 2007 Jan 2007 May 2007 Sep 2008 Jan 2008 May 2008 Sep 2009 Jan 2009 May 2009 Sep 2010 Jan 2010 May 2010 Sep 2011 Jan 2011 May 2011 Sep 2012 Jan 2012 May 2012 Sep 2013 Jan 2013 May 2013 Sep 2014 Jan 2014 May 2014 Sep 2015 Jan 2015 May 2015 Sep 2016 Jan 2016 May 2016 Sep
Stops Per Month
Distance from Facility 0 − 0.5km
0.5 − 1km 1 − 1.5km 1.5 − 2km
10% 20% 30% 40%
2006 Jan 2006 May 2006 Sep 2007 Jan 2007 May 2007 Sep 2008 Jan 2008 May 2008 Sep 2009 Jan 2009 May 2009 Sep 2010 Jan 2010 May 2010 Sep 2011 Jan 2011 May 2011 Sep 2012 Jan 2012 May 2012 Sep 2013 Jan 2013 May 2013 Sep 2014 Jan 2014 May 2014 Sep 2015 Jan 2015 May 2015 Sep 2016 Jan 2016 May 2016 Sep
Success Rate
Female
Male
Unkno
wn
2010 Jan 2010 May 2010 Sep 2011 Jan 2011 May 2011 Sep 2012 Jan 2012 May 2012 Sep 2013 Jan 2013 May 2013 Sep
500 1000 1500 500 1000 1500 500 1000 1500 A
verage Distance From F
acility (m)
Officer Force 0
1