Application of Critical Chain Principles
to Improve Microprocessor Technology Ramps
By Lane P. Ballard
Bachelors of Science in Mechanical Engineering, Virginia Polytechnic Institute (1997)
Submitted to the Department of Mechanical Engineering and the Sloan School of Management
In Partial Fulfillment of the Requirements for the Degrees of
Master of Business Administration Master of Science in Mechanical Engineering
In Conjunction with the Leaders for Manufacturing Program at the Massachusetts Institute of Technology
June 2005
0 2005 Massachusetts Institute of Technology, All rights reserved
Signature of Author
May 6, 2005
Sloan School of Management Department of Mechanical Engineering
Certified by
(6koy E. Welsch, Thesis Advisor Professor of Management Science, Statistics, and Engineering Systems
Sloan School of Management and Engineering Systems Division
Certified by
Daniel WhitnreyhIs\dvisor Lecturer, MIT Engineering Systems E1 vision
Accepted by
')avio(Capodilupo Execut Director of Masters Program
loan School of Management
Accepted by
MASSACHUSEFTS INSTITUTE, OF TECHNOLOGY
SEP 0
1
2005
fallit Anand Chairman, Committee on Graduate Studies Department of Mechanical Engineering
BARKER
Application of Critical Chain Principles
to Improve Microprocessor Technology Ramps
By
Lane P. Ballard
Submitted to Sloan School of Management and the Department of Mechanical Engineering on May 6,
2005 in partial fulfillment of the requirement for the Degrees of
Master of Business Administration Master of Science in Mechanical Engineering
Abstract
Across Intel's microprocessor production there exists high variability on new technology process tools meeting standard installation and qualification (I/Q) schedule durations. To reduce project schedule variability and increase time to money, Intel has begun examining critical chain management philosophies
to aid in the reduction of high volume manufacturing (HVM) process tool I/Q durations. The goal of this assignment was to develop and implement a project management process using the principles of critical chain to enable continuous improvement on I/Q planning durations over technologies. Looking into the future, this thesis also examines a progression from product innovation towards process innovation in the microprocessor industry. This shift will further demand decreased I/Q durations and increased
predictability for Intel on future microprocessor technology transitions.
Thesis Supervisor: Roy E Welsch
Title: Professor of Management Science, Statistics, and Engineering Systems
Thesis Supervisor: Daniel Whitney
Acknowledgements
I wish to acknowledge the Leaders for Manufacturing Program for its support of this work. A special
note of thanks goes to Don Rosenfield and Nancy Young for making the LFM Program run so well. My advisors, Roy Welsch and Dan Whitney, also deserve applause for their help during all stages of the internship.
To my colleagues and mentors at Boeing, I appreciate your faith and sponsorship during the last two years. What puts Boeing at the top of my career aspirations are the great people and great products. I look forward to the challenges ahead.
Of course I wish to thank the Intel Corporation both for their support of the LFM Program as well as for
the internship in Ireland. I especially want to thank Venkatesh Patil, Sean McCarthy, and Margaret Cuddigan for their guidance through the assignment.
Finally I wish to thank my wife and family. My life has been truly been blessed with the gift of a strong loving family.
I dedicate this thesis to my wife Carolyn who has unselfishly supported my schooling the last two years. I look forward to now helping you reach your educational and career dreams!
Table of Contents
1.0 OVERVIEW OF THE PROBLEM...7
1.1 MICROPROCESSOR INSTALLATION/QUALIFICATION (I/Q) PROCESS... 7
1.2 NEED FOR CONTINUOUS I/Q DURATION/VARIATION REDUCTION...8
1.3 PROJECT GOAL AND OBJECTIVES... 8
1.4 T HESIS STRU CTURE ... 9
2.0 PROJECT MANAGEMENT CHALLENGES... 11
2.1 IDENTIFY THE PROPER PROBLEM/PROJECT... 13
2.2 IDENTIFY THE PROPER SOLUTION ... 13
2.2.1 Poor Upfront Planning...13
2.2.2 Ineffective Schedule Protection ... 13
2.2.3 Poor Team Execution ... 17
2.3 PROJECT MANAGEMENT SUMMARY... 18
3.0 CRITICAL CHAIN PRINCIPLES ... 19
3.1 THEORY OF CONSTRAINTS (TOC)... 19
3.2 CRITICAL CHAIN METHODOLOGIES -BUILDING ON CRITICAL PATH... 20
3.2.1 Building a Critical Chain Project ... 20
3.2.1 Monitoring a Critical Chain Project ... 23
3.4 CRITICAL CHAIN SUMMARY ... 24
4.0 OBSERVATIONS OF THE CURRENT REALITY... 27
4.1 COLLECTED DURATION DATA ANALYSIS... 27
4 .1.1 D uration D ata ... 27
4 .1.2 V ariation D ata ... 28
4.2 DURATION MANAGEMENT - LOW PRIORITY ... 29
4.3 DURATION VARIATION CONTRIBUTORS ... 30
4.3.1 Working on the Technology Frontier ... 30
4.3.2 "Copy Exactly" Specifications...30
4.3.3 Workforce Coordination...31
4.3.4 The Working Environment ... 31
4.4 THE BUFFER PROTECTS ... 32
4.5 OBSERVATIONS SUMMARY ... 32
5.0 OVERVIEW OF PROPOSED SOLUTIONS...35
5.1 WORKFORCE VARIATION - PROJECT MANAGEMENT CHANGES... 35
5.1.1 Building on Past Checklist Success... 35
5.1.2 Aspects of Critical Chain...36
5.2 ENVIRONMENT VARIATION -PRODUCTION IMPACT APPROVAL SYSTEM REVAMP... 37
5.3 PROPOSED SOLUTIONS SUMMARY ... 38
6.0 DURATION MANAGEMENT EXPERIMENTATION... 40
6.1 WORKFORCE VARIATION - INTEGRATED CHECKLIST AND ASSUMPTIONS (ICLA)... 41
6.1.1 Released ICLA Best Known Method - Rev 1 ... 41
6.1.2 ICLA Implementation and Initial Results...48
6.2 ENVIRONMENT VARIATION - EQUIPMENT RESERVATION SYSTEM (ERS)... 49
7.0 INTEL I/Q ORGANIZATIONAL BARRIERS TO ICLA... 51
7.1 STRATEGIC DESIGN LENS ... 51
7.2 POLITICAL DESIGN LENS ... 52
7.2.1 Competing For Future Business ... 52
7.2.2 I/Q Taking a Backseat to Production...52
7.2.3 The Missing Project Champion...52
7.3 CULTURAL DESIGN LENS... 53
7.3.1 CE ... 53
7.3.1 M eritocracy ... 53
7.4 ANALYSIS AS A WHOLE ... 54
8.0 GOING FORWARD...55
8.1 THE CHANGING MARKET - PRODUCT MATURITY/DOMINANT DESIGN... 55
8.2 RECOMMENDATION - CONTINUE CREATING THE GROUND SWELL ... 57
8.2.1 Top-Down - Define/Create the Need for Change...57
8.2.2 Bottom-up - Develop the Continuous Improvement Culture ... 58
APPENDIX A: AUTHOR'S BIOGRAPHICAL INFORMATION ... 61
TERMS AND ACRONYMS ... 62
1.0 Overview of the Problem
Gordon Moore, one of Intel's founders, in 1965 observed an exponential growth in the number of transistors per integrated circuit and predicted that this trend would continue. As shown in Figure 1 below, in 1970 a single microprocessor had approximately 2000 transistors and today the number of transistors approach one billion.
MOORE'S LAW Inta ln"I nv' 2PrCooeusor
Inteis tankX4 Proceo r
ntle A IOWAas t$ PwroMioe4rIntt368" P 0t~tt*8f "W**4 "" 800W 00e 1970 1975 1980 1985 1990 1995 2000
Figure 1: Moore's Law(http://www.intel.com/research/silicon/moor
transistors
11000,00.000
100,000,000
10,Q00,000 1 00000 10,000 2005 eslaw.htm)Although the above is termed "Moore's Law" suggesting a natural force controls the curve, Intel's success has really been a self-fulfilling prophecy. Intel continues to push itself and its suppliers up the curve through continuous microprocessor technology ramps. These technology transitions can mean a modification to an existing production facility or an entirely new state-of-the-art multi-billion dollar production line. In either case the group focused on in this thesis, Installation or Qualification (I/Q), has the responsibility at Intel of bringing in the latest production tools from each supplier and integrating hundreds of these tools into new high volume manufacturing (HVM) microprocessor production facilities.
1.1 Microprocessor Installation/Qualification (I/Q) Process
Before an Intel production line is capable of running the millions microprocessors needed every few months, each individual production tool goes through four main stages in the I/Q process; prefacilitisation, installation, supplier qualification, Intel qualification.
Prefacilitisation (PF) and Installation (Install)
Prefacilitisation (PF) involves readying the production facility to accept the incoming production tool. This involves building the supporting infrastructure such as construction of the foundation. Installation (Install) involves accepting the production tool from the supplier and connecting the power, chemical and
safety systems. PF and Install are the true construction portions of the project where the supporting infrastructures are built and connected to the existing production line. Work in this stage is mainly done
by various crafts and construction trades (plumbers, electricians, etc.). Supplier Qualification (SQual)
Once power, chemical, and safety checks are complete the supplier comes into the factory and ensures the machine meets the agreed to Intel specifications. This is accomplished by running sample wafers through the machine and "dialling-in" the settings to meet rigid Intel specifications. Once SQual is complete the
machine is handed back over to Intel.
Intel Qualification (IQual)
IQual is conducted mainly by Intel Process Engineers (PE's) who are trained specific to a fabrication technology processing step. Once they accept the machine from SQual, they then modify the machine to meet Intel's exact specifications. These exact specifications are generally not shared with the supplier to protect Intel's intellectual property (Intel IP). Again, sample wafers are processed through the machine to ensure the unit meets rigid production specifications. After completing IQual the machine is ready to enter production.
1.2 Need for Continuous I/Q Duration/Variation Reduction
Mentioned earlier, the costs for a new microprocessor production line are measured in the billions of dollars. The majority of this money is spent on purchasing complex production equipment and hundreds of millions are spent during I/Q to ensure the multimillion dollar machines produce high quality product from day one. The large cost of I/Q plus the advantages of getting new microprocessor technology to market quickly creates a need for continuous focus on the time(duration) and variation of the time associated with the I/Q process. To reduce project schedule variability and improve time to money, Intel has begun examining ways to reduce the overall cost and schedule of I/Q while maintaining its high quality production.
1.3 Project Goal and Objectives
In May of 2005 the author was presented with the opportunity to work inside the I/Q organization at one of Intel's newest microprocessor facilities near Dublin, Ireland called Fab24. The 6-month assignment
was part of the Leaders for Manufacturing program requirements and the focus of the work was to examine critical chain management philosophies to aid in the reduction of high volume manufacturing process (HVM) tool I/Q durations.
Prior to the internship during a recent technology ramp, Fab 24's I/Q organization had successfully piloted a new project management process using detailed integrated checklists. The process was credited with substantial duration performance breakthroughs at the site. Wanting to build on the groups' initial success, Fab24 I/Q Director gave the task of exploring the use of critical chain along with the integrated checklist process. The benefits of critical chain will be discussed on Chapter 3.
The goal of this work was to further develop and implement integrated checklist processes making the process available for use by all Intel projects to enable continuous improvement on IQ planning durations over technologies.
The three objectives of the assignment were as follows;
* Increase predictability of I/Q project deliverables for Intel, Suppliers, and Crafts on current technology capacity ramps.
* Enable reduction on planning and project durations for future microprocessor technology transitions
" Deliver an Intel Best Known method (BKM) for coordination and development of I/Q Integrated
Checklists
1.4 Thesis Structure
This thesis is divided into eight chapters. The next chapter will explore general project management practices and identify common mistakes. Chapter 3 will present how critical chain project management attempts to correct those concerns. Chapter 4 then gives initial observations coming into the I/Q organization. Here both the organization and the data are evaluated to lay the foundation for future improvement. From those observations, Chapter 5 then captures the proposed solutions and Chapter 6 covers the implementation of those solutions. In Chapter 7, the Intel organization is examined to present potential barriers towards future critical chain implementation inside the I/Q organization. Finally, Chapter 8 lists final conclusions and recommendations of the study.
2.0 Project Management Challenges
Product development fuels future success in the private industry. No matter the business, the faster you can develop new products and get them in front of the consumer the better your chances for success. Historically the first to market on a product has three advantages. First, the product life is extended since the company can begin selling the product earlier as shown in Figure 2 below. [Cook, 1998] Second,
shorter development cycles free up the valuable product development resources for work on other projects. Third, you start with 100% market share which allows the company to initially extract higher margins.
100% market share also means your competitors will have a much tougher time trying to take away your
market share than you will have to simply maintain it.
Increased Sales
Maturity End of product cycle Sales
Time
Figure 2: Benefits of Quicker Product Development and Release [Cook, 19981
The key to efficient time-to-market lies in how well a company manages each development effort. Project management is all about managing resources to achieve quality, cost and schedule
requirements/goals. Effective project management is very difficult as expressed in the Immutable Laws of Project Management which can be found in books and websites worldwide throughout the project management community (Figure 3). These "Laws" really capture the typical problems companies have when managing products and serve as a great introduction to the subject of effective project management. The 15 laws below are great to keep in mind during the execution of a project, but before execution you must identify the problem/project to work and how best to solve it. The next two sections will review past mistakes project managers commonly make in these initial stages.
LAW 1: No major project is ever completed on time, within budget, with the same staff that started it, nor
does the project do what it is supposed to do. It is highly unlikely that yours will be the first.
- Corollary 1: The benefits will be smaller than initially estimated, if estimates were made at all.
" Corollary 2: The system finally installed will be completed late and will not do what it is supposed
to do.
" Corollary 3: It will cost more but will be technically successful.
LAW 2: One advantage of fuzzy project objectives is that they let you avoid embarrassment in estimating
the corresponding costs.
LAW 3: The effort required to correct a project that is off course increases geometrically with time.
* Corollary 1: The longer you wait the harder it gets.
- Corollary 2: If you wait until the project is completed, its too late. - Corollary 3: Do it now regardless of the embarrassment.
LAW 4: The project purpose statement you wrote and understand will be seen differently by everyone else.
- Corollary 1: If you explain the purpose so clearly that no one could possibly misunderstand, someone will.
- Corollary 2: If you do something that you are sure will meet everyone's approval, someone will not like it.
LAW 5: Measurable benefits are real. Intangible benefits are not measurable, thus intangible benefits are not
real.
- Corollary 1: Intangible benefits are real if you can prove that they are real.
LAW 6: Anyone who can work effectively on a project part-time certainly does not have enough to do now.
- Corollary 1: If a boss will not give a worker a full-time job, you shouldn't either.
- Corollary 2: If the project participant has a time conflict, the work given by the full-time boss will not suffer.
LAW 7: The greater the project's technical complexity, the less you need a technician to manage it.
- Corollary 1: Get the best manager you can. The manager will get the technicians. - Corollary 2: The reverse of corollary
1
is almost never true.LAW 8: A carelessly planned project will take three times longer to complete than expected. A carefully
planned project will only take twice as long.
- Corollary 1: If nothing can possibly go wrong, it will anyway.
LAW 9: When the project is going well, something will go wrong.
- Corollary 1: When things cannot get any worse, they will.
- Corollary 2: When things appear to be going better, you have overlooked something.
LAW 10: Project teams detest weekly progress reporting because it so vividly manifests their lack of
progress.
LAW 11: Projects progress rapidly until they are 90 percent complete. Then they remain 90 percent
complete forever.
LAW 12: If project content is allowed to change freely, the rate of change will exceed the rate of progress. LAW 13: If the user does not believe in the system, a parallel system will be developed. Neither system will
work very well.
LAW 14: Benefits achieved are a function of the thoroughness of the post-audit check.
- Corollary 1: The prospect of an independent post-audit provides the project team with a powerful incentive to deliver a good system on schedule within budget.
LAW 15: No law is immutable.
2.1 Identify the Proper Problem/Project
Lawrence Leach writes the "The most important decision you make when you go about improving anything is what to change. Everything else follows from that decision."[Leach, 2000, p 75] Basically he is saying choose projects important to the company so that the environment is ripe for the coming change. So the first task in the project management arena is to choose the right project or problem to solve. Once the problem is identified the next step is to identify the right solution.
2.2 Identify the Proper Solution
Assuming the proper problem/project has been identified, the next crucial decision is how best to
solve/execute it. When developing the project management solution many projects fail due to poor initial planning, ineffective schedule protection, and a lack of team execution as discussed below.
2.2.1 Poor Upfront Planning
Poor planning shows-up in the form of a project schedule lacking sufficient detail. Most can attest to the common way schedules are built and implemented. To sell the project a few individuals come up with a rough draft schedule containing estimates, usually ideal, of the time and money needed to execute a project. If the proposal is accepted, teams are quickly formed and due to "time constraints" the rough draft schedule becomes the final schedule to begin managing to with no buy-in from those responsible for the work. So out of the gate most projects have set unrealistic targets.
2.2.2 Ineffective Schedule Protection
Going back to Figure 3, the final immutable law of project management is that none of the laws are absolute. Along with poor planning, most projects are not built to properly deal with unforeseen problems.
2.2.2.1 Safety in the Numbers
If someone was to ask you "how long does it take you to get to work in the morning?" In the back of your mind you may come up with the below time-line in Figure 4 below.
to ti t2 t3 t4 tl = The amount of time the task will take if everything goes reasonably well. t2 = tl+ The amount of time to cope with uncertainty in the task. (Flat Tire)
t3 = t2+ The amount of time spent working on other activities. (Get gas and stop for coffee) t4 = t3+ The amount of time we allow for interruptions. (Potential Traffic)
Figure 4: Driving To Work Time-Line
If the person asking you the question was your boss, you would probably add additional time to the duration to further protect yourself from possible embarrassment at a later date. Now suppose your boss went about asking you and everyone in your office how long it takes to complete all aspects of your job on a project. Most everyone would follow a similar thought process and add plenty of buffers to avoid potential embarrassment at a later date. The final project schedule would be full of protection or buffer.
WI I
T ask Duration
A C
Figure 5: Distribution of Possible Task Duration Outcomes [Jacobs, 1997]
Eliyahu M. Goldratt, the author of Critical Chain, further demonstrates this added safety by modeling the outcome of a given task using a distribution curve with a finite left tail, as shown in the Figure 5 above. Time "A" represents a task duration given no problems ever occur. Notice on the distribution curve that time "A" has a very low probability of ever happening and so most would be irresponsible to use this time to develop a final schedule. Time "C" on the other hand is highly achievable task duration. No matter what problems occur, you can reasonably assume the task will be completed before task duration "C".
Time "C" is what Goldratt terms the "95% time" because 95% of the time a resource will finish the task in less time then the given estimate "C". Unfortunately it is time "C" that most planners use when deciding on task durations. To make matters worse this added time only makes the schedule longer, not safer for reasons discussed below.
2.2.2.2 Milestone Behavior - Consuming the Safety
Although the inherent safety of the "95% time" is intended to protect the overall project date, human nature, resource conflict, and milestone structure do not allow for the proper use of the time.
Human Nature -Parkinson's Law and the Student Syndrome
Cyril Northcote Parkinson developed Parkinson's Law which states that work expands so as to fill the time available for its completion. [Parkinson, 1957] Many of us have missed an alarm clock in the morning and once we wake-up and realize we are about to miss an important meeting, are able to shower, dress, and eat in the time is normally takes us to stumble out of bed. This efficiency is due to the shortage of time we have before us. Another example of the Parkinson's Law is when your boss tells you to have the report, he just assigned you, on his desk by close of business today. Under normal conditions we may take a few days, but given our leader's request, we produce the report in record time.
Further building on the Parkinson's Law, another way we subconsciously waste safety is a dilemma termed "student syndrome". As the Figure 6 demonstrates below, the level of effort put forth by the person drastically increases near the required date of the project, sort of like the typical student waiting to the night before to really buckle-down and study for finals.
Task Scheduled Completion Date Effort Level X Murphy: Activity Time
@
Avrah)Y. Ceimtk Ln&alaSo because of the Parkinson's Law and the Student Syndrome, safety time simply allows individuals to delay starting tasks. The major problem with waiting until the last minute is that unexpected problems tend to present themselves during this critical time, Murphy's Law. To fix these problems means missed completion dates.
Resource Conflict -Multitasking
Another way safety is wasted is due to resource conflicts. In a perfect world each employee would have a single task to complete at any given time and we would have the power to work each task from start to finish uninterrupted. Unfortunately many of us have multiple projects/managers to support on any given day, and as most of us have experienced, the priority for the tasks to change daily, forcing us to multitask.
In Critical Chain Project Management, Lawrence Leach uses the example of an employee splitting his or
her time during the day supporting three tasks. In Figure 7 below, if each task was worked individually one task could be completed each week. Instead what normally occurs is all three tasks are worked together in parallel and all are completed at the end of week three. That means Task A is two weeks late Task B is one week late, and Task C is the only task completed on time. The below figure does not include the time to switch between tasks which adds even more time to the schedule.
One unit of One unit of One unit of
throughput throughput throughput
t
f
Task A Task B Task C
Task A Task B
Task C
Three units of throughput
Figure 7: Multitasking Delays All Projects [Leach, 2000, p861
Milestone Structure - The Additive Rule
Using conventional milestone management, the final way safety is wasted is through the additive rule. Looking at Figure 8 below, you will note that although task A was completed before scheduled, task B waited to begin until the planned Milestone 1 was reached. Task B then ran into trouble and took much longer then expected, forcing task C to begin later then the planned milestone 2. In the end the delay was passed on, ensuring future missed schedule dates.
Milestone Milestone Milestone
1 2 3
Pln
V
Flan:
A
_JB
C
C
Figure 8: Milestone Additive Rule
2.2.3
Poor Team Execution
The final problem with the majority of our existing project management methods lies in our inability to make use of teams. Instead of everyone managing to an end goal, we assign individual task completion dates, or milestones, and hope that by everyone meeting their individual schedules, the overall schedule will be protected. This over-the-fence style project management method does not take advantage of the benefits of working towards a team goal. Below is a quote capturing eight important advantages of working as a team.
"If your organization is still trying to determine if teams are worth it, consider the following: 1. Team output usually exceeds individual output.
2. Complex problems can be solved more effectively.
3. Creative ideas are usually stimulated in the presence of other individuals who have the same focus, passion, and excitement.
4. Support arises among team members. 5. Teams infuse knowledge.
6. Teams promote organizational learning in a work setting.
7. Teams promote individual self-disclosure and examination.
8. Teams both appreciate and take advantage of diversity (Woodring and Zigarmi, 1997, p.5)."
We have all heard the expression "two heads are better than one". Working in a team environment allows project managers to fully utilize their resources. Unfortunately teamwork takes proper coaching and coordination which is a weakness of most project management solutions.
2.3 Project Management Summary
Companies rely on project management to maintain a competitive advantage in the free market. For reasons pointed out in the Immutable Laws of Project Management, project execution can be very difficult. Even before project execution a project leader must correctly identify the problem or project to focus resources on. For this assignment Intel had identified the time (duration) and variation of time required installing and qualifying process tools as the area in need of improvement at Intel. Whether or not this was the properly identified problem/project will be discussed in Chapter 4. The second task a project manager must accomplish prior to execution is to develop an effective solution to the identified problem. For reasons discussed above, past project management solutions tend to implement poor planning, ineffective schedule protection, and fail to take advantage of teamwork. Going into this assignment, Intel I/Q management had suggested applying the principles of critical chain to enable continuous improvement on future I/Q planning durations. Critical Chain, as will be discussed in the next chapter, attempts to better address the above identified planning, schedule protection and team execution concerns.
3.0 Critical Chain Principles
In 1997 Eliyahu Goldratt published Critical Chain to explain the application of Theory of Constraints
(TOC) to project planning and development. To understand critical chain let's first briefly summarize TOC.
3.1 Theory of Constraints (TOC)
"Give me a place to stand and a long enough lever and I can move the world."
Archimedes
TOC is a theory based on leverage. It is a management philosophy that focuses on improving the system
performance by finding the constraint of the system and then concentrating on elevating the capacity of the constraint. To simplify the definition a chain is most often used to represent the concept of TOC. Since the weakest link in a chain determines the overall chain's strength, focusing on improving the strength of the other links would have no impact to the strength of the chain. [Goldratt, 1984] So to strengthen the overall system, effort must be placed on the weakest chain link.
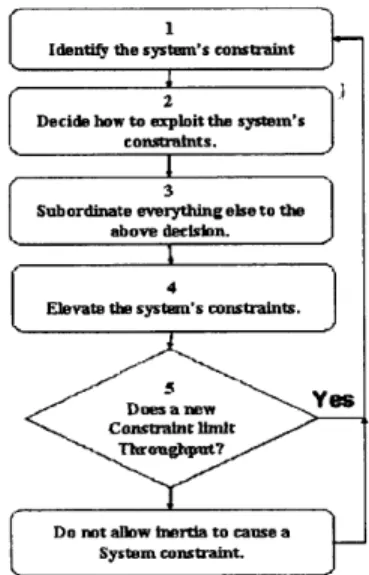
In project scheduling terms, TOC is utilized by adding together the predecessor/successor constraints (task durations) to produce the longest path needed to complete the project, called the critical path. Once the critical path is identified, the team can now focus efforts on shortening the overall project duration by focusing solely on the critical task(s). This can be done using Goldratt's five focusing steps which are summarized in a Figure 9.
Identify the system's constraint 2
Decide how to exploit the system's constraints.
3
Subordinate everything else to the
above decision.
4
Elevate the system's constraints.
5
Dmsem' '8S Constraint limit
Throughput?
Do not allow inertia to cause a System constraint.
This method of project management is termed critical path method (CPM) and acts as the foundation on which the critical chain method (CCM) is built.
3.2 Critical Chain Methodologies
-
Building on Critical Path
The critical chain is defined as the longest path through the program considering both technical and resource dependencies that determines the overall program duration. So after the critical path is
determined, the critical chain method looks into resolving resource conflicts. Also added to the CPM is a means for dealing with the probabilistic nature of task durations for a given project or how best to exploit the constraints (step 3 above) in the system once they are identified. Goldratt's main focus is on
challenging the way we develop and use safety in project management schedules.
3.2.1 Building a Critical Chain Project
To better explain the application of critical chain and how it improves on current critical path method, please consider the below Gantt schedule with identified critical path (Figure 10). This simplified means of explaining CC was taken from Stephen Carl Cook's thesis Applying Critical Chain to Improve
Management of Uncertainty in Projects. [Cook, 1998] Assume Sl, S2, S3, and S4 represent four skills needed to complete various tasks on a project and you only have one resource available in each skill. The number next to each task below represents the number of days needed to complete the task. The critical path is determined to be Sl->S2->S4 for a total of 140 days to complete the project. The second branch is not critical, but like most projects is started early so as not to later interfere with the critical path.
S1(50) S2(30) S3(30)---Critical Path 54 (60) 53 (30) 52 (30) 140 Days Figure 10: CPM PERT
Step 1: Reduce All Durations By 50% and Start Tasks As Late As Possible
To begin the critical chain transformation we go back to the distribution of possible task outcomes discussed earlier in section 2.2.2.1. In Figure 11 below, remember that time "A" is that one-in-a-million possibility that everything goes right during a task. A person would be foolish to list as an estimate on a schedule. Time "C" represents the other extreme where you are almost guaranteed to complete the task well before that time expires. Time "C" represents the typical time people list when asked for an estimate and so we will assume in the schedule above that all listed times approach or exceed "C".
0 I
I I
Task Duration
A B C
Figure 11: Distribution of Possible Task Duration Outcomes [Jacobs, 1997]
The first step when implementing critical chain is to try to determine the median task time or the estimate where 50% of the time you will come-in under the estimate and 50% of the time you will exceed the estimate. This time is represented by time "B" in Figure 11 above. Although many have tried to use
quantitative data to determine how to best predict this time, Goldratt recommends simply using half the estimated time. So in our example each task time is cut in half, as shown in Figure 12 below. Note that in our example time "B" for the entire project is now 70 days.
51(25) 52(15)
Critical Path
S4(30)
S3 (15) S2 (15)
70 Days
Figure 12: Reduce Durations By 50% and Start Tasks As Late As Possible
Also note from the above figure that the second branch was shifted so that all tasks began as late as possible. This is another methodology of critical chain which is meant to reduce work in progress (WIP) in the system. By reducing the WIP in the system you not only reduce inventory in the system, but you remove potential distractions in the system that could lead to multitasking.
Step 2: Eliminate Resource Conflicts - Create Critical Chain
L
3Z
(2
----
(1)
- - - - - - - Ctitical Chain _J S4 (30) S3(15) 52(15) 75 DaysFigure 13: Eliminate Resource Conflicts
The next step is to determine the longest path through the program considering both technical and resource dependencies. So in our example S2 is needed to complete two separate tasks and our reduced schedule creates a conflict of that resource. To resolve the conflict the critical path had to be moved to include the second branch shown in Figure 13. So our new critical chain is now S3->S2->S2->S4 and the median time ("B") for the project has increased to 75 days.
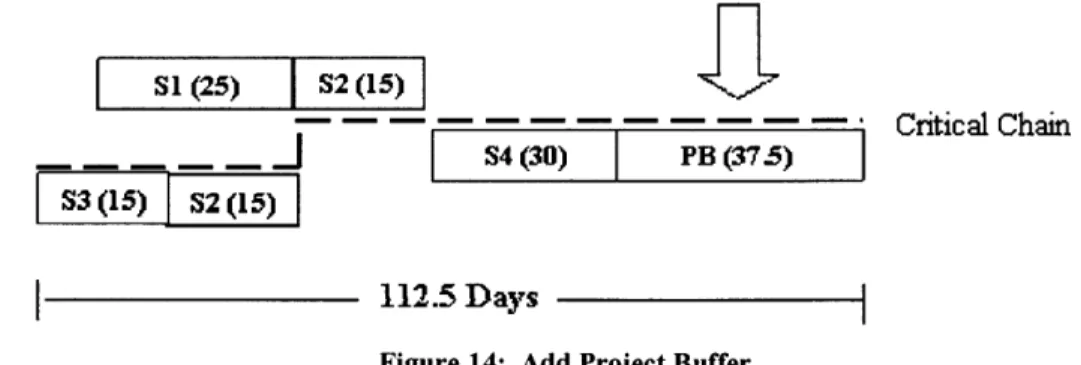
Step 3: Add a 50% Project Buffer at End
Since 75 days is the median, it would be foolish to estimate the project using this time since 50% of the time the project would exceed the estimate. The heart of the CC method lies in the application of an aggregate buffer placed at the end of the project. By using a collective buffer, the overall variance will be much less than the addition of individual variances allowing a smaller buffer to be used. Again Goldratt recommends simply using half the length of the critical chain. Since our critical chain is 75 days, a 37.5 day project buffer is placed at the end of the schedule to protect the system. Shown in Figure 14 below,
112.5 days is the total time which should be the estimated time to complete the project. Note that 112.5
days is what the project manager should communicate to everyone involved as the end goal. So using CC we not only went from 140 days down to 112.5 days in schedule, but we now have a better protected project increasing the likelihood of meeting the end-date.
SL(25) S2(15)
- -'Cntical Chain
- JS4(30) PB (37.5)
S3 (15) S2 (15)
112.5 Days
Step 4: Place Feeder/Resource Buffers
The final step in constructing a CC schedule is to protect the critical chain using feeder buffers (FB) and resource buffers (RB). Feeder buffers are placed anywhere you have merging paths in the system. Of course one of those merging tasks will be non-critical and it is the job of the feeder buffer to provide contingency to keep the non-critical tasks off the critical path. In Figure 15 below, a feeder buffer has been placed on the first branch after SI to ensure S2 can always begin once work finishes on the second branch. Feeder buffers are sized similar to the project buffer, by taking half the existing chain length.
I
S1(25) FB (12.5) 52(15) Critical Chain _ S4(30) PB (37.5) S3(15) 52(15)11
RE
RB
RE
Figure 15: Add Feeder/Resource Buffers
While feeder buffers store actual product in the system, resource buffers are simply team communication points to ensure resources are ready to accept the approaching work in the critical chain. The project manager or resource manager is responsible for alerting the successor on the critical chain that the predecessor is almost done and so be prepared to drop everything and work your portion of the critical path. Goldratt recommends using a five day resource buffer on most projects. So when S3 is five days away from completion, visibility to the expected completion should be provided to S2 so that S2 can prepare to accept the upcoming critical work.
3.2.1 Monitoring a Critical Chain Project
Now that we have explained how the schedule has been optimized and made achievable during planning, this section gives a high level overview of how to monitor the schedule during project completion. Again turning to our example in Figure 16 below, Goldratt recommends managing the project by monitoring the buffers. He recommends breaking all buffers in the system into three decision zones each 1/3 the size of the buffer being monitored. If the project has penetrated only the first 1/3 of the buffer no action is required, hence the name "OK". If the middle third is penetrated, the team should form a plan in case further buffer is used. This portion of the monitor chart is termed the "Watch andPlan" portion. If the
buffer used exceeds the first 2/3 of the buffer, the team must act immediately to avoid further erosion of the schedule. This last zone is called the "Act" zone.
(125) 52 52
Watch &
OK
Plan
- - Critical Chain 7A)Act
SI
FBm
S;3 Remaining Project Buffer Remaining Feeder Buffer 12.5 9 18Figure 16: Monitor the Buffers
This buffer monitoring method protects the overall system, without micromanaging the individual tasks in a project so everyone on the team knows what is expected of them.
3.4 Critical Chain Summary
CPM requires the team to identify the predecessor/successor constraints (task durations) to produce the longest path needed to complete the project. CCM takes this one step further and considers both technical and resource dependencies along the critical path to determine the overall program duration. So the first major advantage of CCM is that resource conflicts and multitasking are eliminated on the critical chain schedule. Having identified the proper order and priority of each task, CCM next requires that the team better protect the schedule from variation. By using a collective project buffer, CCM takes advantage of the fact that the overall variance of the project will always be less than the addition of individual variances. This new aggregate buffer, or team buffer, also places tension in the schedule with each individual task owner, helping to reduce the effects of Parkinson's Law's and the Student Syndrome. A third advantage of CCM is the use of feeder buffers and resource buffers to protect the critical tasks and eliminate the problems of the additive rule discussed earlier. Feeder buffers protect the start dates from secondary feeder lines and resource buffers provide team visibility to ensure critical tasks are worked
S4 PB(3
37.5 25
when the predecessor task is complete. The fourth and final advantage of CCM is the team behavior it drives. How a coach may lead a track relay race is an analogy often used to describe CCM.
- The only goal in a relay race is for the team of runners to get the baton over the finish line as fast as possible. In CCM terms the finish line is the estimated team completion date (112.5 days in the example above).
- In a relay race it is the previous runner's job to get the baton in the hands of the next runner as soon as possible. Use of a team project buffer encourages everyone to complete their task as soon as possible. Use of resource buffers ensures communication of the approaching work.
- Once a runner receives the baton he/she must begin to run their part with no distractions. The critical tasks are the runners and the feeder and resource buffers are the tools used to ensure there are no distractions.
As explained above, the goal of CCM is to produce a better project management solution aimed at producing more realistic schedule dates, protecting the system from variation, and encouraging and rewarding team behavior. While CCM implementation seems simple on paper, replacing existing project management methods within organizations requires leadership and time to really change the cultural thinking of an organization. Chapters 6 and 7 will mainly deal with the challenges of critical chain implementation within the Intel I/Q organization. Before we discuss the implementation of critical chain let's go back to the first critical step of project planning, to properly identify the problem/project.
4.0 Observations of the Current Reality
Given the task of developing a project management solution better able to reduce the time (duration) and variability associated with I/Q durations, the first objective was to better define the problem. The first
few months of the internship were spent observing the current I/Q duration management reality within Fab 24 to better understand the problem. Below are some of the quantitative and qualitative results from those observations.
4.1 Collected Duration Data Analysis
Around Boeing, the author's current employer, an expression you always hear is "the data will set you free." So what better way to size-up the problem than to first analyze duration and variability data sets from past technology ramps within the I/Q organization. To meet confidentiality concerns small parts of the analysis are shared below, but provide a good picture of historical I/Q duration records.
4.1.1 Duration Data
Presented in Figure 17 below is a table showing Install duration data captured by I/Q during a recent technology ramp. Although the data are from Ireland I/Q, similar analysis was conducted on Intel I/Q worldwide revealing comparable results. To understand the Install table let's start out by defining the shown percentages as the actual duration divided by the expected duration. The expected or Virtual Fab(VF) durations are based of numbers established by Intel's R&D production facility. The credibility
of these expected durations will be discussed in section 4.2 below.
% ActualDuration
Expected or VFDuration
Notice that Prefacilitisation is not included because its duration does not really become critical until the multi-million dollar tool arrives. Down the left side of the table are the production tools grouped into six main functional areas in a microprocessor production line. Note that under each functional area resides multiple tool families and each tool family contains multiple individual production tools. These
individual production tools are further defined as ETS, ETS+ 1, and Ramp tooling. Early tool set (ETS) tools are the production tools initially needed by the factory to bring the initial production line up. The next classification, ETS+ 1, is just as the name implies: the next single tool for a particular family to meet
a future production capacity rate. The remaining tool family tools are classified as Ramp tools since they are brought in to accommodate the future increases in microprocessor demand from the factory.
Installation
Process Area I
ETS 74% ETS+1 76% Rame 47%Process Area2
ETS 91% Rampi 121%Process Area 3
ETS 78% Rampl 84%Process Area 4
ETS 91% ETS+1 79% Rampi 73%P rocess Area
6
ETSa 77% ReMPI 76%Process Area 6
ETSI78%
1ETS4-11 76%4 Rampi71%Total
78%
DayS
8 Days AheadFigure 17: Historical Duration Data
Looking at the total across the bottom of the figure, on average Install finished eight days ahead of VF expected schedule. Unfortunately similar data was collected for SQual and IQual and on average both stages exceeded expected delivery dates. Even with the eight days freed-up by Install, the data clearly indicated the overall I/Q process on average exceeded the expected VF duration. This pattern was consistent across microprocessor process areas. Within each process area on average there are only slight differences between ETS, ETS+1, and Ramp tools. A slight learning curve does appear as you go from
ETS to Ramp tools. In summary, looking at the collected data, on average individual process tools fail to
meet expected VF durations during the I/Q process.
4.1.2 Variation Data
With the duration data indicating an inherent problem with the I/Q process, the next step was to analyse the same data sets for variation. Figure 18 is histogram showing collected duration data for a single tool family. For this particular tool family the chart shows the duration almost follows a bell-shaped
distribution with a tool taking 35 days to as many as 240 days to get through the I/Q process. On average the tool comes in at approximately 130 days which is far greater then the VF total duration of 99 days, indicated by the vertical line.
18% 14% 12% E 10% 8% T_ 4% 2% 0% ______
I
0.0 50D 100 D 150D 200D 250.0 Duration (days)Figure 18: Variation Data Example
4.2 Duration Management
-
Low Priority
Armed with what was initially thought to be very powerful duration data, the author next approached various Fab 24 I/Q and Production employees to seek their thoughts on the numbers. Surprisingly the majority knew of the long-standing duration management concerns, but few considered the issue urgent or important to Intel for two reasons. First, the data was challenged because the VF duration was used as the expected duration for comparison of each tool. At the production plant level across Intel many conducting the I/Q work are skeptical of the VF durations generated by the technology development center. The second explanation for poor duration performance was that the individual tool durations do not matter, what matters is that the entire production line ramp duration meets assigned cost, schedule, and quality demands. At Fab 24 and across Intel, I/Q organizations have a good reputation for meeting assigned production capacity targets.
So once Intel decides to release a new microprocessor technology who decides these schedule production targets?
From discussions with I/Q, Finance, and Production Planning, the below flow chart was generated. Notice that the development site determines the HVM project ramp planning assumptions and the timelines from first tool dock to start of production ramp. Fab 24 management then determines when the tools are needed in the factory to meet the required VF output requirements assigned to that factory based on rates from the development site. Finally, I/Q Planning backs out the final I/Q schedule based on tool order and project/site logistics.
Technolo gy Development Site Establishes Technology Specific Ramp Plannmg Assumptions (HVM ramp planning assumptions and timelines)
Fab24 Management Generates Capacity Need Dates and Numbers of Tools / (when tools are required in the factory)
I/Q Planning Schedules Tool Installation and Qualification (tool I/Q schedules to meet specific need dates)
Figure 19: Ramp Schedule Generation
Going back to the lack of urgency and importance around tooling I/Q durations, the production line ramp schedule is set outside the I/Q group, the current project managing methods meet those established targets, and at the individual tool family level, project team members conducting the I/Q work are sceptical of the expected durations in a HVM environment. Most have the impression that the current system works so why change? Putting this question on hold until section 4.4, the next section will cover the identified process related reasons for the large amounts of variation in I/Q process.
4.3 Duration Variation Contributors
Although many did not see a need to change the current project management methods, many identified with the large amounts of variation which occur during the I/Q process. Below are the four top identified reasons for I/Q duration variability.
4.3.1 Working on the Technology Frontier
Earlier it was said that Moore's Law is really a self-fulfilling prophecy. Intel continues to push itself and its suppliers up the curve through continuous microprocessor technology ramps. With each new
technology release, production tools are pushed to operate at the high end of their specification limits. Qualifying these sensitive machines is a grey area which is prone to producing high levels of installation time variation. Occasionally you will get what is known as a "dog tool". These problem tools take days or weeks to and fix and can really disrupt the I/Q process. Looking once again at Figure 18, the tools in the tail of the normal distribution most likely were "dog tools".
4.3.2 "Copy Exactly" Specifications
Working at the technology forefront, microprocessor production is an art form very sensitive to small changes and not completely understood. Intel has capitalized on this misunderstanding through the use of Copy Exactly (CE). Developed during the 1980's and implemented across Intel in the 1990's, CE is a
factory build strategy credited with enabling the company to bring factories online quickly with high yields. [Intel.com, 2 March 2005] CE basically means all fabrication sites, for a particular technology, are nearly identical to each other so that mistakes are not repeated and products are consistent across sites.
All production sites are mirrored after the Technology Development R&D plant line used to develop the
new technology specifications. Below is an excerpt from Intel's website indicating the magnitude of oversight provided by CE.
"When "Copy Exactly" was first implemented, only equipment and process output parameters were copied exactly to the high-volume plant. During the last decade, Intel has widely expanded the functions that were duplicated in high-volume factories. Now, everything at the development plant -the process flow, equipment set, suppliers, plumbing, manufacturing clean room, and training methodologies -is selected to meet high volume needs, recorded, and then copied exactly to the high-volume plant." [Intel.com, 2 March 2005]
While the net result of CE is reduced quality variation across production plants, CE does contribute to individual tool installation duration variation. Meeting such exact standards requires large amounts of oversight and when problems are found, time is always sacrificed to ensure CE specifications are met.
CE also requires increased quality checks leading us into our next variation source; workforce
coordination.
4.3.3 Workforce Coordination
Because most microprocessor production tools are extremely complicated and unique, each of the four stages of I/Q requires the coordination of highly skilled crafts, technicians and engineers from all over the world. Existing planning and project management methods lack sufficient communication between Install, SQual, and IQual. From observations the three stages were planned and managed almost independently of each other. Combining this "over the fence" planning and management style with the large amounts of variation in the system, the effects of Parkinson's Law, Student Syndrome, multitasking and the additive rule discussed in Chapter 2 further magnify the variation.
4.3.4 The Working Environment
Finally the installation and qualification of production tools takes place in a dynamic environment. For starters microprocessors must be made in an ultra-clean environment to protect the microscopic circuitry. This means the production tools must be installed and qualified in an environment extremely sensitive to vibration and dust. To further complicate matters, the production facility ramps to meet capacity. That means tool installation occurs next to existing running production machines. So, something as simple as
drilling a hole becomes very complicated requiring training and oversight because it has the potential to bring down the whole production plant. To protect production, I/Q must notify and/or seek permission for many of the installation procedures. Because production has microprocessor demands, permission is often not granted forcing a complete stop in the installation process. It is not uncommon for the Install team to wait days and sometimes weeks at a time to finally get permission to conduct an hour-long job.
4.4 The Buffer Protects
Going back to the question presented at the end of section 4.2, if the current I/Q system achieves Intel targets why must it change? The author would argue there are significant amounts of buffer in the system to protect technology ramps and in the future these buffers may not be as large. How else could a system accommodate the large amounts of duration variations shown in Figure 18 and the missed schedule durations shown in Figure 17 and still meet end targets?
Intel has always been a powerful force in the microprocessor market. At the close of 2004, Intel maintained 82.3% of the world's microprocessor market share. [Hachman, 2005] In such a powerful position you can understand not needing to run a "lean" I/Q process. In fact to protect themselves from cannibalizing their existing product lines, it is in Intel's best interest to pace new microprocessor
technology introductions. As shown in their extreme use of CE, product yield (quality) is also extremely important to Intel during a technology ramp. To protect quality, Intel buffers customer need dates and places requirements for redundant tools sets (RTS) in the production system to protect internal capacity targets.
To finish answering the question above, Advanced Micro Devices (AMD) maintains the other 16.6% of the market share and has the potential to claim even more in the future. [Hachman, 2005] Remember that it is in the customers' best interest to have competition in the market place.
4.5
Observations Summary
As an outsider, looking at the above data trends one might conclude Intel's I/Q process was out of control and in need of immediate attention. As a new I/Q employee, the author was surprised to quickly learn that this was not the current feeling inside Intel. Through interviews and daily communication with various I/Q and production employees the author found that most knew of the duration management concerns, but few considered them urgent or important. Across Intel in fact, I/Q organizations are known for meeting expected end cost, schedule and quality targets.
One explanation for this relaxed attitude is based on a heavily protected technology ramp schedule. Schedule buffer and tool capacity buffers are added to protect the existing product lines, promised
customer dates, and to ensure high quality products are released. As competition in the industry continues to climb, Intel must examine ways to reduce their costs and time-to-market which will involve
re-examining their current buffer strategies. The author believes this thinking is what generated his assignment in Ireland.
Focusing on the process related activities which add variation to the I/Q process, working on the
technology frontier, meeting CE specifications, coordinating a highly specialised workforce and working in an extremely sensitive environment were identified as the top contributors. Focused on these variation contributors, the next step was to develop possible solutions.
5.0
Overview of Proposed Solutions
Knowing there was by no means a cultural ground swell around the issue of duration management, it was important that proposed solutions obtain support from the workforce implementing the improvements. Given location within the company and a short six-month timeline, the author chose to focus on the workforce and environment sources of variation addressed above.
5.1 Workforce Variation
-
Project Management Changes
Observing the current I/Q project management methods, this is the area marked by poor initial planning, ineffective schedule protection, and a failure to take advantage of teamwork. To tackle workforce coordination issues the intern host site manager asked that the author focus on refining current I/Q project management methods. The first step was to examine a recent checklist implementation success.
5.1.1 Building on Past Checklist Success
Prior to the internship, Fab 24's I/Q organization had begun piloting a new project management process using critical path checklists for individual tool families. The intention of the checklist was to better integrate the four stages of I/Q. PF, Install, SQual, and IQual members were brought together into a room and allowed to integrate their individual critical path schedules into a single integrated checklist. They also captured all tool I/Q assumptions to ensure open understanding across the three I/Q stages. From these planning discussions they were able to optimize the critical path. This method was implemented on a single tool family during a recent technology ramp and below is capture comparison data similar to the analysis in section 4.1.
Ins * Si" 0 uIl I Qual A o71 Co MtCL
Betoro ICLA (1 tooIs 6O% 7$% 233% 143%
After ICLA 9 tooQs) 3$% $$% 102%45
Before
(Avg 138
days)
p4.4*~J
~2WT~F7
00 ~0 icoo tS3i~ Z~0 2~
0~.v t~m~ ~E&ys
After
(Avg gg days)
... .. ... 4 1
CI
0.0 5040 1000 15040 200D 250
fluratiolt tdyqft
Figure 20: Initial Checklist Results
From the data above, you will notice dramatic duration and variation effects between the 13 tools before checklist implementation and the 9 tools after. The strength of the checklist above was from improving the initial planning of the I/Q schedule. Once planning was complete the three stages went back to individual project management efforts during implementation. The new integrated schedule also did not better protect the project schedule from variation, relying on individuals to protect their individual tasks. Although the results of the upfront planning met targets, this was for a single tool family during a slow time in the I/Q organization and under the current buffers of the technology ramp. Simply implementing the above checklist procedure during a new technology ramp across hundreds of tools would not be as fruitful. The addition of the checklist also ensured that the overall dock to MRCL duration was met for this tool type by focusing on the more predictable activities of Install and Supplier Qual to give buffer protection to the more variable activity of Intel Qual and from this success to promote the continued use in the Intel Qual activities.
5.1.2 Aspects of Critical Chain
Wanting to build on the groups' initial success, the author began exploring the use of critical chain within the organization. For reasons discussed in Chapter 3, the end goal of critical chain implementation was improved planning, team communication, and schedule protection. Following similar procedures
discussed in section 3.2, Figure 21 shows a simplified picture of an I/Q process using critical chain. First during planning the I/Q stages consolidate their individual construction (Const), supplier, and process engineering (PE) checklists (CL) and determine the overall team schedule, buffers and assumptions. Second, a project champion is identified to lead planning and implementation of the new integrated checklist and assumptions (ICLA) project management tool. Third, the integrated checklist is used to monitor team performance using percent tasks complete and percent buffer used on the critical path items.


![Figure 3: Immutable Laws of Project Management Ihttp://ifaq.wap.org/science/lawprojman.html]](https://thumb-eu.123doks.com/thumbv2/123doknet/14032399.458303/12.918.101.805.139.983/figure-immutable-laws-project-management-ihttp-science-lawprojman.webp)
![Figure 5: Distribution of Possible Task Duration Outcomes [Jacobs, 1997]](https://thumb-eu.123doks.com/thumbv2/123doknet/14032399.458303/14.918.236.698.578.822/figure-distribution-possible-task-duration-outcomes-jacobs.webp)

![Figure 11: Distribution of Possible Task Duration Outcomes [Jacobs, 1997]](https://thumb-eu.123doks.com/thumbv2/123doknet/14032399.458303/21.918.227.654.149.375/figure-distribution-possible-task-duration-outcomes-jacobs.webp)