Publisher’s version / Version de l'éditeur:
Vous avez des questions? Nous pouvons vous aider. Pour communiquer directement avec un auteur, consultez la
première page de la revue dans laquelle son article a été publié afin de trouver ses coordonnées. Si vous n’arrivez
Questions? Contact the NRC Publications Archive team at
[email protected]. If you wish to email the authors directly, please see the first page of the publication for their contact information.
https://publications-cnrc.canada.ca/fra/droits
L’accès à ce site Web et l’utilisation de son contenu sont assujettis aux conditions présentées dans le site
LISEZ CES CONDITIONS ATTENTIVEMENT AVANT D’UTILISER CE SITE WEB.
Microscopy and Microanalysis, 27, 1, pp. 149-155, 2020-11-20
READ THESE TERMS AND CONDITIONS CAREFULLY BEFORE USING THIS WEBSITE. https://nrc-publications.canada.ca/eng/copyright
NRC Publications Archive Record / Notice des Archives des publications du CNRC :
https://nrc-publications.canada.ca/eng/view/object/?id=5d07835b-749b-471c-b003-3130393832e6 https://publications-cnrc.canada.ca/fra/voir/objet/?id=5d07835b-749b-471c-b003-3130393832e6
This publication could be one of several versions: author’s original, accepted manuscript or the publisher’s version. / La version de cette publication peut être l’une des suivantes : la version prépublication de l’auteur, la version acceptée du manuscrit ou la version de l’éditeur.
For the publisher’s version, please access the DOI link below./ Pour consulter la version de l’éditeur, utilisez le lien DOI ci-dessous.
https://doi.org/10.1017/S1431927620024666
Access and use of this website and the material on it are subject to the Terms and Conditions set forth at
Higher-order structure of human chromosomes observed by electron
diffraction and electron tomography
Hayashida, Misa; Phengchat, Rinyaporn; Malac, Marek; Harada, Ken;
Akashi, Tetsuya; Ohmido, Nobuko; Fukui, Kiichi
For Peer Review
The higher-order structure of human chromosomes observed by electron diffraction and electron tomography
Journal: Microscopy and Microanalysis Manuscript ID MAM-20-X-176.R2
Manuscript Type: Original Article Date Submitted by the
Author: n/a
Complete List of Authors: Hayashida, Misa; NRC;
Phengchat, Rinyaporn; Kobe University Malac, Marek; NRC
Harada, Ken; RIKEN Akashi, Tetsuya; Hitachi Ltd
Ohmido , Nobuko ; Kobe University, Graduate School of Human Development and Environment
Fukui, Kiichi; Osaka University, Graduate School of Pharmaceutical Sciences
Keywords: Chromosomes, TEM, Electron diffraction, Electron Tomography Keywords: FIB/SEM, 3D structure, Higher-order structure, Chromatin fibres
Abstract:
It is well known that two DNA molecules are wrapped around histone octamers and folded together to form a single chromosome. However, the nucleosome fiber folding within a chromosome remains an enigma and the higher-order structure of chromosomes also is not understood. In this study, we employed electron diffraction (ED) which provides a non-invasive analysis to characterize the internal structure of
chromosomes. The results revealed the presence of structures with 125 to 150 nm periodic features directionally perpendicular to the
chromosome axis in unlabelled isolated human chromosomes. We also visualized the 100 to 200 nm periodic features perpendicular to the chromosome axis in an isolated chromosome whose DNA molecules were
For Peer Review
and 1 MeV transmission electron microscopes.For Peer Review
1 The higher-order structure of human chromosomes observed by electron diffraction and electron 2 tomography
3 Misa Hayashida1*++, Rinyaporn Phengchat2++, Marek Malac1,6, Ken Harada3, Tetsuya Akashi4, Nobuko
4 Ohmido2, Kiichi Fukui5*
5 1 NRC-NANO, National Research Council, 11421 Saskatchewan Drive, T6G 2M9, Edmonton, Alberta,
6 Canada
7 2 Graduate School of Human Development and Environment, Kobe University, 3-11 Tsurukabuto,
Nada-8 ku, 657-8501, Kobe, Japan
9 3 Center for Emergent Matter Science (CEMS), RIKEN, Hatoyama, Saitama 350-0395, Japan
10 4 Research & Development Group, HITACHI, Ltd., Hatoyama, Saitama 350-0395, Japan
11 5 Graduate School of Pharmaceutical Sciences, Osaka University, 1-6 Yamadaoka, Suita 565-0871,
12 Osaka, Japan
13 6 Department of Physics, University of Alberta, Edmonton, T6G 2E1, Canada
14 ++ Equally contributed
15 *Corresponding authors 16
17 Abstract
18 It is well known that two DNA molecules are wrapped around histone octamers and folded together to 19 form a single chromosome. However, the nucleosome fiber folding within a chromosome remains an 20 enigma and the higher-order structure of chromosomes also is not understood. In this study, we employed 21 electron diffraction (ED) which provides a non-invasive analysis to characterize the internal structure of 22 chromosomes. The results revealed the presence of structures with 125 to 150 nm periodic features 23 directionally perpendicular to the chromosome axis in unlabelled isolated human chromosomes. We also 24 visualized the 100 to 200 nm periodic features perpendicular to the chromosome axis in an isolated 25 chromosome whose DNA molecules were specifically labelled with OsO4 using electron tomography
26 (ET) in 300 kV and 1 MeV transmission electron microscopes.
27 1. Introduction
28 The higher-order structure of chromosomes—i.e. their internal structure on a length scale of tens to 29 hundreds of nanometers—has been an enigma for over a century. Several models have been proposed to 30 explain how a chromosome is organized (Beseda et al., 2020; Fukui & Uchiyama, 2007; Ushiki et al., 31 2002). Models of chromosome higher-order structure are based on the same fundamental premise of DNA 32 wrapping around histones to form nucleosomes. Nucleosomes are connected by links of DNA forming a 33 ‘beads-on-a-string’ structure, referred to as an 11-nm chromatin fiber based on the 11- nm diameter of 34 nucleosomes. From this starting point, the proposed models differ in how the 11-nm chromatin fibers are
For Peer Review
35 folded into a chromosome. The hierarchical folded-fiber models describe the formation of chromatin 36 fibers at a length scale beyond 11-nm, including 30-nm and 100-200-nm chromatin fibers. The formation 37 of a 30-nm chromatin structure is reported repeatedly using reconstituted chromatin (Robinson et al., 38 2006; Schalch et al., 2005; Song et al., 2014) and chromatin extracted from human cells (Cano et al., 39 2006; Hancock, 2012; Zhou et al., 2019). The 30-nm chromatin fiber has been detected using various 40 visualizing techniques including scanning electron microscopy (SEM) (Inaga et al., 2007; Taniguchi & 41 Takayama, 1986; Wanner et al., 2005), transmission electron microscopy (TEM) (Maeshima & Eltsov, 42 2008; Maeshima et al., 2005; Marsden & Laemmli, 1979) and TEM tomography (Harauz et al., 1987). 43 Additionally, the 30-nm chromatin fibers are found in situ in some organisms, for example in avian 44 erythrocyte and in the sperm of starfish and sea cucumbers (Woodcock, 1994). Larger chromatin
45 structures (100-700 nm) consisting of 30-nm fibers have also been reported (Ohnuki, 1968; Taniguchi & 46 Takayama, 1986; Ushiki et al., 2002), although they have been disputed by other results (Joti et al., 2012). 47 On the contrary, recent study using polymer modeling shows that if the chromatin fibers are organized 48 following the hierarchical model, they will be overly restricted and cannot reproduce the chromatin 49 interaction as obtained from Hi-C analysis. Therefore, an alternative model describing that the mitotic 50 chromosome consists of arrays of consecutive chromatin loops, has been proposed (Naumova et al., 51 2013). The chromatin loops are arranged disorderly way, having diameters between 5 to 25 nm (Ou et al., 52 2017; Wako et al., 2020) . The higher-order chromatin structures including 30-nm chromatin fibers were 53 not detected in mitotic chromosomes by cryo-EM (Eltsov et al., 2008; Maeshima et al., 2010) and small-54 angle X-ray scattering (SAXS) (Nishino et al., 2012). The reason for the inconsistencies might arise from 55 artifacts caused by the sample preparation. Chromosome dehydration is considered to be one of the 56 sources of artifacts (Kaneyoshi et al., 2015; Maeshima & Eltsov, 2008). To eliminate dehydration related 57 artifacts, we treated the chromosomes isolated from HeLa cells with ionic liquid, according to the study 58 by Dwiranti et al. (Dwiranti et al., 2012). Ionic liquids are known to coat the exterior and penetrate the 59 interior of the chromosomes, and they are compatible with vacuum conditions in an electron microscope 60 (Ishigaki et al., 2011; Kuwabata et al., 2006; Tsuda et al., 2011; Welton, 1999).
61 Electron diffraction (ED) is frequently used for studying periodicity and orientation of periodic structures 62 of an object. Electron beams offer the advantage of focusing to a small probe. Small-angle x-ray
63 scattering (SAXS), a family of x-ray scattering techniques, has been utilized to investigate the presence 64 of 30-nm chromatin fibers in the past (Chicano et al., 2019; Dwiranti et al., 2012; Nishino et al., 2012). 65 However, forming a small probe with x-rays is difficult. SAXS typically collects average data from 66 thousands of chromosomes suspended in a liquid at random orientations relative to the incident x-ray 67 beam and the x-ray detector. Unlike SAXS, information from an individual chromosome can be acquired 68 by ED in a TEM, because an electron beam can be focused on a small area of the sample (much less than 69 1 µm with a small beam convergence angle that is needed to study large periodicities of the chromosome 70 sample). In addition, it is possible to switch the operating mode of a TEM between the image mode (real 71 space) to the diffraction mode (reciprocal space). Obtaining both ED and an image from exactly the same 72 area of a chromosome and placing the electron probe onto the precise region of the individual
73 chromosome is critical to understanding the relationship between the chromosome axis direction which is 74 vertical direction of chromosomes and the direction of the periodic features observed in the ED patterns. 75 Electron tomography (ET) in a transmission electron microscope (TEM) enables visualization of the 76 structure of an object in three dimension (3D) at high spatial resolution. Using a dual beam— i.e. a
For Peer Review
77 focused ion beam (FIB) instrument with an SEM column—an individual chromosome can be located and 78 placed onto a 360° rotation ET sample holder then observed over a full tilt range (±90°) (Tanigaki et al., 79 2015; Tsuneta et al., 2014). The full tilt range ET allows us to overcome the loss of structural information 80 due to the missing wedge of data and enables us to obtain reconstruction of the chromosome that has 81 isotropic resolution in 3D. Typical chromosome thickness (700 nm or so) is larger than optimum for a 82 medium energy (300 keV) microscope, and this leads to an inelastic background in the images. ED is less 83 sensitive than imaging to sample thickness and is capable of detecting periodic features throughout the 84 thickness of the sample (Jiang et al., 2010).
85 Therefore, we observed structures in unstained chromosomes using ED. Structures with 125 to 150 nm 86 periodic features perpendicular to the chromosome axis were observed in an unlabelled individual 87 chromosome observed by ED with a very high camera length. Additionally, we observed individual 88 metaphase chromosomes labelled with OsO4 from HeLa cells using the ET in both 300 keV and 1 MeV
89 transmission electron microscopes. The use of 1 MeV of energy allows for the investigation of samples 90 with a greater thickness than that allowed by the 300 keV microscope. In the same way as for the ED 91 results, a chromosome extracted from a TEM grid using a dual beam instrument and placed onto a 360˚ 92 continuous rotation holder (Tanigaki et al., 2015; Tsuneta et al., 2014; Yaguchi et al., 2008) also had 100 93 to 200 nm periodic features perpendicular to a chromosome axis. The ED and ET ability to detect
94 periodicity of structure internal to an object, as opposed to on its surface, is an important advantage of ED 95 and ET over scanning electron microscopy (SEM) (Taniguchi & Takayama, 1986) and atomic force 96 microscopy (AFM) (Ushiki et al., 2002) of chromosomes.
97 98
99 2. Materials and Methods
100 2.1 Sample preparation
101 To prepare labelled chromosomes for ET, human chromosomes were isolated from HeLa cells and stored 102 in a polyamine buffer solution (PA chromosomes) as described in Hayashihara et al. (Hayashihara et al., 103 2008). The buffer solution containing the chromosomes was then dropped onto Carbon/Fomvar support 104 film on a TEM grid on ice and fixed with 2.5% glutaraldehyde for 1 hour. Chromosomes were labelled 105 using ChromEM, a DNA-labeling method developed for electron microscope observation (Ou et al., 106 2017). After the glutaraldehyde fixation, chromosomes on the TEM grid were labelled with DRAQ5 107 (Abcam), a DNA-specific fluorescence dye. The grid was then transferred into a glass bottom dish 108 containing 2.5 mM diaminobenzidine (DAB, Sigma) in ice-cold 0.1 M sodium cacodylate buffer. The 109 dish was placed under a fluorescence microscope (BX60, Olympus) and chromosomes werefluorescence 110 illuminated continuously with a Cy5 filter set for 20-30 min using a 40x objective lens. Polymerized DAB 111 precipitated on chromosomes made the chromosomes appear brownish. After DAB polymerization, the 112 chromosomes were rinsed with a 0.1M sodium cacodylate buffer and labelled with 2% osmium tetraoxide 113 (OsO4, Electron Microscopy Sciences) in 0.15 M sodium cacodylate for 30 min. The chromosomes were
114 washed with milli-Q water before being treated with 0.5% BMI-BF4 (ionic liquid, (Dwiranti et al., 2012;
115 Welton, 1999)) in milli-Q water for 1 min at room temperature. Excess ionic liquid solution was removed 116 from the Carbon/Fomvar support film by blotting with cut filter paper, followed by drying in a desiccator 117 equipped with a vacuum pump for 2 hours. For ET, a chromosome was transferred from the
118 Carbon/Fomvar support film and transferred to a 360˚ rotation holder in a focused ion beam instrument 119 using the method described in our previous paper (Phengchat et al., 2019). Nano dot markers (Hayashida
For Peer Review
120 et al., 2014) were fabricated on the carbon support film near the chromosome for the alignment of 121 tomography tilt series images.
122 For the preparation of unlabelled chromosomes for ED, human chromosomes were isolated from HeLa 123 cells and dropped onto Carbon/Fomvar support film on a TEM grid on ice. The samples were then fixed 124 with 2.5% glutaraldehyde for 1 hour on ice. After the washing of glutaraldehyde, the unlabeled
125 chromosomes were directly treated with 0.5% ionic liquid (BMI-BF4), followed by drying in a vacuum
126 desiccator for 2 hours. ED of the chromosomes was observed directly on the Carbon/Fomvar support film 127 without a transfer onto the 360° rotation tomography holder.
128 2.2 Electron diffraction
129 ED measurements were performed in a Hitachi HF-3300 TEM operated at 300 kV acceleration voltage. 130 The diffraction patterns were collected from unlabelled chromosomes using a Gatan Ultrascan 1000TM
131 slow scan CCD camera binned by a factor of 2 to 1024 x 1024 pixels. The diffraction camera length of 132 L=23.4 m was obtained by adjusting the projector lens current in a free-lens control mode of the
133 microscope. The large camera length, together with the high brightness cold field emission source of the 134 Hitachi HF-3300, is needed to detect the presence of features with tens to hundreds of nanometers of 135 periodicity, i.e. to study spatial frequencies from ~0.1 to less than 0.01 nm-1. In a typical set-up for ED,
136 such large features are buried in the tails of the un-scattered electron beam because the diffraction camera 137 length L is normally less than 3 m. The electron beam was focused into a 750-nm diameter probe placed 138 within a chromosome to prevent diffraction features arising from the edge of a chromosome. The rotation 139 angle between features in a diffraction pattern and the corresponding image that arises due to the use of 140 magnetic lenses in the free lens mode of the TEM was calibrated using a multi-wall carbon nanotube 141 sample. All diffraction patterns reported in this paper were compensated for the rotation angle between 142 the image and the corresponding diffraction pattern.
143
144 2.3 Electron tomography
145 Electron tomography requires the acquisition of a tilt series of TEM images. Typically, low contrast 146 biological samples are stained by a heavy metal (e.g. OsO4). The heavy metal staining can lead to a
147 sample mass thickness that is too large for a medium (e.g. 300 keV) incident electron energy. To ensure 148 that the features we observed were not artifacts of multiple scattering in a sample with large mass 149 thickness, we observed the samples in microscopes operating at 300 keV and 1 MeV. At 1 MeV, the 150 observable sample thickness increased as compared to that at 300 keV because of the increase in the 151 elastic and inelastic mean free path. We also kept the OsO4 concentration low to keep the sample mass
152 thickness acceptable for imaging at 300 kV.
153 A Hitachi HF-3300 TEM was operated at 300 kV acceleration voltage. A continuous 360˚ rotation holder 154 (Yaguchi et al., 2008) was used to collect a tomographic tilt series of the chromosome images stained 155 with OsO4. Sufficient contrast was obtained in TEM images to observe 100-200 nm periodic structure
156 although the chromosome was rather thick for a 300 keV TEM. The presence of the features was
For Peer Review
158 a continuous 360˚ rotation TEM tomography holder (Tanigaki et al., 2015; Tsuneta et al., 2014). A 159 tomography series consisting of 61 images was collected with a 3° tilt step (Hayashida & Malac, 2016; 160 Hayashida et al., 2018) over the entire 0° to 180° tilt range at both microscopes. The pixel number for 161 HF-3300 and 1MeV FE-TEM were 1024 x 1024 pixels with 4.366 nm/pixel in a Gatan Ultrascan 1000TM
162 slow scan CCD camera and 3710×3838 pixels with a 1.77 nm pixel size in a Gatan direct exposure K2 163 camera, respectively. The Simultaneous Iterative Reconstruction Technique (SIRT), as implemented in 164 Composer and Visualizer by TEMography.com, was used for reconstruction of all the tilt series and 165 visualization of the tomograms.
166
167 3. Results
168 3.1 Human chromosomes observed by electron diffraction (ED)
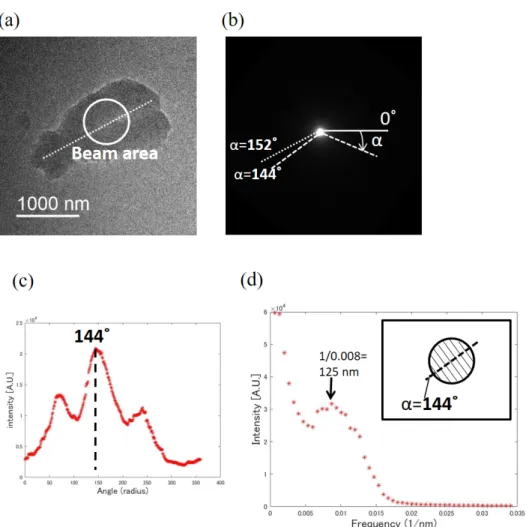
169 Isolated human chromosomes were first examined with ED. In order to optimize the interpretable signal, 170 unlabelled chromosomes were used. Mass thickness of a labelled chromosome is large, leading to large 171 fraction of electrons suffering multiple scattering in the sample and difficult interpretation. Images of the 172 unlabelled chromosomes and the corresponding diffraction pattern are shown in Figs. 1a and 1b,
173 respectively. A circle in Fig. 1a represents an area irradiated by an electron beam probe while collecting 174 the ED pattern, and the dotted line was drawn manually along a chromosome axis which is approximately 175 parallel to the long arm of the chromosome. The pixel with the maximum intensity was selected as a 176 center of the diffraction pattern in Fig. 1b. To detect the presence of features with 100 to 300 nm 177 periodicity within a chromosome (Taniguchi & Takayama, 1986; Ushiki et al., 2002), the measured 178 diffraction intensity was integrated over a scattering angle range from 0.0033 to 0.1 nm-1 at each
179 azimuthal angle α as shown in Fig. 1c. The maximum peak in such spatial frequency-integrated 180 diffraction was detected using an in-house developed MatlabTM code. In this case, the strongest peak
181 appeared at 144˚, as shown in Fig 1c. A line profile along the dashed lines α=144˚ in Fig. 1b is shown in 182 Fig. 1d. A broad peak shown in Fig. 1d indicates that there are features with an approximately 125 nm 183 period at α=144˚, i.e. in a direction nearly parallel to the chromosome axis (α=152 ˚). The dashed line in 184 the diagram on the right top corner in Fig. 1d represents the direction at α=144 ˚, and the solid lines show 185 the 125 nm periodic features which are perpendicular to the dashed line. The circle is the same size as the 186 beam area in Fig. 1a. It means that in the beam area in Fig. 1a, there would be fewer than 6 periods of the 187 125 nm features within the electron beam probe. Similar periodic features, with 150 and 133 nm
188 periodicity, were also observed in other chromosomes as shown in Figs. S1 and S2.
189 The diffraction data indicates that the 125 nm periodic features are directionally oriented because they 190 appear only at a particular direction. If the 125 nm periodic features were perfectly oriented against the 191 Carbon/Formvar film, we could see peaks at both 144˚ and 324˚ (=144˚ +180˚). However, since the 192 sample is somewhat tilted relative to the incident electron beam, there may be considerable excitation 193 error (Reimer & Kohl, 2008), and therefore we cannot detect the diffraction peak at 324˚. Unlike in 194 material science crystalline samples such as silicon and gold thin films, it is difficult to compensate for 195 the excitation error in an experiment on chromosomes due to the poor visibility caused of the weak 196 diffraction pattern features. As a result, only one of the two (complex conjugate) features was observed in 197 our current results (Reimer & Kohl, 2008).
For Peer Review
198
199 3.2 Human chromosomes observed by electron tomography (ET)
200 Isolated human chromosomes whose DNA molecules were labelled with OsO4 were observed with ET
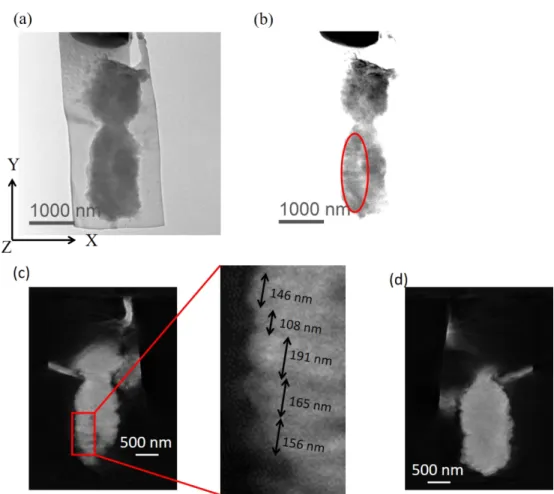
201 using 300keV TEM. Figs. 2a and 2b show a TEM image and the contrast adjusted image of the
202 chromosome. Periodic features with 100 to 200 nm were observed in the long arm. Fig. 2c and 2d- are Z 203 slice images from the reconstructed tomogram. The slices are closer to both the top and bottom surfaces 204 (Carbon/Formvar film). While the periodic features are visible in Fig 2c, there are no clearly observable 205 features in Fig 2d. When isolated chromosomes are placed on the film, their bottom sides become 206 flattened to maximize their contact with the support film to reduce surface energy (Hayashida et al., 207 2015). As a result, the bottom side of each chromosome was flatter than their top surface that was not in a 208 contact with a film. As a result, the periodic features were not visible at the bottom side of chromosomes 209 that is in contact with the support film. Presumably, the features would be observable on both the top and
210 the bottom for a chromosome in liquid vitrified by High pressure freezing (McDonald & Auer, 2006)
211 although we have to be careful if the procedure changes chromosome structures.
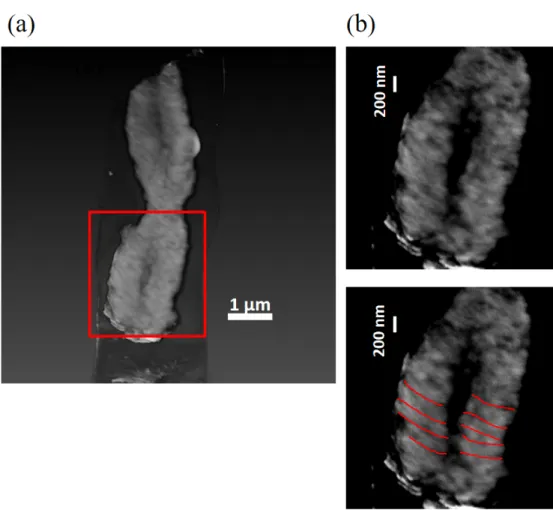
212 Fig. 3a shows a tomogram of another isolated human chromosome observed with ET using 1 MeV TEM. 213 The chromosome was transferred from the same TEM grid as the chromosome shown in Fig. 2a. Both the 214 upper and lower images in Fig. 3b were extracted from Fig. 3a, and their contrast was enhanced. Periodic 215 features with 100 to 200 nm were also observed as marked by red lines in the lower image in Fig. 3b. 216
217 4. Discussion
218 In this study, we utilized the advantages of electron diffraction (ED) and electron tomography (ET) to 219 examine how nucleosome fibers are organized inside a single chromosome. In unlabeled chromosomes, 220 the diffraction intensity peaks corresponding to more than 125 nm periodic feature (e.g. 133 nm and 150 221 nm) were detected from several isolated chromosomes. Similar periodic features were also observable in
222 OsO4-DNA labelled chromosomes in TEMs with 300 kV and 1 MV acceleration voltages. We refer to the
223 more than 100 nm and less than 200 nm periodic features as “Structure A”.
224 Although we did not detect a visible contrast of Structure A in TEM images of unlabelled chromosomes 225 in Fig. 1a, S1a and S2a, all ED patterns show a peak between 100-200 nm. It suggests that the peaks of 226 ED patterns were generated by the density change due to presence of Structure A within the
227 chromosomes. Moreover, the results show that presence of Structure A is not an artifact due to staining as 228 the samples were unstained.
229 Structure A could possibly correspond to the gyres (a repeating structure on DT40 chromosomes-DAPI 230 stained) as reported (Gibcus et al., 2018), and the gyres of coils in spiralized chromosomes reported 231 (Ohnuki, 1968). The gyres visualized in chromosome arms corresponded to the helical arrangement of 232 chromatin loop arrays emanating from a central spiral-staircase (condensin) scaffold (Gibcus et al., 2018). 233 The polymer simulation model predicted that the pitch of the (condensin) scaffold helix could be
234 increased from 100 nm to 200 nm upon prolonged colcemid treatment. We observed Structure A in ED 235 and ET and it oriented nearly perpendicular to the chromosome axis. Therefore, we consider that these
For Peer Review
236 features could correspond to the chromatin loop arrays. However, we hypothesized that the condensation 237 status of observed chromosomes (our isolated chromosomes were in a hypercondensed state of 16 h 238 colcemid treatment compared to 1-2.5 h colcemid treatment in previous studies) together with the fixation 239 method between glutaraldehyde and the acid-based fixative could be a reason for the visualization of 240 obvious ~200 nm periodic features. Chromatin loop arrays in each turn of the scaffold helix in our 241 chromosome samples could be tightly packed so that we were unable to observe discrete gyres or 242 spiralized chromosomes. Structure A that we found in this study coincides with the presence of a helical 243 scaffold with ~200 nm pitch in our previous report (Phengchat et al., 2019). By considering the scaffold 244 structure (Phengchat et al., 2019) and the results reported here, both structures of the scaffold and 245 chromatin fibers appear to present the same ~200 nm periodic structure. This suggests that Structure A is 246 a stack of chromatin loop arrays in each turn of the helical chromosome scaffold. It would be worth 247 continuing to develop techniques to simultaneously visualize how nucleosome fibers interact with the 248 chromosome scaffold inside the chromosome.
249 Previous study had observed a fairly homogenous distribution of chromatin fibers inside a human 250 metaphase chromosome using an electron micrograph (Harauz et al., 1987). The chromosomes were 251 prepared from spreads of metaphase lymphocytes on a water surface and absorbed onto TEM grids. The 252 unfixed chromosomes proceeded to ethanol dehydration and critical point drying and were directly 253 observed in TEM without metal staining. The electron micrograph of chromatids clearly showed tangled 254 chromatin fibers that were 30-35 nm in size (Harauz et al., 1987). On the other hand, our ET result 255 showed chromosomes with 100-200 nm of repeated features along the chromatid length. These features 256 were arranged almost perpendicular to the chromosome axis. The slice image (Fig. 2d) appears uniform
257 with no obvious internal structure, At this point, we hypothesize that the fiber-like features are tightly
258 packed, resulting in extremely low variation in sample mass thickness that in turn makes it impossible for
259 the interface between the fiber-like features to be detected. Compared with fibrous chromosome structure 260 as reported in Harauz et al. (Harauz et al., 1987), a factor contributing to the different results would be the 261 sample preparation, including fixation, dehydration and staining. Aldehyde-based fixatives performed 262 significantly better in preserving the cellular structure than did organic solvents (Hobro & Smith, 2017). 263 As the chromosome is mainly composed of proteins, glutaraldehyde fixation cross-linking between amino 264 acid groups should be able to keep it intact. Dehydration and critical point drying in the previous study
265 might introduce cavities into the chromosome, allowing individual ca. 30-35 nm chromatin fibers to be
266 visible.Chen et al. (Chen et al., 2017) provided the information of human prophase chromosome structure
267 through the observation of resin-embedded B lymphocytes with serial block-face scanning electron
268 microscopy (SBF-SEM). Despite the presence cavities found inside the chromosomes, chromosomes
269 were densely packed with more than 90% of chromosome volume was occupied by chromosomal
protein-270 DNA complex (Chen et al., 2017). In addition, when applied to the unfixed chromosome sample, the 271 dehydration and drying could possibly caused the chromosome structure to shrink and collapse, so that 272 the chromosome could be observed even in 100 kV TEM. Besides the difference in fixative and
273 dehydration, the DAB polymer specifically deposited on DNA in the chromosome was bound by heavy
274 metal OsO4, through OsO4 intensification. This procedure specifically enhances the contrast of chromatin
275 fibers to be observed in TEM. On the other hand, the contrast from the unstained chromosomes in the 276 previous report (Borland et al., 1988) was due to the structure of both nucleosome fibers and other 277 chromosomal proteins. The contrast in the entire chromosomes was obvious increased in
For Peer Review
279 Small-angle X-ray scattering (SAXS) and ultra-SAXS (USAXS) analysis were employed to determine the
280 existence of periodic structures inside the chromosome (Chicano et al., 2019; Nishino et al., 2012). Data
281 obtained from both techniques, supporting cryo-EM observations, suggests that human mitotic
282 chromosomes are composed of irregularly folded nucleosome fibers, rather than 30-nm chromatin fibers
283 or regular structures in the range of 50-1000 nm (Chicano et al., 2019; Nishino et al., 2012). In this study,
284 ED was used to detect any periodic structures inside a single chromosome which the orientation of the
285 chromosome toward the incident electron beam could be managed. Thus, we ensured the presence of
286 Structure A being 150-200 nm in size in each chromosome. The peaks from Structure A were not as sharp
287 as those from metal crystal samples because there are only 5-6 periods in the beam irradiated areas and
288 each piece is not the exact same size. However, the peaks were observed only from the specific direction
289 which is nearly parallel to the chromosome axis — that is, the structures are nearly perpendicular to the
290 chromosome axis.
291 Combining results obtained from ED and ET, it appears that chromatin loop arrays emanating from the 292 central chromosome scaffold are gathered into stacks with the height comparable to the pitch of the 293 helical scaffold (100-200 nm).
294
295 5. Conclusion
296 We found that there are 100 to 200 nm periodic features, “Structure A” perpendicular to a chromosome 297 axis of OsO4 labelled samples by ET. Structures with 125 to 150 nm periodic features perpendicular to the
298 chromosome axis were also observed in an unlabelled isolated chromosome observed by ED. The 299 structure of the scaffold with similar periodicity was also observed in our previous paper (Phengchat et 300 al., 2019). It therefore emphasizes the essential role of chromosome scaffold in the mitotic chromosome 301 formation. This result might be related to other results (Chicano et al., 2019; Daban, 2015; Gibcus et al., 302 2018) which showed the fibers or plains along a chromosome axis. We will continue to study both 303 structures of DNA fibers and scaffold to solve the enduring enigma of the chromosome structure. 304
305
306 Acknowledgements
307 This work was supported by the Japan Society for the Promotion of Science (JSPS) KAKENHI
308 (A25252064, 2012 to 2016) and the Japan Science and Technology Agency (JST) SICORP (17935614, 309 2017 to 2022) to Kiichi Fukui and The Mitsubishi Foundation: 202010011 to Nobuko Ohmido.
310 311
For Peer Review
313 Figure 1 (a) A TEM image of the unlabelled chromosome. The circle represents an area irradiated by an 314 electron beam for ED. (b) An ED pattern from (a). (c) Sum of intensity between 0.0033 and 0.1 and nm-1
315 at each angle:α. (d) Line profile along the line at α=144˚ in (a).
316 Figure 2 (a) A TEM image of a chromosome labelled with OsO4. (b) Contrast enhanced image of (a). (c)
317 and (d) Z slice images from the tomogram of the chromosome. (c) is closer to the top surface of the 318 chromosome and (d) is closer to the bottom surface (Formvar/Carbon film).
319 Figure 3 (a) A tomogram of a chromosome labelled with OsO4. (b) Contrast enhanced images extracted
320 from (a). Both images are the same. Lines were drawn in the lower image. 321
322 Figure S1
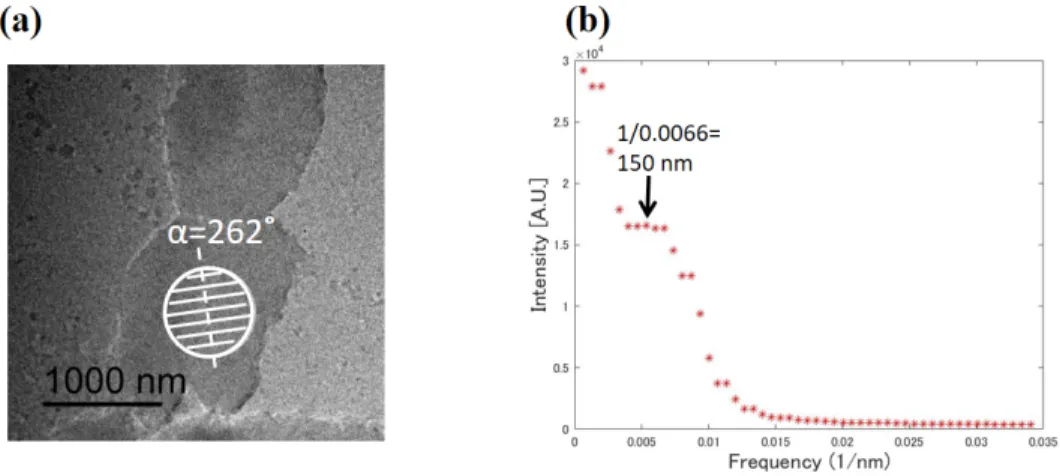
323 (a) A TEM image of the unlabelled chromosome. The circle represents an area irradiated by an electron 324 beam for ED. (b) Line profile along the line at α=262˚ from the diffraction pattern from the circle area in 325 (a).
326
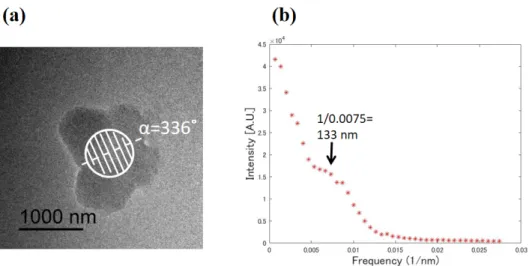
327 Figure S2
328 (a) A TEM image of the unlabelled chromosome. The circle represents an area irradiated by an electron 329 beam for ED. (b) Line profile along the line at α=336˚ from the diffraction pattern from the circle area in 330 (a).
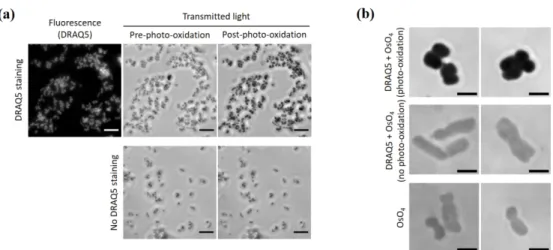
331 Fig. S3 ChromEM staining in isolated chromosomes (a) Isolated chromosomes either with or without
332 DRAQ5 staining were visualized under optical microscope (40Х objective lens) before and after
photo-333 oxidation. Scale bar = 5 µm (b) Isolate chromosomes visualized with transmitted light under optical
334 microscope (100Х objective lens) after OsO4 intensification. Scale bar = 2 µm
335
336 References
337 Beseda, T., Cápal, P., Kubalová, I., Schubert, V., Doležel, J. & Šimková, H. (2020). Mitotic chromosome 338 organization: General rules meet species-specific variability. Comput. Struct. Biotechnol. J. 339 Borland, L., Harauz, G., Bahr, G. & Heel, M.v. (1988). Packing of the 30 nm chromatin fiber in the human 340 metaphase chromosome. Chromosoma 97, 159-163.
341 Cano, S., Caravaca, J.M., Martin, M. & Daban, J.R. (2006). Highly compact folding of chromatin induced 342 by cellular cation concentrations. Evidence from atomic force microscopy studies in aqueous 343 solution. Eur Biophys J 35(6), 495-501.
344 Chen, B., Yusuf, M., T. Hashimoto, Estandarte, A., Thompson, G. & Robinson, I. (2017).
Three-345 dimensional positioning and structure of chromosomes in a human prophase nucleus. Sci. Adv.
346 3, e1602231.
347 Chicano, A., Crosas, E., Oton, J., Melero, R., Engel, B.D. & Daban, J.R. (2019). Frozen-hydrated chromatin 348 from metaphase chromosomes has an interdigitated multilayer structure. EMBO J 38(7).
For Peer Review
349 Daban, J.R. (2015). Stacked thin layers of metaphase chromatin explain the geometry of chromosome 350 rearrangements and banding. Sci Rep 5, 14891.
351 Dwiranti, A., Lin, L., Mochizuki, E., Kuwabata, S., Takaoka, A., Uchiyama, S. & Fukui, K. (2012). 352 Chromosome observation by scanning electron microscopy using ionic liquid. Microsc. Res. 353 Tech. 75(8), 1113-1118.
354 Eltsov, M., MacLellan, K.M., Maeshima, K., Frangakis, A.S. & Dubochet, J. (2008). Analysis of
cryo-355 electron microscopy images does not support the existence of 30-nm chromatin fibers in mitotic 356 chromosomes in situ. PNAS 105, 19732–19737.
357 Fukui, K. & Uchiyama, S. (2007). Chromosome Protein Framework from Proteome Analysis of Isolated 358 Human Metaphase Chromosomes. Chem. Rec. 7, 230-237.
359 Gibcus, J.H., Samejima, K., Goloborodko, A., Samejima, I., Naumova, N., Nuebler, J., Kanemaki, M.T., Xie, 360 L., Paulson, J.R., Earnshaw, W.C., Mirny, L.A. & Dekker, J. (2018). A pathway for mitotic
361 chromosome formation. Science 359(6376).
362 Hancock, R. (2012). Structure of metaphase chromosomes: a role for effects of macromolecular 363 crowding. PLoS One 7(4), e36045.
364 Harauz, G., Borland, L., Bahr, G.F., Zeitler, E. & Heel, M.v. (1987). Three-dimensional reconstruction of a 365 human metaphase chromosome from electron micrographs. Chromosoma 95, 366-374.
366 Hayashida, M., Kumagai, K. & Malac, M. (2015). Three dimensional accurate morphology measurements 367 of polystyrene standard particles on silicon substrate by electron tomography. Micron 79, 53-58. 368 Hayashida, M. & Malac, M. (2016). Practical electron tomography guide: Recent progress and future 369 opportunities. Micron 91, 49-74.
370 Hayashida, M., Malac, M., Bergen, M. & Li, P. (2014). Nano-dot markers for electron tomography formed 371 by electron beam-induced deposition: nanoparticle agglomerates application. Ultramicroscopy
372 144, 50-57.
373 Hayashida, M., Ogawa, S. & Malac, M. (2018). Evaluation of electron tomography reconstruction
374 methods for interface roughness measurement. Microscopy Research Technique 81(5), 515-519. 375 Hayashihara, K., Uchiyama, S., Kobayashi, S., Yanagisawa, M., Matsunaga, S. & Fukui, K. (2008). Isolation 376 method for human metaphase chromosomes. Protoc. Exch., 166.
377 Hobro, A.J. & Smith, N.I. (2017). An evaluation of fixation methods: Spatial and compositional cellular 378 changes observed by Raman imaging. Vib. Spectrosc. 91, 31-45.
379 Inaga, S., Tanaka, K. & Ushik, T. (2007). Transmission and scanning electron microscopy ofmammalian 380 metaphase chromosomes. In: Fukui, K and Ushiki T eds. FL, USA: Boca Raton: CRC Press.
381 Ishigaki, Y., Nakamura, Y., Takehara, T., Nemoto, N., Kurihara, T., Koga, H., Nakagawa, H., Takegami, T., 382 Tomosugi, N., Miyazawa, S. & Kuwabata, S. (2011). Ionic liquid enables simple and rapid sample 383 preparation of human culturing cells for scanning electron microscope analysis. Microsc Res 384 Tech 74(5), 415-420.
385 Jiang, H., Chen, J. & Malac, M. (2010). Study of the Rhodium Nanoparticles in ZrO2-CeO2 Based Catalytic 386 Materials using Nano Beam Diffraction and High Resolution TEM. Microsc. Microanal. 16, 1514-387 1515.
388 Joti, Y., Hikima, T., Nishino, Y., Kamada, F., Hihara, S., Takata, H., Ishikawa, T. & Maeshima, K. (2012). 389 Chromosomes without a 30-nm chromatin fiber. Nucleus 3(5), 404-410.
390 Kaneyoshi, K., Fukuda, S., Dwiranti, A., Kato, J., Otsuka, Y., Takata, H., Uchiyama, S., Ogawa, S. & Fukui, K. 391 (2015). Effects of dehydration and drying steps on human chromosome interior revealed by 392 focused ion beam/scanning electron microscopy (FIB/SEM). Chromosome Sci. 18, 23–28. 393 Kawasaki, T., Matsui, I., Yoshida, T., Katsuta, T., Hayashi, S., Onai, T., Furutsu, T., Myochin, K., Numata, 394 M., Mogaki, H., Gorai, M., Akashi, T., Kamimura, O., Matsuda, T., Osakabe, N., Tonomura, A. &
For Peer Review
395 Kitazawa, K. (2000a). Development of a 1 MV field-emission transmission electron microscope. J. 396 Electron Microsc. 6, 711-718.
397 Kawasaki, T., Yoshida, T., Matsuda, T., Osakabe, N. & Tonomura, A. (2000b). Fine crystal lattice fringes 398 observed using a transmission electron microscope with 1 MeV coherent electron waves. Appl. 399 Phys. Lett. 76, 1342-1344.
400 Kuwabata, S., Kongkanand, A., Oyamatsu, D. & Torimoto, T. (2006). Observation of Ionic Liquid by 401 Scanning Electron Microscope. Chem. Lett. 35(6), 600-601.
402 Maeshima, K. & Eltsov, M. (2008). Packaging the genome: the structure of mitotic chromosomes. J 403 Biochem 143(2), 145-153.
404 Maeshima, K., Eltsov, M. & Laemmli, U.K. (2005). Chromosome structure: improved immunolabeling for 405 electron microscopy. Chromosoma 114(5), 365-375.
406 Maeshima, K., Hihara, S. & Eltsov, M. (2010). Chromatin structure: does the 30-nm fibre exist in vivo? 407 Curr Opin Cell Biol 22(3), 291-297.
408 Marsden, M.P. & Laemmli, U.K. (1979). Metaphase chromosome structure: Evidence for a radial loop 409 model. Cell 17, 849-858.
410 McDonald, K.L. & Auer, M. (2006). High-Pressure Freezing, Cellular Tomography, and Structural Cell 411 Biology. BioTechniques 137, 137-143.
412 Naumova, N., Imakaev, M., Fudenberg, G., Zhan, Y., Lajoie, B.R., Mirny, L.A. & Dekker, J. (2013). 413 Organization of the Mitotic Chromosome. Science 342, 948-953.
414 Nishino, Y., Eltsov, M., Joti, Y., Ito, K., Takata, H., Takahashi, Y., Hihara, S., Frangakis, A.S., Imamoto, N., 415 Ishikawa, T. & Maeshima, K. (2012). Human mitotic chromosomes consist predominantly of 416 irregularly folded nucleosome fibres without a 30-nm chromatin structure. EMBO J 31(7), 1644-417 1653.
418 Ohnuki, Y. (1968). Structure of chromosomes I. Morphological studies of the spiral structure of human 419 somatic chromosomes. Chromosoma (25), 402–428.
420 Ou, H.D., Phan, S., Deerinck, T.J., Thor, A., Ellisman, M.H. & O'Shea, C.C. (2017). ChromEMT: Visualizing 421 3D chromatin structure and compaction in interphase and mitotic cells. Science 357(6349). 422 Phengchat, R., Hayashida, M., Ohmido, N., Homeniuk, D. & Fukui, K. (2019). 3D observation of
423 chromosome scaffold structure using a 360 degrees electron tomography sample holder. Micron
424 126, 102736.
425 Reimer, L. & Kohl, H. (2008). Transmission Electron Microscopy. Springer-Verlag New York.
426 Robinson, P.J.J., Fairall, L., T, H.V.A. & Rhodes, D. (2006). EM measurements define the dimensions of 427 the “30-nm” chromatin fiber Evidence for a compact, interdigitated structure. PNAS 103(17), 428 6506-6511.
429 Schalch, T., Duda, S., Sargent, D.F. & Richmond, T.J. (2005). X-ray structure of a tetranucleosome and its 430 implications for the chromatin fibre. Nature 436(7047), 138-141.
431 Song, F., Chen, P., Sun, D., Wang, M., Dong, L., Liang, D., Xu, R.-M., Zhu, P. & Li, G. (2014). Cryo-EM Study 432 of the Chromatin Fiber Reveals a Double Helix Twisted by Tetranucleosomal Units. Sience 344, 433 376-380.
434 Tanigaki, T., Takahashi, Y., Shimakura, T., Akashi, T., Tsuneta, R., Sugawara, A. & Shindo, D. (2015). 435 Three-dimensional observation of magnetic vortex cores in stacked ferromagnetic discs. Nano 436 Lett 15(2), 1309-1314.
437 Taniguchi, T. & Takayama, S. (1986). High-ordcr structure of rectaphase chromosomes: Evidence for a 438 multiple coiling model. Chromosoma 93, 511-514.
439 Tsuda, T., Nemoto, N., Kawakami, K., Mochizuki, E., Kishida, S., Tajiri, T., Kushibiki, T. & Kuwabata, S. 440 (2011). SEM observation of wet biological specimens pretreated with room-temperature ionic 441 liquid. Chembiochem 12(17), 2547-2550.
For Peer Review
442 Tsuneta, R., Kashima, H., Iwane, T., Harada, K. & Koguchi, M. (2014). Dual-axis 360 degrees rotation 443 specimen holder for analysis of three-dimensional magnetic structures. Microscopy 63(6), 469-444 473.
445 Ushiki, T., Hoshi, O., Iwai, K.I., Kimura, E. & Shigeno, M. (2002). The structure of human metaphase 446 chromosomes: its histological perspective and new horizons by atomic force microscopy. Arch. 447 Histol. Cytol. 65(5), 377-390.
448 Wako, T., Yoshida, A., Kato, J., Otsuka, Y., Ogawa, S., Kaneyoshi, K., Takata, H. & Fukui, K. (2020). Human 449 metaphase chromosome consists of randomly arranged chromatin fibres with up to 30-nm 450 diameter. Sci Rep 10(1), 8948.
451 Wanner, G., Schroeder-Reiter, E. & Formanek, H. (2005). 3D analysis of chromosome architecture: 452 advantages and limitations with SEM. Cytogenet Genome Res 109(1-3), 70-78.
453 Welton, T. (1999). Room-Temperature Ionic Liquids. Solvents for Synthesis and Catalysis. Chem. Rev. 99, 454 2071-2083.
455 Woodcock, C.L. (1994). Chromatin Fibers Observed In Situ in Frozen Hydrated Sections. Native Fiber 456 Diameter Is Not Correlated with Nucleosome Repeat Length. J. Cell Biol. 125(1), 11-19.
457 Yaguchi, T., Konno, M., Kamino, T. & Watanabe, M. (2008). Observation of three-dimensional elemental 458 distributions of a Si device using a 360 degrees -tilt FIB and the cold field-emission STEM system. 459 Ultramicroscopy 108(12), 1603-1615.
460 Zhou, Z., Li, K., Yan, R., Yu, G., Gilpin, C.J., Jiang, W. & Irudayaraj, J.M.K. (2019). The transition structure 461 of chromatin fibers at the nanoscale probed by cryogenic electron tomography. Nanoscale 11, 462 13783 - 13789.
For Peer Review
Figure 1 (a) A TEM image of the unlabelled chromosome. The circle represents an area irradiated by an electron beam for ED. (b) An ED pattern from (a). (c) Sum of intensity between 0.0033 and 0.1 and nm-1 at
For Peer Review
Figure 2 (a) A TEM image of a chromosome labelled with OsO4. (b) Contrast enhanced image of (a). (c) and (d) Z slice images from the tomogram of the chromosome. (c) is closer to the top surface of the
For Peer Review
Figure 3 (a) A tomogram of a chromosome labelled with OsO4. (b) Contrast enhanced images extracted from (a). Both images are the same. Lines were drawn in the lower image.
For Peer Review
Figure S1 (a) A TEM image of the unlabelled chromosome. The circle represents an area irradiated by an electron beam for ED. (b) Line profile along the line at α=262˚ from the diffraction pattern from the circle
For Peer Review
Figure S2 (a) A TEM image of the unlabelled chromosome. The circle represents an area irradiated by an electron beam for ED. (b) Line profile along the line at α=336˚ from the diffraction pattern from the circle
For Peer Review
Fig. S3 ChromEM staining in isolated chromosomes (a) Isolated chromosomes either with or without DRAQ5 staining were visualized under optical microscope (40Х objective lens) before and after photo-oxidation. Scale bar = 5 µm (b) Isolate chromosomes visualized with transmitted light under optical microscope (100Х