HAL Id: insu-01369637
https://hal-insu.archives-ouvertes.fr/insu-01369637
Submitted on 5 Aug 2020
HAL is a multi-disciplinary open access
archive for the deposit and dissemination of
sci-entific research documents, whether they are
pub-lished or not. The documents may come from
teaching and research institutions in France or
abroad, or from public or private research centers.
L’archive ouverte pluridisciplinaire HAL, est
destinée au dépôt et à la diffusion de documents
scientifiques de niveau recherche, publiés ou non,
émanant des établissements d’enseignement et de
recherche français ou étrangers, des laboratoires
publics ou privés.
Physical roles of Interstellar-origin Pickup Ions at the
Heliospheric Termination Shock: Impact on the Shock
Front Microstructures and Nonstationarity
Bertrand Lembège, Zhongwei Yang
To cite this version:
Bertrand Lembège, Zhongwei Yang. Physical roles of Interstellar-origin Pickup Ions at the Heliospheric
Termination Shock: Impact on the Shock Front Microstructures and Nonstationarity. The
Astrophys-ical Journal, American AstronomAstrophys-ical Society, 2016, 827 (1), pp.73. �10.3847/0004-637X/827/1/73�.
�insu-01369637�
PHYSICAL ROLES OF INTERSTELLAR-ORIGIN PICKUP IONS AT THE HELIOSPHERIC TERMINATION
SHOCK: IMPACT ON THE SHOCK FRONT MICROSTRUCTURES AND NONSTATIONARITY
Bertrand Lembège1and Zhongwei Yang2
1
LATMOS/IPSL/UVSQ/CNRS, F-78280 Guyancourt, France;bertrand.lembege@latmos.ipsl.fr
2
State Key Laboratory of Space Weather, National Space Science Center, Chinese Academy of Sciences, Beijing 100190, China;zwyang@spaceweather.ac.cn
Received 2016 March 7; revised 2016 June 1; accepted 2016 June 5; published 2016 August 9 ABSTRACT
The nonstationary dynamics of the heliospheric termination shock in the presence of pickup ions(PUI) is analyzed by using a one-dimensional particle-in-cell simulation code. This work initially stimulated by Voyager 2 data focusses on this nonstationarity for different percentages of PUIs and for different Alfvén Mach numbers MA. Solar wind ions(SWIs) and PUIs are described, respectively, as Maxwellian and shell distributions (with a zero/finite thickness). For a moderate MA, present results show that(1) the shock front is still nonstationary even in the presence of 25% of PUIs; its instantaneous velocity varies, which is in favor for shock multicrossing; (2) the presence of PUIs tends to smooth out the timefluctuations of fieldamplitude and of microstructurewidths at the front and overshoot;(3) the shock has a multiple overshoot, which is analyzed by identifying the contributions of SWIs and the PUIs;(4) as the PUI percentage increases, the shock moves faster and the downstream compression becomes weaker, which is explained by a Rankine–Hugoniot model; (5) the reflection rate of SWIs and PUIs decreases as the PUI percentage increases;(6) the shock structure is almost insensitive to the shell thickness;and (7) for the PUIs dominated shock case (PUI=55%), the shock becomes stationary. However, for higher MA regime, the front nonstationarity persists even in the PUI=55% case. In summary, high MAregime allows to compensate the smoothing of the microstructures and the time fluctuations of the shock front brought by the presence of PUIs.
Key words: acceleration of particles – plasmas – shock waves – Sun: heliosphere
1. INTRODUCTION
Collisionless shocks are of great interest since, within the shock transition, the bulk energy of the plasma is converted into thermal energy in absence of particle binary collisions (Tidman & Krall 1971; Lembège et al. 2004; Burgess et al.
2005). The terrestrial bow shock has received a lot of attention
since theearly works of Axford (1962and references
there-in,for theoretical predictions) and of Ness et al. (1964,for the
first in situ detection inspace). As the first frontier of our heliospheric system, the collisionless heliospheric termination shock(TS) representing the transition between the supersonic solar wind and the subsonic heliosheath has been crossed by Voyager 1 (V1) and Voyager 2 (V2) spacecraft. So far, fortunately, both the magnetometer (Burlaga et al. 2008) and
plasma instruments (Richardson et al.2008) on V2 work well
(the Plasma Science instrument on V1 failed in 1980 before the TS crossing;Stone et al.2005). A single crossing of the shock
front was expected, but V2 data reveals multi-crossings. Burlaga et al. (2008) have suggested that it could possibly
bedue to the self-reformation of the TS (Lembège & Dawson 1987; Lembège & Savoini 1992). However, many
questions on the TS nonstationarity still persist, and its impact on the energy partition between the different particle species needs to be clarified.
The TS is generally believed to be quasi-perpendicular at most heliospheric latitudes because of the shock’s large heliocentric distance and the Parker spiral structure of the heliospheric magnetic field. Burlaga et al. (2008) reported
microstructures in the magneticfield of the TS during its multi-crossings (on 2007 August 31–September 1 at a distance of 83.7 au from the Sun, where 1 au=146×106Km is the Earth–Sun distance). V2 data present clear-cut foot, ramp, overshoot–undershoot structures, which are typical features of
a supercritical quasi-perpendicular shock. It has been suggested that this shock may differ from other shocks because of the relatively large fraction of pickup ions(PUIs). PUIs are neutral atoms of interstellar-origin that are ionized in the heliosphere, picked up and convected back by the expanding solar wind. The pickup hydrogen population is expected to be the dominant pickup species at the TS because the percentage of pickup H+to solar wind ions(SWIs) at 50 au is estimated to be 10% and increases linearly with distance from the Sun (Vasyliunas & Siscoe 1976). The estimated percentage of
pickup H+at the TS is of the order of 25% of the SWI density. The compression ratio and temperature of the SWIs in the heliosheath are very low. Richardson et al. (2008) have
suggested that most of the upstream plasma bulk energy is transferred to the PUIs(throughout the text, we will use SWIs and PUIs to refer the H+ SWIs and the H+ PUIs respectively). Zank et al.(2010) have suggested that the microphysics of the
TS may play a key role in determining the shape of the total downstream (or heliosheath) proton distribution. These works gave us the motivation to study the impact of the turbulence created by the self-reformation on the local ion velocity distribution measured in the downstream region. However, as a first step, the present work is focused on a detailed analysis of the combined impact of the PUIs(in terms of percentage and of the PUIs shell distribution thickness) and of the shock front nonstationarity on the microstructures of a supercritical shock approaching the TS conditions.
The microstructures of the TS have been studied by hybrid and/or full particle-in-cell (PIC) simulations self-consistently including PUIs. Byusing ahybrid code, Liewer et al. (1993)
investigated the impact of PUIs on the TS for the first time. They found that the PUIs can lead to the formation of an extended foot of length, approximately equal to the gyroradius
of the PUIs. More recently, the dependency of energy partition in the presence of PUIs (where the percentage of PUIs ranges from 0 to 40) was further considered using one-dimensional (1D) hybrid simulations by Wu et al. (2009) and it was pointed
out that the downstream thermal energy ratio of PUIs ηPUI=PUI%(TdPUI-TuPUI)/[PUI%(TdPUI-TuPUI) + (100–
PUI%)(TdSWI-TuSWI)] is about 87% (for the case where the
percentage of PUI,“PUI%” throughout the text,equals 25), which is close to the energy fraction gain (>84%) for PUIs inferred from the V2 observations by Richardson et al.(2008).
However, electron dynamics and its coupling with ion dynamics should also be taken into account in order to fully understand energy dissipation across a shock front.
PIC simulations of the TS started about 10years ago (Chapman et al. 2005; Lee et al.2005). In contrast to hybrid
simulations, both electron and ion populations are taken into account as individual particles in PIC simulations, and the electrostatic potential jump at the ramp with awidth ofa few electron inertial lengths has been self-consistently reproduced (Matsukiyo et al. 2007). Matsukiyo & Scholer (2011) have
investigated the impact of PUIs on the TS by using a 1D PIC code. An extended foot due to reflected PUIs is clearly evidenced similar to that mentioned in early hybrid simulations (Liewer et al. 1993). They have found that in the 30% PUIs
case, about 90% of the total thermal energy gain in the downstream shocked region is attributed to the PUIs, while only a little under 10% to the SWIs. The energy gain of PUIs is a little higher than that calculated in previous hybrid simulations (Wu et al. 2009, 2010) due to the ramp width
obtained in the 1D PIC simulation, which scales over a few electron inertial lengths. Furthermore, they mentioned that the PUIs can be reflected not only at the ramp but also at the extended foot. Recently, Matsukiyo & Scholer (2014) have
extended their work, and have discussed the particle accelera-tion mechanisms at the front of the TS. Electron and PUIshock drift acceleration is evidenced and no evidence for theshock surfing acceleration of PUIs could be found. However, the PUIs used in previous PIC simulations are described by a thin-shell distribution(zero thickness of the shell), which may be a good approximation immediately after pickup of the ionized interstellar neutrals in the solar wind. The observed partial filling of the spherical shell distribution results from adiabatic cooling of the pickup ions as the solar wind expands (Mobius et al.1988; Burrows et al.2010). The underlying mechanisms
of how PUIs with a filled-in shell distribution (finite—instead of zero—thickness of the shell) affect the microstructures and the nonstationarity of the TS still remain unclear.
In this paper, by separating incident ions into reflected (R) and directly transmitted (DT) parts with the help of the automatic separation method(ASM; Yang et al.2009) inspired
by an early work of Burgess et al. (1989), we investigate the
impact of PUIs on the shock front self-reformation, on the microstructures and the density profiles of the SWI/PUIpo-pulation of the TS. Let us briefly review the ASM procedure used to identify the reflected (R). Two conditions must be satisfied: after being reflected (1) their velocity component vxis larger than the shock front velocity vshock(along the x axis)and (2) they are located upstream from the ramp (xi > xramp). It is important to notethat, when applying the criteria mentioned above (xi>xramp), the turning point of reflected ions can take place anywhere within the front without any a priori indication. Even an ion that has its turning point behind the ramp and
reaches the ramp after turning toward upstream, will be selected as a reflected ion. Main questions addressed herein are:(1) Does the self-reformation persist in the presence of a noticeable percentage of PUIs? If yes, how are the micro-structures of the shock front distorted in time?(2) What is the impact of different Mach number regimes versus different PUIpercentages on these microstructures? And (3) what is the impact of the PUIshell thickness on the results? The paper is organized as follows. In Section 2, we briefly describe the numerical simulation conditions. The impact of the different percentages of PUIs and the nonstationarity of the TS on the scales and the local amplitude of the shock microstructures is detailed in Section 3 for a moderate Mach number regime. Section 4presents a comparative analysis between moderate/ high Mach number cases. The main features of the SWI-dominated and PUI-SWI-dominated shocks are presented in Section 5. The impact of the thickness of the PUIvelocity shell distribution on the microstructures of TS, on its self-reformation and for different PUI% is studied is Section6. The discussion of the “supersonic” plasma flow observed by V2 (Richardson et al.2008) in the downstream region of the TS,
the interpretation of shock front multicrossing, and a comparison with previous works are presented in Section 7. Conclusions are summarized in Section8.
2. SIMULATION MODEL
We use a 1D electromagnetic PIC code to simulate the evolving structure of a supercritical, collisionless, perpend-icular shock. Herein, the shock is produced by the injection method as in previous PIC simulations (Lee et al. 2005; Matsukiyo et al. 2007; Yang et al. 2012a). In order to
reproduce self-consistently the impacts of PUIs, three parti-clespecies are introduced within our PIC code: electrons, SWIs, and PUIs. All particles are injected on the left-hand side of the simulation box with a inflow/upstream drift speed Vinj, and are reflected at the other end. The distribution functions for the SWIs and electrons are Maxwellian. PUIs are distributed on a sphere in velocity space centered at Vinjwith radius Vshellas in earlier works(Lee et al.2005; Matsukiyo & Scholer2011). The
shock front builds up and moves with a speed Vref from the right-hand to the left-hand side along the xaxis. The upstream Alfvénic Mach number of the shock is MA=(Vinj+ Vref)/VA, where the Alfvén speed VA is equal to one. The ambiant magnetic field directed along the y direction is∣B0∣=1. All basic parameters are as follows.Plasma box size length Lx=80c/ωpifor all different Mach number cases of concern herein; light velocity c=20, mass ratio mi/me=100, and the electron plasma to cyclotron frequency ratio ωpe/Ωce=2 (from Table2). The SWI beta βi=0.04 (ratio of the ion kinetic pressure over the magnetic pressure),which is inferred from Voyager data for TS-3 (Burlaga et al. 2008). Electron beta
βe=0.5 is chosen as in previous PIC simulations (Lee et al.2005). Initially, 200 particles (for each specie) are used in
a cell. The upstream plasma is quasi-neutral, i.e., ne=ni, where ni=nSWI+nPUI=NSWI×SWI% + NPUI×PUI%, where ne, ni, nSWI,and nPUIare the densities of the electrons (subscript “e”), of the total ions (subscript “i”), of the SWIs (subscript “SWI”), and of the PUIs (subscript “PUI”), respectively. NSWI, NPUI, SWI%,and PUI% are the counts of each species of ions and their relatively weighted percentage in the PIC simulation respectively. The simulation code includes an equal number of particles (hence NSWI=NPUI), but the
particle weight is changed in order to achieve different densities. In this paper, we perform four groups of runs (labeled 1–4, 5–8, 9–11, and 12–14 respectively). The main plasma parameters differentiating each group are summarized in Table 1. All upstream plasma parameters common to the different runs are detailed in Table2.
3. SIMULATION RESULTS: NONSTATIONARITY OF THE SHOCK FRONT FOR A MODERATE MACH
REGIME(MA∼5)
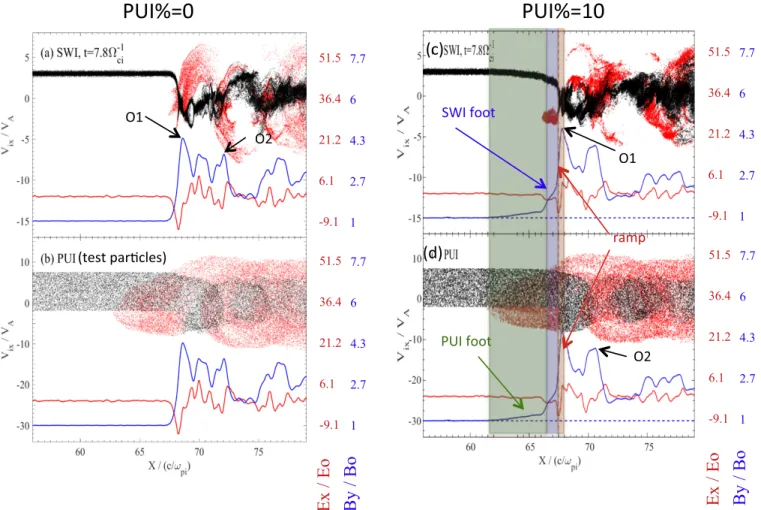
First, we study in detailthe microstructures of the shock front in the presence of PUIs by analyzing the self-consistent density profiles of the SWIand PUIpopulations. Figure 1(c)
shows the phase space plots of SWIs at one particular time (t=7.8 W
-ci 1) for the shock in the presence of 10% PUIs (run
2). Components of the main magnetic field By(blue curve) and of the cross-shockfield Ex(red curve) are shown for reference and shifted to the bottom of each plot. The magnetic field By profile exhibits a well defined PUI extended foot, an SWI foot, a ramp, and overshoot structures. The cross-shock electricfield strength E∣ x∣ reaches its maximum at the ramp(vertical dashed)
where the magnetic field ramp presents an inflexion point. In Figure 1(c), the incident SWIs are separated into two parts:
reflected R-SWIs (red dots) and directly transmitted DT-SWIs (black dots) as in Yang et al. (2009). It is clearly evidenced that
the reflected SWIs form the narrow SWI foot (blue area). Similar plots for PUIs are shown in Figure 1(d). In the same
way, the incident PUIs canalso be separated into two parts: reflected R-PUI (red dots) and directly transmitted DT-PUI (black dots). The reflected PUIs suffer a large gyromotion ahead of the ramp and form the extended PUI foot(green area). For both SWIs and PUIs in the downstream region, the reflected population is more energetic than the directly transmitted one. For comparison, Figures 1(a) and (b) show
similar plots for the case without PUIs (0%) and are used as reference; PUIs in Figure1(b) are test particles (with the same
injection conditions as for Figures 1(c) and (d)) used for
comparing their dynamics when interacting with the self-consistent shock profiles obtained when excluding or including the presence of PUIs.
We further quantitatively analyze the contributions of each population to the downstream structure of the TS front(run 3, PUI%=25) as shown in Figure 2 (left column). We again
divide each SWIand PUIpopulation into two parts (R and DT parts) and calculate their density profiles shown, respectively, in Figures 2(b) and (c) for SWIs and PUIs; these profiles are
reported in Figure 2(a) and are compared with the total ion
density (green curve) and the magnetic field (dark curve), which are quite similar; the multiple overshoot structure is identified by arrows “O1,” “O2,” and “O3.” This comparison allows usto stress out the following features.(1) Overshoots persist even in the presence of a noticeable percentage of PUIs and are mainly supported by the gyrating DT-SWIs.(2) At some time, the R-SWIs (red curve in panel (b)) slightly contribute during their gyromotion downstream to a sublet of peaks “O2” and “O3,” which merge intoeach other at later times as the SWIs propagate further downstream.(3) PUIs have downstream gyromotion (immediately behind the front) similar to that of SWIs, but no PUIs contribute to the different overshoots at any time of the run because of their relatively low downstream density (cyan curve in plot (a)).(4) The down-stream density profiles of R-PUIs and DT-PUIs (plot(c)) are anticorrelated witheach other, which is not the case between the profiles of R-SWIs and DT-SWIs (plot(b)).(5) The total density profile of PUIs increases with the PUI% in the extended foot but do not present any jump when crossing the shock front and stays approximately around thesame value when penetrat-ing downstream (plot (c)). An animation of Figure 2 (not
shown here) confirms that the overall microstructure of the shock front stays mainly controlled at any time by the DT-SWIs not only at the front(“O1”) but also further downstream (overshoots “O2” and “O3”). Notethat overshoots O1, O2, and O3 can also beidentified in Figures 1(a)–(b), but these are
exclusively due to SWIs since PUI%=0. By dividing again the SWI population into R and DT parts, a complementary analysis of the corresponding density profiles (for each population) and magnetic field profile (results not shown herein) clearly shows that O1, O2, and O3 are mainly supported by the DT-SWIs.
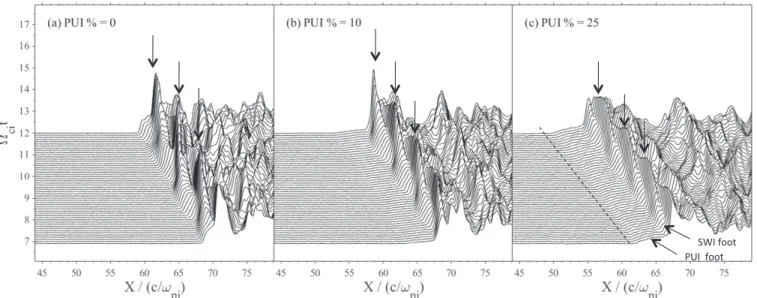
Second, we examine the impact of the relative percentage of PUIs on the shock front self-reformation. An overview of runs 1(0% PUIs), 2 (10% PUIs), and 3 (25% PUIs) shows the time stackplots of the main magnetic field By (Figure 3). In the absence of PUIs(Figure3(a)), the shock front is characterized
by a self-reformation process(time modulation of “O1”) with a cyclic period ofabout 1.73 Wci-1 (measured between two
successive vertical black arrows) where Ωciis the upstream ion gyro-frequency. The bulk velocity of the ions injected from the Table 1
List of the Different Runs of Concern in the Study with the Main Parameters Differentiating Each Run
PUI
PUI% d/Vshell Vinj MA Tref/Ωci
Run 1 0 0 3 4.78 1.73 Run 2 10 0 3 4.99 1.54 Run 3 25 0 3 5.26 1.40 Run 4 55 0 3 6.01 No Run 5 0 0 6 9.06 1.63 Run 6 10 0 6 9.08 1.50 Run 7 25 0 6 9.11 1.36 Run 8 55 0 6 9.52 1.19 Run 9 25 0.2 3 5.20 1.41 Run 10 25 0.5 3 5.15 1.43 Run 11 25 1 3 5.09 1.47 Run 12 25 0.2 6 9.07 1.44 Run 13 25 0.5 6 9.02 1.46 Run 14 25 1 6 8.97 1.50 Table 2
Upstream Plasma Parameters Defined for the 1D- PIC Simulation and Common to All Runs
Parameter Description Electrons SWIs PUIs vth Thermal velocity 7.07 0.2 Shell distribution λD Debye length 0.035 0.0071 ρc Gyroradius 0.0707 0.2 c/ωp Inertial length 0.1 1 ωc Gyro-frequency 100 1 ωp Plasma frequency 200 20 τc Gyro-period 0.01 1 β Plasma beta 0.5 0.04
left-hand side of the simulation box is Vinj=3 for all present cases. The shock propagates toward theleft-hand side with a velocity of ∼1.78, i.e., theAlfvén Mach number MA is about 4.78. Remember that the front self-reformation (due to the accumulation of reflected ions over a foot distance from the ramp) is a well known process and has been evidenced in 1D and 2D PIC simulations for a few decades (Biskamp & Welter 1972; Lembège & Dawson 1987; Lembège & Savoini
1992; Lembège et al.2009), and has been largely analyzed in
the absence of PUIs. In contrast with PIC simulations, the shock front nonstationarity was not analyzed(and not included) in previous hybrid simulations (Wu et al. 2009, 2010). One
main reason is that the spatial resolution used therein (space grid Δ=0.5 c/ωpi) was not high enough to initiate the self-reformation; then the smallest ramp thickness was limited to the space grid. Indeed, as shown by Hellinger et al.(2002), the
spatial resolution needs to be higher(at least Δ < 0.5 c/ωpi) or lower depending on theβivalue) in the hybrid simulations, in order to get a stronger ramp steepening and to initiate the self-reformation self-consistently. In our present case (as in previous PIC simulations), the ramp thickness is much lower and reaches a few electron inertia lengths c/ωpe.
For run 2(PUI%=10) shown in Figure3(b), the measured
MAand cyclic period trefof self-reformation are about 4.99 and
1.54 Wci-1 respectively. Figure 3(c) shows that even in the
presence of 25% PUIs (run 3), the shock front is still undergoing self-reformation, where the measured MA and tref
are about 5.26 and 1.4 Wci-1, respectively. It is worth noting
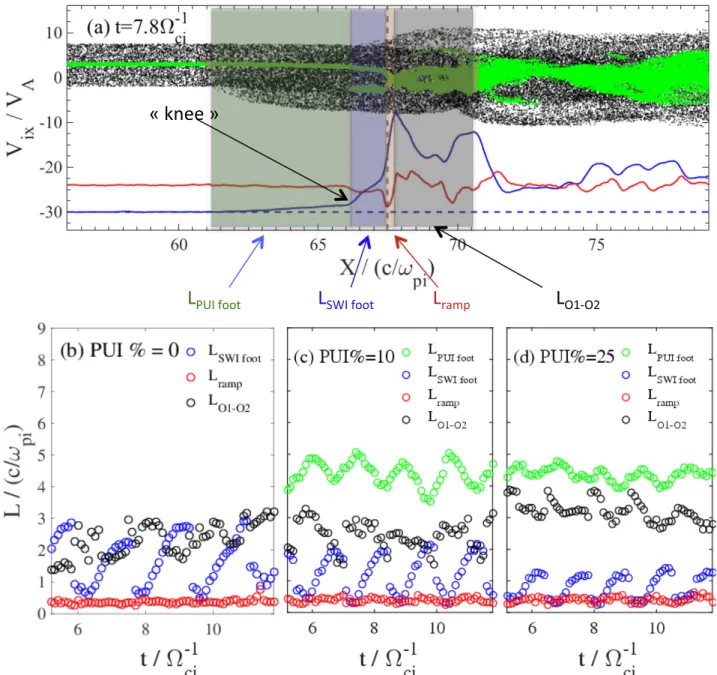
that the self-reformation period of the shock front in the presence of PUIs becomes shorter. Indeed, the spatial width of SWI’sfoot ismuch smaller thanthe PUI foot, and new reflected SWIs see a “local” By field (defined for reference at the áákneeññbetween the SWIs and PUIs feet indicated by the arrow in Figure 4) with anamplitudehigher than the far
upstream Bo field. This áálocalññ amplitude is almost unchanged within oneself-reformation for a given run (Figure 3) but increases as the percentage of PUIs increases
as reported in Figure 7(e). As aconsequence, the gyration of
R-SWIs will be smaller. Figure7(e) shows that the associated
self-reformationperiod is (almost) linearly anticorrelated with the local amplitude of the Btyfield measured at the áákneeññin the PUI foot.
Another striking point is that the time-averaged upstream Alfvén Mach number MAslightly increases as PUI% increases (Table 1). This result has been observed in previous PIC
simulations(Chapman et al.2005; Lee et al.2005; Matsukiyo et al.2007; Oka et al.2011) but not explained yet. In order to
clarify this question, we employ the multi-component Figure 1. Phase space plots (xi–vxi) of the SWIs (top panels) and PUIs (bottom panels) at the shock in the absence (PUI%=0 used for reference) and presence of
pickup ions(PUI%=10, as in run 2) at time t=7.8 Wci-1; in plot 1b, PUIs are test particles. The upstream incident ions(black dots) are separated into two
populations at the shock front: reflected (red dots) and directly transmitted (black dots). In each panel, the main magnetic field By(blue curve) and the cross-shock
electricfield Ex(red curve) are shifted and shown for reference; values of particlevelocity vxiand of(Byand Ex) fields are indicated, respectively, on the left- and
right-hand vertical scales. PUI foot and SWI foot are highlighted by green and blue areas, respectively. The vertical dashed line indicates the ramp location where the amplitude of the electricfield is maximum (used a reference); the ramp width is highlighted by a red area. Overshoots “O1” and “O2” are marked by the dark arrows.
Figure 2. Profiles of the magnetic field Byand the different ion density components at the shock front in the presence of 25% PUIs(run 3, left-hand column) and 55%
PUIs(run 4, right-hand column). For each column, from top to bottom:(a) main magnetic field By/B0(dark curve), with density profiles of SWIs (blue curve), of PUIs
(cyan), and total ion density (SWIs + PUIs, green curve); the left-hand Y-scale is the same for density and Byprofiles; (b)phase space plots of SWIs for R-SWIs (red
dots) and DT-SWIs (black dots) with corresponding density profiles for R-SWIs (red curve), DT-SWIs (black curve), and total density of SWIs (R+DT, blue curve); Y-scale on the left- and right-hand side are, respectively, dedicated to the ion velocity component vxand the density scale;(c)plot similar to (b) for PUIs. Arrows
indicate the location of the overshoots“O1,” “O2,” and “O3.”
Figure 3. Time stackplots of the main magnetic field By, for three simulations at various relative densities of PUIs:(a) 0% (run 1), (b) 10% PUIs (run 2), and (c) 25%
PUIs(run 3). All simulations correspond to a moderate Mach regime around MA∼5 (precise values are given in Table1). In each panel, successive large amplitude
Rankine–Hugoniot (R–H) Model proposed by Wu et al. (2009), which is based on the 1D hybrid simulation and the
classical single-fluid R–H jump conditions in a magnetohydro-dynamic shock. In their model, the downstream Alfvén Mach number MA,d can be obtained analytically in the shock rest frame MA,d=rs−1.5 MA, where MA is the upstream Mach number, and rs is the compression ratio, which can be calculated by nd/nu, where nd and nu are plasma densities in the downstream and upstream regions. With thesame MA, the MA,d in the shock rest frame increases with the increasing PUI% (after Wu et al. 2009). We can deduce that, in the
downstream frame (i.e., the simulation frame widely used in previous PIC simulations of the TS), the shock front propagates faster relative to the downstream plasma for thehigher PUI%
case, as the Vinj is kept unchanged. This suggests that the upstream bulk energy transfer to SWIs is lower for the shock in the presence of PUIs since it goes mainly to PUIs, and there is less need for local dissipation of SWIs at the front. Thus, the shock can go faster and the downstream compression ratio of SWIs becomes lower(i.e., rsbecomes smaller). Our simulation results are consistent with the multi-component R–H Model.
Third, we study the impact of the self-reformation on the spatial scale lengths of shock front microstructures: PUI foot, SWI foot, ramp, and the separation distance between over-shoots “O1” and “O2.” Scale lengths of the front micro-structures are identified in Figure 4(a). The PUI foot scale
(highlighted in green) is measured from the upstream edge of the PUI foot(determined by the fastest reflected PUIs) to the Figure 4. (a) Phase space plots of PUIs (black) and SWIs (green) for run 2 (PUI%=10) at a fixed time t=7.8 W
-ci 1. The main magnetic component By(blue curve)
and cross-shock electricfield Ex(red curve) are also shown for reference. The widths of PUI foot, SWI foot, ramp, and the distance between the two overshoots (“O1”
and“O2”) are highlighted in green, blue, red, and gray respectively. Time-evolution of these widths at the different shocks obtained with different percentages of PUIs:(b) 0% (run 1), (c) 10% (run 2), and (d) 25% (run 3). All simulations correspond to a moderate Mach regime around MA∼5. Different colored circles indicate
leading edge of the SWI foot and is identified by green dots; the SWI foot scale (highligthed in blue) is measured from the upstream edge of the SWI foot (determined by the fastest reflected SWIs) to the upstream edge of the ramp and is identified by blue dots. The ramp scale (highlighted in red) is measured from the end of the SWI foot to the overshoot“O1.” The whole ramp can be well fit by a straight line. The spatial scale of the distance between overshoot “O1” and overshoot “O2” (highlighted in gray) is measured from the first peak of By to the second peak in the immediate downstream; the locations of the overshoots are identified by comparing the density profiles (separately for each population) and magnetic profile (not shown here). Figures4(b)–(d) show the time history of the
different scale lengths for the PUI foot, SWI foot, ramp, and overshoot pairs (marked in the same color as the areas highlighted in Figure 4(a)) normalized to the upstream ion
inertial length, over several self-reformation cycles. Results show that(1) the SWI foot and ramp scales are of the order of several ionand a few electron inertial lengths respectively (values are in Table 2); (2) the width of all microstructures
fluctuates with a time period identical to the self-reformation cycle; in contrast, the ramp width is not affected by the self-reformation and stays unchanged for the different PUI% runs; (3) the width of the SWI foot is periodically changing in association with the self-reformation, and both its time-averaged value and the amplitude of the time fluctuations decrease as the PUI% increases; in contrast, the width of thePUI foot (green area) varies inversely to SWI foot and its time-averaged value is almost independent on the PUI%. However, these fluctuations do not compensate each other exactly so that the width of the total foot(SWI foot +PUI foot) is not constant (not shown herein) and slightly fluctuates in time even for the case ofPUI%=25; (4) the time varying width of theSWI foot can reach some low values comparable to that of the ramp for PUI%=25 (Figure 4(d)); and (5) the
time-averaged distance between the overshoots“O1” and “O2” increases with PUI%. These features may be helpful to indirectly identifythe impact of PUI% in the downstream region of the TS, from the observed magneticfield data (if the Mach number is known).
Fourth, the impact of the self-reformation on the field amplitude for different PUI% is analyzed in Figure5. The time variation of the maximum value By,max (blue) measured at overshoot “O1,” of the ratio of By,max to the downstream averaged value BDS(green), and of the maximum value of the cross-shock electric field Ex,max (red) measured over several self-reformation cycles are shown in Figure 5(a) for run 1
(PUI%=0). Similar results for runs 2 and 3 are shown in Figures5(b) (PUI%=10) and (c) (PUI%=25), respectively.
Results are summarized as follows.(1) As PUI% increases, the time variation of By,maxand Ex,maxpersists, but thefluctuations’ amplitude becomes weaker.(2) The time-averaged values of By,maxand Ex,maxdecrease as PUI% increases; then, since the cross-shock potential becomes lower, more directly transmitted SWIs and PUIs are expected for higher PUI% case, which has been confirmed in previous PIC simulations (Matsukiyo & Scholer 2011; Yang et al.2012a). (3) Only the time-averaged
value of the downstream ratio By,max/BDS (green) is almost independent ofPUI%.
Finally, at the end of this section, we investigate the impact of the self-reformation on the instantaneous velocity of the shock front(measured at the ramp location). Figure6shows the
time evolution of this velocity normalized to the upstream VA (i.e., the instantaneous Alfvén Mach number VShock/VA, left-hand side scale) and to the upstream ion thermal velocity Vthi for different PUI% runs(right-hand-side scale); in each panel, the black horizontal dashed line indicates the values of the instantaneous velocity averaged over several self-reformations (these values are used to define the Mach regime of each shock as reported in the runs of Table 1). Note that the foot is
considered to bea “new” ramp (cross) when its local amplitude (growing during the self-reformation) becomes large enough to start reflecting new incoming ions. This takes place simulta-neously asthe “old” ramp (circle) still continues to reflect some ions that have succeeded to pass through the“new” rampdur-ing the growth of the foot. This explains why within a small timescale(illustrated by a gray bar within one reformation cycle), two corresponding values of VShock are reported since these are defined for the “old” and the “new” ramp respectively Figure 5. Time-evolution of the maximum values of By,max/B0(blue circles) at
the shock front (overshoot “O1”) where Bo (=Boy) is the upstream
magnetostaticfield, of the ratio By,max/BDS(green circles, where BDSis the
downstream averaged value of the magnetic field amplitude), and of the maximum of cross-shock electricfield Ex,max/5E0 (red circles) at different
shocks obtained with different PUI%:(a) 0% (run 1), (b) 10% (run 2), and (c) 25%(run 3); Eo=VinjBois the conductionfield, where Vinjis the injection
velocity along the x-axis. All simulations correspond to a moderate Mach regime around MA∼5. In each panel, horizontal dashed lines indicate the
(more exactly at the location of the maximum electric field Emaxvalue, which is used as reference within the ramp). Later on (i.e., after this time range), the “old” ramp vanishes out further downstream and no associated VShock value can be defined; only the “new” ramp persists with its associated instantaneous velocity VShock. The co-existence of the “old” and“new” ramps explains the alternance of crosses and circles used within each panel between the successive self-reformation cycles. Figure 6 evidences the following points.(1) The instantaneous velocity strongly varies in time by almost a factor twofor PUI%=0%.(2) this variation decreases as the PUI% increases.(3) the value of the instantaneous velocity averaged over several self-reformation (dashed line) increases
with PUI%, which is in good agreement with the multi-component R–H Model mentioned above. Recall that in all cases the ratio VShock/Vthi remains high (>15), which is in favor of the self-reformation as shown by Scholer et al.(2003);
this criterium is equivalent to lowβiconditions as invoked by Hada et al.(2003).
4. SIMULATION RESULTS: IMPACT OF AHIGHER MACH NUMBER (MA∼9)
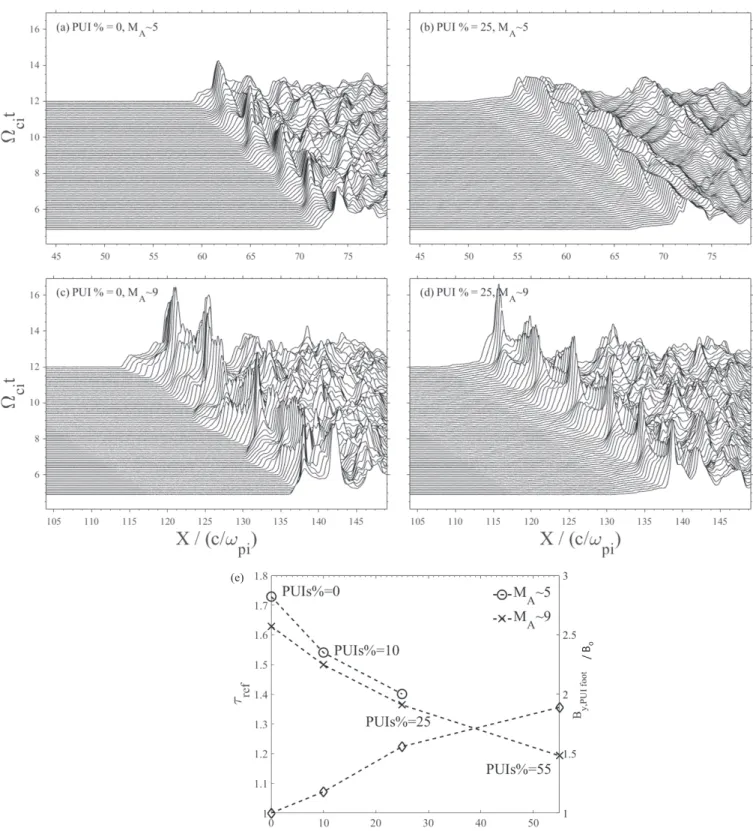
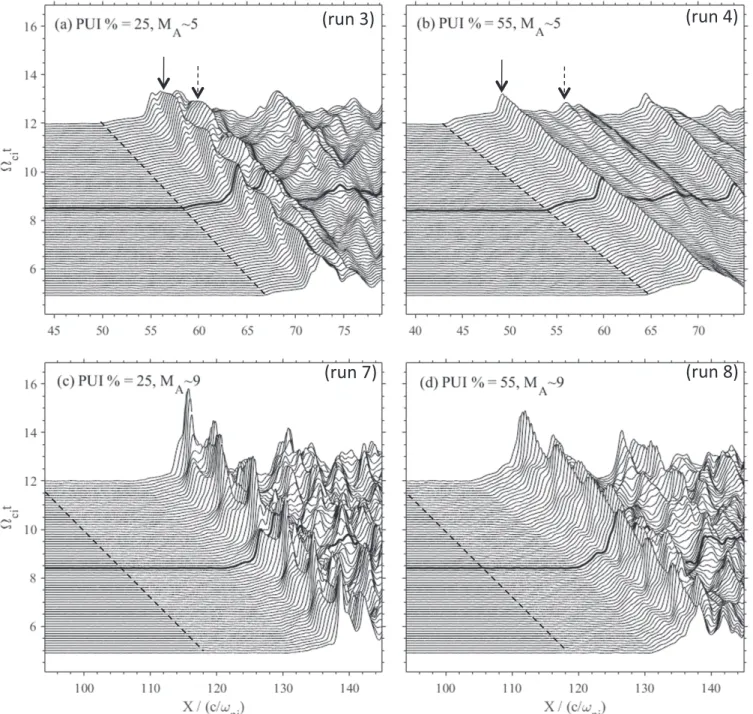
In this section, we address the same questions as in Section3, but now for shocks with a higher MAregime. Results of runs 5–7 (with MA∼9) are compared with the results of runs 1–3 (MA∼5) shown in Section3. The bottom panels in Figure7 show the time stackplots of the main magnetic field By for shocks in runs 5 (PUI%=0) and 7 (PUI%=25), respec-tively. In the upper panels, results from themoderate Mach number case(MA∼5) are shown for reference. Results show that(1) the self-reformation persists in the 25% PUIs case but thefluctuationamplitude is amplified for thehigh MA regime (Figure 7(d)), and (2) in other words, high MA regime compensates for the smoothing offield variations (to compare Figures 7(a) and (b)) due to the presence of PUIs. Moreover,
previous works have evidenced that the features of self-reformation are controlled by several factors (Lembège & Dawson 1989; Lembège & Savoini 1992; Hada et al. 2003; Scholer & Matsukiyo2004; Lembège et al.2009; Matsukiyo & Scholer2014), and no existing theory can be used to describe
the combined impact of the shock propagation angleΘ, of the MA regime, of the upstream βi and of PUI% on the self-reformation process. In Figure 7(e), we examine the
self-reformation period for moderate MA (runs 1–4: circles) and high MA(runs 5–8: crosses) cases as a function of PUI%. As the percentage PUI% increases, the self-reformation becomes faster in high MA cases as well as in moderate MAcases. For the moderate MA∼5, field amplitudes at the front are too weak (fieldsmoothing istoo strong) to feed the reflection of a noticeable percentage of SWIs for the case PUI%=55, and no self-reformation can take place.
Figure8shows a comparison of the impact of PUI% on the widths of the shock microstructures for moderate MA (upper panels) and high MA(bottom panels) cases. As MAincreases in the presence of 25% PUIs, (1) the amplitude of variations ΔLPUI footandΔLSWI footbecomes larger, and these variations become so large that values of LSWI footapproach LPUI footfoot during a reformation cycleand (2) the width variations of the SWI and PUI feet are still time anticorrelated with each other. The shock ramp width is an important criteria for the particle acceleration mechanisms, especially for efficiency of the shock surfing acceleration (Lee et al.1996; Zank et al.1996; Shapiro & Ucer 2003). Figures 8(e) and (f) show that, whatever the
time and for PUI%=0, the width of the shock ramp stays within the range of2.5–4 c/ωpein the moderate MAcase, and is almost unchanged for high MA. As both the PUI% and MA increase, the ramp width is almost not affected by the presence of PUIs and still stays around a few c/ωpe; for high MA, the ramp width only varies within the range of 3c/ωpeto 7c/ωpefor the 25% PUI case.
The maxima amplitudes By,max (blue) and Ex,max (red) measured within the shock front are time-evolving during the self-reformation, and their time-averaged values decrease as the Figure 6. Time-evolution of the instantaneous shock front velocity measured at
the ramp(vertical dashed line in Figure1) for different shocks with different
PUI%:(a) 0% (run 1), (b) 10% (run 2), and (c) 25% (run 3). All simulations correspond to a moderate Mach regime around MA∼5. In each panel, the
black horizontal dashed line indicates the shock velocity averaged in time(over successive self-reformations); this time-averaged value is used for providing the Mach regime of the shock for each run. Circles correspond to the time evolution of one ramp from the time it is identified as a foot starting to reflect new incoming ions(so called “new” ramp) until the time it vanishes out further downstream(so called “old” ramp); crosses correspond to the next ramp and so on alternatively. Arrows indicate the time when the measurement is made from the“new” ramp for the case PUI%=0 used as reference (panel a). The gray bar(panel b) illustrates the time range where the instantaneous velocity can be identified from both “old” and “new” ramps.
PUI% increases in both moderate and high MAcases(Figure9). As MA increases, the amplitude of By,max and Ex,max fluctuations becomes larger. Figure 6 has shown that for the moderate MA regime, the time variation of the instantaneous shock velocity becomes weaker in the presence of 25% PUIs.
Additional results(similar to plots of Figure 6 but not shown herein) performed for high MA case show that (1) the time-averaged velocity value〈VShock〉 increases with MA(Table 1) from áVShockñ VA=5.26(run 3) to 9.11 (run 7)and (2) the time variation of this velocity becomes much larger (VShock/ (e)
Figure 7. Time-stackplots of the main magnetic field Byat different shocks. The upper panels correspond to shocks obtained for different percentages of PUIs:(a) 0%
(run 1) and (b) 25% (run 3) for the moderate Mach number case (MA∼5); bottom panels are for corresponding shocks ((c) run 5, and (d) run 7) obtained for the high
Mach number case(MA∼9). The variation of the front self-reformation period Trefvs. the relative percentage of PUIs for moderate MA(circles, runs 1–4) and high
MA(crosses, runs 5–8) regimes is shown in panel (e); no self-reformation is observed for run 4. For each case, the value of Trefis averaged over 4–5 self-reformation
cycles. The local amplitude of the By,PUI footfield is measured at theáákneeññin the PUI foot(see thetext and the arrow in Figure4(a)) with thescale on theright-hand
VA=4.5–5.8 for MA∼5) (Figure 6(c)), and 6.8–10.8 for MA∼9 respectively). This confirms that high MAregime is in favor of shock front multi-crossings.
5.SWI-DOMINATED (25% PUIS) SHOCK VERSUS PUI-DOMINATED (55% PUIS) SHOCK.
Matsukiyo & Scholer(2011) found that in an extreme pickup
ion-dominated case (PUI%=60) the cross-shock potential
reaches a maximum value in the extended PUI foot and decreases when approaching the magnetic field overshoot “O1.” However, for a perpendicular shock and a fixed βi, the persistence or the disappearance of the self-reformation depends on both combined parameters: the MA regime and the percentage PUI% in particular in such extreme cases, which has not been mentioned before. In this section, we numerically investigate this dependence. Figure 10 compares the results Figure 8. Time history of the widths of the PUI foot (green), SWI foot (blue), ramp (red), and the distance LO1–O2(black) defined between overshoots “O1” and “O2”
over several self-reformations. Top panels are for the moderate Mach number regime(MA∼5) [(a) run 1, PUI%=0 (used for reference), and (b) run 3, PUI%=25],
and bottom panels are for the high Mach number regime(MA∼9) [(c) run 5, PUI%=0, and (d) run 7, PUI%=25]. The time history of the ramp thickness
(normalized vs. the electron inertia length c/ωpe) for shocks in the presence of 0% PUIs and 25% PUIs over several self-reformations is shown, respectively, in panels
obtained for moderate (MA∼5) and for high Mach number (MA∼9), for PUI%=25 (runs 3 and 7) and PUI%=55 (runs 4 and 8). In the moderate MA case (upper panels), Figure10(a) shows that the overshoots “O1” (full arrow) and
“O2” (dashed arrow) are time fluctuating because of the self-reformation, in the SWI dominated shock(PUI%=25), while the shock front becomes stationary (both for overshoots “O1” and “O2”) since the self-reformation disappears in the PUI dominated shock (PUI%=55, in Figure 10(b)). In contrast,
Figure10(d) shows that the self-reformation still persists in the
PUI dominated case (PUI%=55) for high MA∼9. The amplitudes of both overshoots are fluctuating, which means that in alarge enough high MAregime, the self-reformation can survive even in a PUI-dominated shock. Combining with results on the instantaneous shock velocity (Section 4), it is
reasonable to deduce that quite different magnetic field shock profiles may be seen in alarge MAregime, even in the presence of ahigh percentage of PUIs (multi-shockcrossing).
Snapshot of ionphase space and of the different ion density components are shown for the stationary shock (run 4) in Figure 2 (right column). It is clearly evidenced that the
reflection rate of SWIs (i.e., the ratio NR_SWIs/NSWIs of reflected SWIs density over the total density of incident SWIs) is much weaker than for run 3 and is not strong enough to feed
the self-reformation, which disappears; the foot in the R-SWIs density profile almost disappears, as it almost merges with the ramp as in Hada et al.(2003). Several features need to pointed
out: (1) as the PUI% increases, the PUI foot amplitude increases while the amplitude of the overshoots (“O1” at the front and“O2” further downstream) in the Byfield decreases (to compare black curves in Figures 2(a) and (d)) as was
already observed in previous works for quasi-perpendicular shock(Matsukiyo & Scholer2011); (2) the decrease of “O1”
amplitude persists whatever the time is as PUI% increases (Figure5) and its amplitude is still only supported by DT-SWIs
even for high PUI% (Figures 2(d)–(f)); (3) moreover, the
location of“O2” identified in Figure10(b) has been reported in
Figure 2 (right column) which clearly evidences that the
distance LO1–O2largely increases in run 4 as compared with run 3, and all overshoots are mainly supported by the DT-SWIs except for the overshoot“O2” where the contribution of PUIs (in particular R-PUIs) becomes comparable to that of SWIs (cyan and blue curves in Figure2(d));and (4) the amplitude of
the spatial anticorrelation between the R-PUIs and DT-PUIs profiles increases with PUI% (Figure2(f)), which explains that
the R-PUIs partially contribute to “O2” during their down-stream gyromotion(to compare Figures 2(d) and (f)).
Figure 9. Time-evolving amplitudes of the magnetic peak By,max(measured at the overshoot “O1”) and the cross-shock electric field Ex,max(measured within the
ramp) over several self-reformations. Top: values of By,max/B0(blue) and Ex,max/5E0(red) of different runs [(a) run 1, PUI%=0, and (b) run 3, PUI%=25] in the
moderate Mach number regime(MA∼5). Bottom: corresponding results of different runs [(c) run 5, PUI%=0, and (d) run 7, PUI%=25] in the high Mach number
6. IMPACT OF THE SHELL THICKNESS ON THE SHOCK FRONT NONSTATIONARITY The modeled PUIs used in previous hybrid/PIC simulations are usually described by a thin-shell velocity distribution(zero thickness). Based on the early observations of PUIs in the solar wind, the distribution of PUIs is expected to be a partially-filled spherical shell since resulting from adiabatic cooling as the solar wind expands in the heliosphere (Vasyliunas & Siscoe 1976; Mobius et al. 1985, 1988; Burrows et al.2010; Zank et al. 2010). Lee et al. (1996) mentioned that the
thickness of the PUI velocity shell in different locations, such
as at the cometary shock, the TS and on the corotating interaction region shock is quite different.
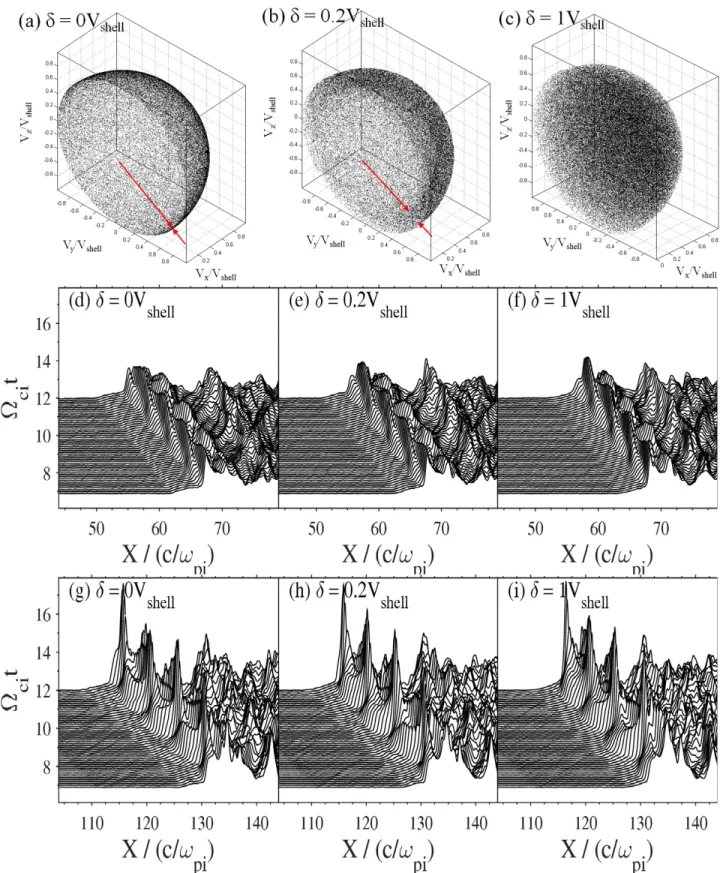
Herein, we analyze the impact of velocity shell thickness of PUIs on the microstructures and the nonstationarity of the TS in the presence of typical 25% PUIs. The upper panels in Figure 11 showthe initial state of the PUI velocity shell distribution with different thicknesses δ=0, 0.2Vshell, and 1Vshellas used in different runs(3, 9, and 11 respectively; to see Table 1). The middle panels show the corresponding time
stackplots of the main magneticfield Byfor the moderate Mach number MA∼5. Similar plots for the high Mach number Figure 10. Time stackplots of the main magnetic field Byat different shockconditions. Top: (a) run 3, PUI%=25, and (b) run 4, PUI%=55] in the moderate Mach
number regime(MA∼5). Bottom: corresponding results of different runs [(c) run 7, PUI%=25, and (d) run 8, PUI%=55] in the high Mach number regime
(MA∼9). In panel (a), the overshoots “O1” and “O2” are marked by full and dashed arrows, respectively. The dashed line indicates the upstream edge of the PUI foot.
For comparison, the Byprofile is overlined with a thick full line at the time t=8.4 Wci-1which is also used as a reference time for Figure2(a) (PUI%=25) and
MA∼9 (runs 7, 12, and 14) are shown in the bottom panels; the casesδ=0.5Vshellare not shown herein(runs 10 and 13). Main results can be summarized as follows.(1)The impact of the thickness δ on the shock microstructures is not drastic for
both moderate and high MA cases (the maxima values of the fields overshoots and the microstructures scales remain almost unchanged).(2) The self-reformation persists for all cases.(3) However, results of Table1 show that the MA(i.e., of vShock) Figure 11. Top panels: 3D view of the cross-sections of the PUI velocity shell with different thicknesses: δ=(a) 0, (b) 0.2Vshell, and(c) 1Vshell. The shell thickness is
marked by red arrows. Middle panels: corresponding time stackplots of Byobtained for afixed PUI%=25 but withdifferent shellthicknesses (runs 3 (d), 9 (e) and
11(f)) in the moderate Mach number case (MA∼5). Bottom panels: similar plots as the middle panels (runs 7 (g), 12 (h) and 14 (i)) for the high Mach number
value slightly decreases as δ increases.(4) The corresponding period Tref of the self-reformation slightly increases with the shell thickness.(5) When approaching the front from upstream, the increase of the PUI foot(in both Byand density profiles) is smoother as δ increases; this is due to the initial larger PUIdiffusion in velocity space (similar to a warm population) for afinite δ, in contrast with the fact that PUIs are distributed within a very small part of the velocity space forδ=0 (at the edge of the shell), which is similar to a cold population. Then, even if the main features of the shock remain globally unchanged, the above features (3) and (5) may have some impact on the energy partition. This question is under active investigation and will be presented in a further paper. Then, results obtained in the previous simulations and present PIC simulation (based on zero thickness δ) can apply to the microstructures of the TS.
7. DISCUSSION
In order to clarify the present results with respect to previous works, the discussion of this section will focuson three points: (1) the downstream supersonic/subsonic regime, (2) the features of the shock front multicrossing, and(3) a comparison with previous works.
7.1. Downstream Supersonic/Subsonic Regime Richardson et al. (2008) found that the fast-mode Mach
number in the downstream region is still larger than one. This statement was a source of confusion, which is discussed here. Wu et al.(2009) mentioned that the plasmas instrument on V2
does not accurately measure ions in the energetic tail of the velocity distribution (especially for the PUIs). Thus, the downstream Mach number is likely to be overestimated. Based on the multi-component R–H Model, they found that the downstream magnetosonic Mach number Msin the shock rest frame is in a range from 0.55 (at γ=5/3, where γ is the
polytropic index) to 0.62 (γ=2.2). Herein, we have examined the downstream Mach number by using self-consistent PIC simulations. The upper panels of Figure12show the magnetic mainfield Byfor run 1(PUI%=0) and run 3 (PUI%=25) at time t=10 Wci-1. The lower panels of Figure12show theflow
Alfvén Mach number MA0=U/VA0 (U is the incident flow speed and VA0=1 is the upstream Alfvén speed), the local flow Alfvén Mach number MA=U/VA(VAis the local Alfvén speed), and the local magnetosonic Mach number Ms=U/(VA2 + Vs2)1/2 (Vs is the sonic speed which can be calculated excluding or including PUIs) in the shock rest frame. Figure 12(d) clearly evidences that the downstream plasma
flow is super-Alfvénic (red curve) and well sub-magnetosonic (black curve) if the PUIs are included, in contrast with the case where PUIs are excluded (Figure 12(c)). We recover a
transition from supersonic to subsonic regime at the TS shock as for any shock.
7.2. Interpretation of Multiple Crossings
When comparing with experimental data from V2, numerical results in Section3show that the variation of the instantaneous shock front velocity decreases for PUI%=25. So, the front multicrossing becomes more difficult to be explained by the self-reformation alone. However, this result holds for a moderate Mach regime(MA∼5). In contrast, for higher Mach number(MA∼9), the time-variation of the instantaneous front velocity becomes larger, which is in favor of an easier multicrossing.
7.3. Comparison with Previous Works 7.3.1. Self-reformation Processes
Hada et al.(2003) have demonstrated that a high βivalue can suppress the self-reformation. Matsukiyo et al. (2007) have
already investigated the impact of the mass ratio(mi/me) used in the PIC simulation on the results, for an oblique (quasi-Figure 12. Profiles of the magnetic field By(upper panels) and Mach numbers (lower panels) for run 1 (left panels) and run 3 (right panels) at time t=10 Wci-1. The
blue and red curves show the Alfvénic Mach number obtained with the upstream Alfvénic speed and the local Alfvénic speed. Green and black curves show the magnetosonic Mach numbers obtained by using the magnetosonic speed defined without and with PUIs respectively.
perpendicular) shock. They concluded that the self-reformation is independent of the mass ratio and of the presence of (up to 10%) PUIs, although instabilities within the shock front (occurring in oblique shocks) strongly depend on these. We should keep in mind that the self-reformation in the present paper is due to the accumulation of R-SWIs over a foot distance from the ramp (as for perpendicular shock), while it can be due to the Modified Two Stream Instability (MTSI) excited by the relative drift between the R-SWIs/incoming SWIs and the incoming electrons, which requires a relatively high value of mass ratio and an oblicity of the shock propagation direction as in Matsukiyo et al. (2007). The
present study is restricted to perpendicular shock propagation and the concerned self-reformation persists whatever the mass ratio is (Lembège et al.2013); moreover, a combinaison of a
high Mach number regime and/or a moderate PUI% is in favor of the self-reformation process and consequently of shock front multi-crossings.
7.3.2. Reflection Rate of SWIs and PUIs Populations In aprevious PIC simulation, Matsukiyo & Scholer (2011)
qualitatively estimated that the fraction of PUIs at the shock front is almost 100%. Our results show that the reflection rate of SWIs(i.e., the ratio NR_SWIs/NSWIsof reflected SWIs density over the total density of incident SWIs) strongly decreases from 24.78%, to 16.81%, 8.95%, and 4.56%, as the PUI% increases from 0 to 10, 25(TS conditions) and 55 (i.e., for runs 1 to 4 respectively). In contrast, the reflection rate of PUIs very slightly decreases 47.82%(test particles), to 47.77%, 47.44%, and 45.71%, as the PUI% increases from 0 (test particles) to 10, 25 (TS conditions) and 55 (i.e., for runs 1 to 4 respectively). In other words, the reflection rate of PUIs is almost independent of the PUIpercentage. The decrease of both reflection rates is a consequence of the (time-averaged) fieldamplitude decrease at the shock front as PUIs% increases, and more SWIs and PUIs are expected to be directly transmitted. Note that the reflection rate mentioned herein is a time-averaged value, which is based on the separation method described in Section 1. We start counting the R ions and DT ions from a given time tA(=7 Wci-1) to a later time tB large enough so that the time intervalΔt=(tB−tA) contains several self-reformation cycles. The same time interval Δt is used for estimating the percentage of the different ion populations in the different runs; the time tB corresponds to the end time of the simulation for all runs.
8. CONCLUSIONS
In this paper, we have used a1D electromagnetic PIC code self-consistently including SWIs and PUIs in order to analyze the impact of PUIs on the microstructures and the reformation of the TS, and the retroaction of the self-reformation on PUIs and SWIs. A detailed analysis has been performed by separating each incident SWIand PUIpopula-tion into two parts: reflected (R) and directly transmitted (DT). A parameter study has been performed to show the impact of different Mach number regimes and different velocity shell thicknesses of PUIs on the results. Present results can be useful for theoretical modelers of the TS microstructures, in order to analyze more precisely the energy partition and particle acceleration through the TS. Main results can be summarized as follows.
1. The self-reformation of the shock front persists quite well in the presence of anoticeable percentage of PUIs (25%) as that measured (indirectly) at the TS, and even for a moderate MAregime.
2. The presence of PUIs has a strong impact on both the microstructures of the shock front and tends to smooth out the time fluctuations of fieldamplitude and of microstructurewidths at the front and overshoots. 3. The TS has a multiple overshoot structure as confirmed
by both Voyager observations and numerical simulations. Byanalyzing the contribution of the different ion densities (R and DT for each population), we found that the downstream microstructures of the shock front (over-shoots) are mainly carrried by the gyrating DT-SWIs and very slightly by the R-SWIs further downstream for moderate PUI% (=25); no PUIs contribute. For high PUI%(=55), the dominant contribution of DT-SWIs still persists, except further downstream(“O2”) where R-PUIs contribute to a certain amount.
4. For the moderate Mach regime, the amplitude of both overshoots “O1” and “O2” suffers noticeable periodic fluctuations due to the self-reformation even for PUI-%=25. When PUI% approaches 55, these time fluctua-tions disappear for both “O1” and “O2.” However, for thehigh Mach regime, the overshootfluctuations are recovered even for PUI%=55. In other words, higher Mach regime compensates forthe decrease of the fieldcomponents at the front (and the resulting smooth-ing of the front self-reformation) as the percentage of PUIs increases.
5. As the PUI percentage increases, the shock becomes faster and the downstream compression ratio becomes weaker,which is explained by an R–H Model (Wu et al.
2009); in addition, the reflection rate of SWIs and PUIs
decreases.
6. Present time stackplots of the main B field clearly evidence that the amplitude of the PUI extended foot increases with PUI%. The leading edge of the PUI foot roughly has a uniform motion with an almost constant velocity(equal to the time-averaged front velocity). The time variation of the PUI foot width confirms that it suffers the impact of the self-reformation, but its time-averaged value is almost unchanged for different PUI%. In contrast, as PUI% increases, the time-averaged width of SWI foot decreases slightly; the amplitude of its time fluctuations decreasesbut remains larger than those of the PUIfoot width. In addition, the time variations of the PUI foot and SWI foot width are anticorrelated during a shock front self-reformation cycle; this feature is mainly due to the strong time variation of the upstream edge of the SWI foot rather than that of the PUI foot (uniform motion mentioned above).
7. PUIs are presently described by a zero thickness shell distribution. However, the shock structure does not seem to be sensitive to the choice of the shell thickness(a more precise assessment is underway and left for future work). 8. At the PUI dominated shock (PUI%=55) and for moderate MA(∼5), the self-reformation disappears due to the limited percentage of R-SWIs(∼4.56 %). The main process that allows the PUIs to stop the self-reformation process can be summarized as follows.The bulk velocity
of SWIs strongly decreases when these penetrate the PUI foot. As the SWIs reach the shock ramp, only a small fraction of incident SWIs is reflected due to their lower bulk velocity (as compared to the far upstream bulk velocity before these reach the PUI foot). Thus, the energy gain of the reflected SWIs at the shock front is reduced, and no clear vortex is formed in the SWI phase space(Lembège & Dawson 1987; Hada et al. 2003). So
the self-reformation (fed by this vortex) is completely suppressed. However, for ahigher MA regime, the percentage of R-SWIs is large enough to feed the front nonstationarity, whichpersists even in the PUI=55% case. In summary, thehigh Mach number regime allows us to compensate for the smoothing of the microstructures and the time fluctuations of the shock front brought by the presence of PUIs.
Present results focussed on the self-consistent shock front microstructures and the associated spatial/temporal scales variations can be helpful for modelers. In addition, the self-reformation analyzed presently provides a possibility for multi-crossings of the TS by Voyager. The higher dimensional effect on the self-reformation, theminority heavy ion effect on the shock microstructures, theself-excited front rippling effect on the precise shock front location (Lembège & Savoini 1992; Yang et al. 2012b), and the self-generated waves by the PUIs
should be considered together in a further work. We also note that the upstream solar wind may include pre-existing large-scale turbulence (Lu et al. 2009; Guo & Giacalone 2010), so
these waves may change the structure of the shock front and lead to a multiple crossings of the TS. The impact of the dynamic heliopause may also affect the location of the TS even if the upstream solar wind has a constant bulk velocity during the Voyager crossing. Such topics will be investigated in further works.
This research was supported by the National Science Foundation of China under grantNo. 41574140, and in part by the Specialized Research Fund for State Key Laboratories of China. The computations wereperformedby Numerical Fore-cast Modeling R&D and VR System of State Key Laboratory of Space Weatherand Special HPC work stand of Chinese Meridian Project.
REFERENCES Axford, W. I. 1962,JGR,67, 3791
Biskamp, D., & Welter, H. 1972,PhRvL,28, 410
Burgess, D., Lucek, E. A., Scholer, M., et al. 2005,SSRv,118, 205
Burgess, D., Wilkinson, W. P., & Schwartz, S. J. 1989,JGR,94, 8783
Burlaga, L. F., Ness, N. F., Acuna, M. H., et al. 2008,Natur,454, 75
Burrows, R. H., Zank, G. P., Webb, G. M., Burlaga, L. F., & Ness, N. F. 2010, ApJ,715, 1109
Chapman, S. C., Lee, R. E., & Dendy, R. O. 2005,SSRv,121, 5
Guo, F., & Giacalone, J. 2010,ApJ,715, 406
Hada, T., Oonishi, M., Lembege, B., & Savoini, P. 2003,JGR, 108, 1233 Hellinger, P., Trávnícek, P., & Matsumoto, H. 2002,GeoRL,29, 2234
Lee, M. A., Shapiro, V. D., & Sagdeev, R. Z. 1996,JGR,101, 4777
Lee, R. E., Chapman, S. C., & Dendy, R. O. 2005,AnGeo,23, 643
Lembege, B., & Dawson, J. M. 1987,PhFl,30, 1767
Lembege, B., & Dawson, J. M. 1989, PhRvL, 62, 23
Lembege, B., Giacalone, J., Scholer, M., et al. 2004,SSRv,110, 161
Lembège, B., & Savoini, P. 1992,PhFlB,4, 3533
Lembege, B., Savoini, P., Hellinger, P., & Travnicek, P. M. 2009,JGR,114, A03217
Lembege, B., Yang, Z., & Lu, Q. 2013, AGUSM, 1801714, SM31A-2112 Liewer, P. C., Goldstein, B. E., & Omidi, N. 1993,JGR,98, 15211
Lu, Q. M., Hu, Q., & Zank, G. P. 2009,ApJ,706, 687
Matsukiyo, S., & Scholer, M. 2011,JGR,116, A08106
Matsukiyo, S., & Scholer, M. 2014, JGR, 119, 2388
Matsukiyo, S., Scholer, M., & Burgess, D. 2007,AnGeo,25, 283
Möbius, E., Hovestadt, D., Klecker, B., et al. 1985,Natur,318, 426
Möbius, E., Klecker, B., Hovestadt, D., & Scholer, M. 1988,Ap&SS,144, 487
Ness, N. F., Scearce, C. S., & Seek, J. B. 1964,JGR,69, 3531
Oka, M., Zank, G. P., Burrows, R. N., & Shinohara, I. 2011, in AIP Conf. Proc. 1366(Melville, NY: AIP),53
Richardson, J. D., Kasper, J. C., Wang, C., Belcher, J., & Lazarus, A. J. 2008, Natur,454, 63
Scholer, M., & Matsukiyo, S. 2004,AnGeo,22, 2345
Scholer, M., Shinohara, I., & Matsukiyo, S. 2003,JGR, 108, 1014 Shapiro, V. D., & Ucer, D. 2003,P&SS,51, 665
Stone, E. C., Cummlings, A. C., McDonald, F. B., et al. 2005, Sci, 309, 2017
Tidman, D. A., & Krall, N. A. 1971, Shock Waves in Collisionless Plasmas (New York: Wiley/Interscience)
Vasyliunas, V. M., & Siscoe, G. L. 1976,JGR,81, 1247
Wu, P., Liu, K., Winske, D., et al. 2010, JGR,115, A11105
Wu, P., Winske, D., Gary, S. P., Schwadron, N. A., & Lee, M. A. 2009,JGR,
114, A08103
Yang, Z. W., Han, D. S., Yang, H. G., et al. 2012a,Ap&SS,341, 241
Yang, Z. W., Lembège, B., & Lu, Q. M. 2012b,JGR,117, A07222
Yang, Z. W., Lu, Q. M., Lembège, B., & Wang, S. 2009, JGR, 114, A03111
Zank, G. P., Heerikhuisen, J., Pogorelov, N. V., Burrows, R., & McComas, D. 2010,ApJ,708, 1092