by
CHARLES VOWLES IM.EEng.
of
University of Liverpool, England
SUBMITTED IN PARTIAL FULFILLMENT OF THE REQUIREMENTS FCR THE DEGREE OF
MASTER OF SCIENCE in
Chemical Engineering
at the
MASSACHUSETTS INSTITUTE OF TECHNOLOGY (1951) Signature of Certified by Auth Thm enris d, 1951 ~~\ - Thesis Supervisor
Departmental Comrnit ee on Graduate Students Chairman,
MITLibraries
Document Services Room 14-0551 77 Massachusetts Avenue Cambridge, MA 02139 Ph: 617.253.5668 Fax: 617.253.1690 Email: [email protected] http://libraries.mit.edu/docsDISCLAIMER OF QUALITY
Due to the condition of the original material, there are unavoidable flaws in this reproduction. We have made every effort possible to provide you with the best copy available. If you are dissatisfied with this product and find it unusable, please contact Document Services as soon as possible.
Thank you.
Due to the poor quality of the original document, there is
some spotting or background shading in this document.
by
Charles Vowles
Submitted for the degree of Master of Science in the Department of Chemical Engineering on May 18,
1951
ABSTRACT
A method of predicting critical constants of substances is presented which requires a knowledge only of the struc-tural formulae of the substances concerned together with a series of elemental values for each of the three cases of critical volume, critical temperature and critical pressure. These elemental values have been determined and are presented.
In the critical volume case, the elemental values for all the atoms and structural elements in the molecule concerned are added to give the critical volume of that compound. For critical temperatures, the summation of the elemental values gives the ratio of the normal boiling temperature to the cri-tical temperature of the compound concerned. Since normal boiling temperatures are quoted in the literature for a wide range of substances, the critical temperature can be obtained from this ratio. The summation of the elemental values in the critical pressure case gives the ratio of the critical tempera-ture to the critical pressure raised to a power "a". This
exponent, constant for any series, is determined for the most common cases and together with it and the critical temperature, the critical pressure for the compound concerned may be
obtained.
The predictions may be expected to be within five per
cent for critical volumes, three per cent for critical tempera-tures and ten per cent for critical pressures when organic
substances are involved. Accurate predictions for inorganic substances are given only in the critical temperature case.
Department of Chemical Engineering Massachusetts Institute of Technology Cambridge 39, Massachusetts
May 18, 1951
Professor Joseph S. Newell Secretary of the Faculty
Massachusetts Institute of Technology Cambridge 39, Massachusetts
Dear Sir:
I herewith submit the thesis entitled "Critical Constants" in partial fulfillment of the requirements for the degree of Master of Science in Chemical Engineering.
Yours respectfully,
The author wishes to express his appreciation to Professor Meissner of the Chemical Engineering Department for the very great interest he has shown in this work and for his extremely helpful suggestions.
TABLE OF CONTENTS
Section Title Page No.
Tables and Graphs (i') 64
I Summary 1 II Introduction 4 III Procedure 8 (1) Critical Volumes 8 (2) Critical Temperatures 13 (3) Critical Pressures 17 IV Results 20 (1) Critical Volumes 20 (2 Critical Temperatures 36 (3) Critical Pressures 62 V Discussion of Results 85 VI Conclusions 91 VII Recommendations 92 VIII Appendix
(A) Definitions and Experimental Deter-mination of Critical Constants Al (B) List of Experimentally Determined
Critical Constants A3
(C) Review of Existing Methods of
Pre-dicting Critical Constants All
(1) Critical Volumes All
(2) Critical Temperatures A18 (3) Critical Pressures A29 (D) Parachor and Molar Refraction
Values for Atomic and Structural
Elements A33
(E) Method of Least Squares- for ob-taining the best Straight Line
through Experimental Data A34
(F) List of Symbols A36
LIST OF TABLES Nu Volumes Critical Critical Critical Critical Critical Critical Critical Critical Critical Temperatures Temperatures Temperatures Temperatures Temperatures Temperatures Temperatures Temperatures Temperatures of 0 of of of of of of of Paraffin Hydrocarbons Olefins and Diolefins Aromatics Ethers Esters Carboxylic Acids Alcohols Amines Nitriles mber Title
I Values of X, Y and: Z for the Atoms and Structural Elements
II Critical Volumes of Paraffin Hydrocarbons III Critical Volumes of Alcohols and Ethers
IV (a) Critical Volumes of Carboxylic Acids (b) Critical Volumes of Esters
V Critical Volumes of Chlorine-substituted Methanes
VI Critical Volumes of Chlorine-substituted Paraffins
VII Critical Volumes of Nitriles
III Comparison of Experimental and Calculated
values of Critical Volume for Amines, Sulfides, Mercaptans, Olefins, Diolefins, Aromatics,
Halogen-substituted and remaining Hydrocarbons IX Critical Volumes of Inorganic Compounds
X List of Atomic and Structural Values--Critical
37
39
41 4244
4849
50 52 aeNo.3
20 23 23 24 26 26 30 3233
34 V XI XII XIII XIV XV XVI XVII XVIII XIXTables (cont) Num X XX XXI
XX
X Xx XXV XXVI XX X XX XXX XXXI XXX XX XXXXXXV
XXXVI XXX iber TitleXX Critical Temperatures of Mercaptans and Sulfides
XI Critical Temperatures of Acetylenes
II Critical Temperatures of Halogen-substituted Hydrocarbons
II Critical Temperatures of Elements and Inor-ganic Compounds
IV List of Atomic and Structural
Values--Criti-cal Temperatures
XV Critical Pressures of Paraffin Hydrocarbons
VI Critical Pressures of Olefins and Diolefins II Critical Pressures of Aromatics
II Critical Pressures of Ethers IX Critical Pressures of Esters XX Critical Pressures of Amines
XI Critical Pressures of Sulfides and Mercaptans II Critical Pressures of Chlorine-saUbstituted
Paraffins
II Critical Pressures of Alcohols IV Critical Pressures of Nitriles XV Critical Pressures of Phenols
VI Critical Pressures of Carboxylic Acids
II Critical Pressures- of remaining Hydrocarbons and Halogen-substituted Hydrocarbons
II Critical Pressures of Elements and Inorganic Compounds
Ix List of Atomic and Structural Values---Criti-cal Pressures
Al Errors involved in applying Equation (Al)
Pae -No.
54
55
59
6o
61
63
65
67
70
71
7274
75
76
78
80 80 8283
84
All List of (ii)Tables (cont) List of Number A2 A3 A4 A5 A6 A7 A8 A9 A10 Ti tle P
Errors involved in applying Equation (A2) Constants for Equation (A37)
Constants for Equation (A40)
Constants for Equations (A42) and (A43) Constants for Equation (A45)
Values of Constant B for Equation (A49)
Groups covered and constants for Equation (A58) Constants for Equation (A59)
Parachor and Molar Refraction Values for Atomic and Structural Elements
age No. A13 A22 A23 A24 A25 A27 A30 A31
A33
(v) LIST OF GRAPHS Title 1 Critical Volumes 2 Critical Volumes 3 -Critical Volumes 4 Critical Volumes
5
Critical Volumes6
Critical Volumes 7 Critical Temperatures 8 Critical Temperatures 9 Critical Temperatures 10 Critical Temperatures 11 Critical Temperatures 12 Critical Temperatures 13 Critical Temperatures 14 Critical Pressures 15 Critical Pressures 16 Critical Pressures 17 Critical Pressures I Paraffin Hydrocarbons II Alcohols EthersIII Carboxylic Acids Esters IV Chlorine-substituted Methanes V Chlorine-sabstituted Paraffins VI Nitriles Amines I Paraffin Hydrocarbons II Olefins Aromatics III Ethers Alcohols IV Esters V Carboxylic Acids Amines VI Nitriles Mercaptans Sulfides VII Acetylenes Chlorine-substituted Paraffins I Paraffin Hydrocarbons II Olefins Arcmatics III Esters IV Ethers Chlorine-substituted Paraffins Sulfides and Mercaptans Figure-Nu'mber I P No. 21 22 27 28 29 38 4o
43
47 51~53
56
64
66
68
69
List of Graphs (cont) Figure Number 18 Critical Pres 19 Critical Pres 20 Critical Pres Al Temperatureso Title sures sures' sures f Constant Page No. V Amines VI Alcohols VII Nitriles Vapor Concentration
73
79
A20I SUMARY
.A method for predicting critical constants of substances is presented which requires a knowledge only of the struc-tural formulae of the substances concerned together with a series of elemental values, given below, for each of the three cases of critical volume, critical temperature and critical pressure. It is shown that:
Molal critical volume = Vc = Ep X (ccs./grm. mol) Normal boiling temperature Tb
Critical temperature = q Y (dimensionless) Critical temperature T
Cri ica -te pe a r = c - E r 2 (K/atmosa) (Critical pressure)a pa
where X, Y, Z are values assigned to each atom and structural element for the cases of critical volume, temperature and pressure respectively.
p, q, r are the numbers of atoms or struc-tural elements in the molecules corresponding to X, Y and Z respec-tively.
Thus, if a substance contains x atoms of A, y atoms of B and z double bonds, then:
Vc = X XA + y XB + Z XDB
The values of X, Y and Z for the various atoms and struc-tural elements have been determined from the experimental data available and are presented below in Table 1.
With critical volumes, the errors for the sixty-three organic compounds considered were less than four per cent in ninety per cent of the cases, the maximum error being seven
2 per cent. Accurate predictions were not made generally for the elements and inorganic compounds.
For critical temperatures, in the one hundred and thirty organic compounds considered, a maximum error of
5.50%
wasencountered, the err6r in ninety-five per cent of the cases lying within three per cent. With inorganic compounds and elements, good accuracy was obtained, the average deviation for nineteen cases being 3.30% and the maximum 7.50%.
A series of elemental values, univergally applicable to all compounds, was obtained for critical oressures. The exponent "all, though constant and equal to 0.80 for the paraffin hydrocarbons, olefins, aromatics, esters, ethers, amines, halogen-substituted hydrocarbons, sulfides and
mer-captans, differed for several homologous series and was found to be 0.65 for the alcohols, 0.68 for the nitriles, 0.685 for the carboxy acids and 0.665 for the phenols. In eighty per cent of the one hundred organic compofinds considered, the error was less than five per cent, while in ninety-five- per cent of the cases, it was less than ten per cent. The maximum
error encountered was seventeen per cent. The method proved to be unreliable for elements and inorganic compounds.
Data for compounds containing more than eight carbon atoms are not available and thus the method presented could not be checked beyond this range, but prediction within this range is good and is recommended where no experimental data are available.
Table 1
Values of X, Y and Z for the Atoms and Structural Elements
Critiaal Critical Critical
Element Symbol Volume Temp. Pressure
X Y z Carbon Hydrogen Hydroxyl Group Oxygen Nitrogen Sulfur Fluorine Chlorine Bromine Iodine Double Bond (C=0) Double Bond (0=0) Double Bond (C=S) Double Bond Triple Bond Triple Bond Triple Bond (S=o) (CEC) (CEN) (NEN)
Six membered ring (Aromatic and Naphthenic) 0 H (OH) 0 N S F C1 Br I Dco R6 23.0 17.0 38.0 21.0
13.5
58.033.0
63.5
82.7 110.9 13.2 18.0 18.0 32.7*6o.5
6o.5
-22.5-0.5592
0.2875 0.3382 0. 0165 -0.2625 0.0140 0.3042 0.2983 0.2990 0.2994 0.56400.5640
0.5640
o.5640
1.1415 1.1590 1.15900.5666
* Values calculated from single compounds.
1.02 1.95 23.10 3.00 2.45
6.70
3.63
7.45
9.38 10.95 2.50 2.50 2.50 2.505.59*
29.10 2.68* -0.14The Critical Temperature of a substance may be defined as the minimum temperature above which the substance cannot be liquified by the application of pressure, no matter how great it may be. As the temperature of a substance is raised towards its critical, the density of the liquid phase decreases and that of the saturated vapor phase increases until at the critical point the meniscus separating the phases flattens and disappeatgmand the properties of the two phases become identical. The saturated vapor pressure at this temperature is called the Critical Pressure, the density, the Critical Density and the specific volume, the Critical Volume. Direct methods of determining these critical constants experimentally are discussed briefly in Appendix A and the list of experimental values are presented in Appendix B.
Several important methods for prediction and correlation of the pressure-volume-temperature relations for liquids and gases, heats of vaporization, surface tensions, etc., require a knowledge of the critical constants of the substances con-cerned. While experimentally determined values are reported in the literature for many substances, in the majority of cases they are not known since determination is not simplp and in many cases is impossible due to decomposition of the substance before the critical point is reached.
Thus it is important that reliable methods of prediction be available. The ideal is a single relationship for each
.5
of the three constants in terms of easily measurable physical properties giving values for each substance. Much work has already been done in this direction and many empiricalre-lations exist (see Appendix c). In almost all cases, the
re-lations developed apply only to limited groups or series of compounds or else they contain constants which are constant for only one group or series but which vary from group to group.
In recent years, much of the work done has involved the parachor and molar refraction as parameters and equations have been proposed in terms of these properties which satisfy with reasonable limits of accuracy the majority of existing experimental values.
Sugden (59) defined the parachor of a substance:
Parachor =
{P) =
MY 1/4/(D - d) (1) where M = Molecular weightY = Surface tension in dynes/cm. D = Liquid density in grms./cc. d = Vapor density in grms./cc.
- all terms being measured at the same temperature and at the saturation pressure.
He showed that the parachor is substantially independent of temperature and that furthermore parachor values can be
computed directly from the structural formulae of the compounds concerned by use of atomic and structural parachor values and without recourse to equation (1). These values are set out by Mumford and Philips (47) and revised values are given by
parachor values are given in Appendix D. An example will illustrate the simplicity of the calculation:
Toluene has seven carbon atoms, eight hydrogen atoms, three carbon to carbon double b6nds and one six-membered ring, the parachors for these elements being 9.20, 15.40, 19.00 and 0.80 respectively. The parachor calculated for toluene is thus:
Parachor = 7 x 9.2 + 8 x 15.4 + 3 x 19.0 + 1 x 0.8 = 245.4 The observed value for this compound, obtained from equation
(1) is.245.5. In general, agreement to within one per cent of the observed value is possible by this method.
Lorentz and Lorenz (2) have showm by means of the electro-magnetic theory of light that the specific refraction may be represented as follows:
1
r
1 n(2
D n., + 2
where r, = Specif-ic refraction
n = Refractive index measured with monochromatic light of
wave-length X.
D = Density of liquid in grms./cc. - all being measured at the same temperature.
The Molar refraction is defined:
Rd = M r. 2 (3)
The molar refraction is independent of temperature and can be shown to be equal to the volume of the molecules of the sub-stance if the wave-length of the monochromatic light used
7
approaches infinity. Measurements of refractive indices are difficult with light of long wave-length (infra-red) and generally they are measured with monochromatic light of the visible spectrum, usually of the sodium D line. Thus, while not giving the actual volume of the molecules,
(RD]
can be considered as a comparison of such volumes. As in the case of the parachor, molar refractions of many substances can becalculated from atomic and structural values, a list of which are given in Appendix D. For toluene the calculated value is:
7 x 2.418 + 8 x 1.10 + 3 x 1.733 + 0 = 30.92 The value from equation (3) is 31.06.
It seemed possible that, like the parachor and molar refraction, the critical constants themselves may be computed with greater accuracy than at present by a method similar to
that used in these two cases. That is, that in each of the three cases of critical volume, critical temperature and critical pressure, there may exist a series of values, one for each atom and structural element, from which, by si.mple addition, the critical constants may be computed for any
8
III PROCEDURE (1) CRITICAL VOLUMES
The proposal is that the Critical Volume of a com-pound expressed in ccs./grm. mol may be represented by the relationship:
Y p X
(4)
where X is an elemental volume having a parti-cular value for each atom and structural element.
p is the number of atoms or structural elements corresponding to X in the mole-cule.
If this proposal is correct, then the molal critical volumes of the paraffin hydrocarbons, chemical formula Ch H2fn + 2, may be represented as follows:
= n C + (2n + 2)H
=n(C + 2H) + 2H (5)
Here C is the value assigned to the carbon atom and H that assigned to the hydrogen atom..
It is seen from equation (5) that if fbt; this-series the molal critical volume for each member is plotted
against the corresponding number of carbon atoms, a
straight line should result, the intercept of this line on the V. - axis at n = 0 giving the numerical value of 2H and the slope of the line the numerical value of (C + 2H) from which both C and H may be evaluated.
Such a plot is presented on Figure 1 indicating the linear relationship and confirming in the case of the
paraffin hydrocarbons the validity of the proposal. Extending the argument to the case of alcohols and ethers, it is seen that the molal critical volumes of these compounds may be represented:
V.=n(C +.2H) + 2H + 0 (6)
- since a molecule contains n carbon atoms, (2n + 2) hydro-gen atoms and one oxyhydro-gen atom. 0 is the value assigned to the oxygen atom. Thus, to meet the.donditions of the posal, a plot of Vc versus n for these compounds must pro-duce a straight -line of slope equal to that in the paraffin hydrocarbon case.
Making the necessary plot (Figure 2), it was found that this condition, too, is met by the experimental data. The intercept value of Vc at" n = 0 was thus obtained and since this is equal to (2H + 0), 0 was evaluated.
In the case of the esters and carboxylic acids, a molecule contains n carbon atoms, 2n hydrogen atoms, two oxygen atoms and one double bond between a carbon and an oxygen atom. Hence, it may be expected that:
Vc = n(C + 2H) + 2 x 0 + Dco
(7)
Again a straight line of the same slope as in the previouscases resulted from a plot of Vc against n (Figure 3) for these compounds and hence Dco, the value for the carbon-oxygen double bond, was evaluated.
10
Chlorine-substituted paraff ins were used to obtain the elemental value for chlorine. Methane may have either one, two, three, or four of its hydrogen atoms substituted by chlorine atoms and if m represents the number of such sub-stitutions, then these compounds contain one carbon atom, nachlorine atoms and (4 - m) hydrogen atoms. Thus:
Yo = c + (4 - m)H + m 01
= m(Cl - H) + 0 + 4H (8)
The slope of the straight line obtained by plotting V. against m (Figure 4) gave (C1 - H) and hence Cl. Its
intersection on the V0 - axis at m = 0, which is (C + 4H), was found to be in close agreement with the critical volume of methane.
Furthermore, paraffins with one hydrogen atom substi-tuted by one chlorine atom contain n carbon atoms, (2n + 1) hydrogen atoms and one chlorine atom and hence:
Vc = n
a
+ (2n + 1) H + Cl= n(C + 2H) + H + 01 (9)
A plot of Vc versus n for these compounds ras made (Figure 5) and produced a straight line the slope of which was in
agreement with previous cases and the value obtained for Cl was in agreement with that evaluated from equation (8).
Amines contain n carbon atoms., (2n + 3) hydrogen atoms, and one nitrogen atom and therefore:
VC = n C + (2n + 3) H + N
for only two amines and though these can be plotted similarly to other series, the value for N was obtained
by calculating it in each of the two cases from equation (10) and by taking the mean of these two calculated values.
Nitriles contain a carbon-nitrogen triple bond. The citical volumes of these comounds by reasoning similar to that above may be represented:
V0 = n(0 + 2H) + N - H + Ten il) A plot (Figure
6)
of VC versus n, the number of carbonatoms, yielded a straight line of slope consistent with previous plots and an interceot from which Ton, the value
to be assigned to the carbon-nitrogen triple bond was evaluated.
A review of reported experimental critical volumes shows that in no further cases are there sufficient numbers of any series containing a yet unknown elemental value to enable plots to be made similar to those described above. The technique adopted for further evaluations was similar to that used in obtaining a value for nitrogen from the amines.
Thus from the reported olefins and diolefins, a value for the carbon-carbon double bond, Doe, was obtained; and thence from the known critical volumes of the aromatics, a value for the six-membered ring, R6, was determined.
12
The experimentally determined critical volumes of
-mercaptans and organic sulfides were used to obtain a
value, S, for sulfur. Further to this sufficient compounds containing the remaining halogens are available and these were used to obtain values for F, Br and I. Though the
critical volume of only one compound with a carbon to car-bon triple car-bond, namely racetylene, is reported, it was
considered desirable to evaluate Tec from this single result. Again, since the value of the carbon to oxygen double bond gave good predictions for carbon disulfide and sulfur dioxide, it was decided that this value be assigned to the carbon to sulfur and sulfur to oxygen double bonds also.
In all the cases outlined above where, for an element, values had to be calculated separately from several differ-ent compounds and averaged to give a mean, very good agree-ment was obtained between these calculated values.
The elements for which elemental critical volumes have been determined make it possible to calculate the molal
critical volume for the majority of compounds met.vwith in industry. There are reported critical volumes which make
it possible to calculate a few more elemental values from single cases but this was not done since no check on such calculated values was possible. Further experimental data is required so that for any given element, a value may be calculated from at least two different compounds in order to provide the necessary check.
(2) CRITICAL TEMPERATURES
The ratio of the normal boiling temperature, Tb, to the critical temperature, Tc, both expressed in degrees Kelvin, was found to obey a rule similar to that described for critical volumes. The ratio Tb/To may be represented by the relationship:
Tb/To= q Y (12)
where Y is a number having a particular value for each atom and structural element. q is the number of atoms or structural
elements corresponding to Y in the molecule.
For the paraffin hydrocarbons, therefore, Tb/Tc = P C + (2n + 2)H
= n(C + 2H) + 2H (13)
Again, in this case, C is used to denote the value for carbon and H that for hydrogen. A plot of Tb/To versus n, the number of carbon atoms in the molecule, was made and is presented on Figure 7. To obtain the best possible line
through the experimental points, the method of least
squares, described in Appendix E, was used. This yielded values of C and H.
As in the case of critical volumes, the different homologous series of comp:ounds were treated successively such that each contained one unknown elemental value over those previously evaluated. In this manner the values to be assigned to each element were obtained. The order of
14
treatment and the Tb/Tc versus n relationships were as follows:
Olefins:
Tb/To = n(C + 2H) + Dec (14)
- from which the carbon-carbon double bond value, Dco, was obtained (see Figure 8).
Aromatics:
Tb/Tc = n(C + 2H) + R6 + 3 Dec - 6H (15)
- from which R6 , the six-membered ring, was evaluated (see Figure 8).
Ethers:
Tb/Tc = n(C + 2H) + 2H + 0 (16)
- which yielded 0, the oxygen value (Figure 9). Esters:
Tb/To n(C.+ 2H) + 2 x 0 + Doo (17)
- gave the value for the carbon-oxygen double bond (Figure 10)..
Carbbxylic Aids:
Though these compounds are isomeric with the esters, it was discovered that the plot of Tb/To versus n (Figure 11) gave a straight line parallel to that given by the plot for the esters. The difference, structurally, is that the car-boxylic acids contain a hydroxyl group and by assuming that
addition of the oxygen and hydrogen values, this difference was explained. Thus, for the carboxylic acids:
Tb/Tc'= n(C + 2H) + 0 + Dco - H + (OH) (18) - which gave the postulated (OH) value.
Alcohols:
In the case of these compounds, the only serious dis-crepancy from a straight line of slope (C + 2H) as obtained from the paraffin hydrocarbon plot was found. To overcome the difficulty the (OH) value determined from the carboxylic acids was used and this gave a line through the
experimen-tal points which could not be improved upon. For the alco-hols:
Tb/To = n(C + 2H) + H + (OH) (19)
Amines:
Tb/TC = n(C + 2H) + 3H + N (20)
The plot of the experimental points in this case (Figure 11) gave the value for N.
Nitriles:
Tb/Tc = n(C + 2H) + N - H + Ton (21) - from which Ton, the carbon-nitrogen triple bond value was obtained, the plot being presented on Figure 12. Sulfides and Mercaptans:
The organic mono-sulfides and mercaptans are isomeric with each other and a combined plot of Tb/Tc versus n for both series of compounds (Figure 12) yielded a single
Tb/Tc = n(C + 2H) + 2H + S (22) Acetylenes:
Tb/T n(C + 2H) - 2H + Tcc (23)
A plot of Tb/TC versus n in this case (Figure 13) gave the value for Toc, the carbon-carbon triple bond.
Lack of data made it impossible to determine further elemental values by the plotting technique, but values for the halogen elements were determined by a method analogous to that described for critical volumes, namely, the value was calculated for each comDound containing the desired element for which critical temperature data exists. A mean of these values, which were found to be in close agreement, was taken. As with critical volumes, the value found for the carbon to oxygen double bond yielded good predictions for carbon disulfide and sulfur dioxide and so this value was assigned to the carbon to sulfur and sulfur to oxygen double bonds also.
(3) CRITICAL PRESSURES
Meissner and Redding (4_) found that critical pressures may be computed with reasonable accuracy from the
relation-ship:
= 20.8 To o- 8) (24)
Both this and the proposal by Wohl (68) and (69):
PC = 21.8 TO/Vc (25)
may be expressed in the form:
T/P c = A VC + B (26)
where A and B are constants. Remembering that:
V- = C n + D (27)
where C and D are constants, characteristic of each homologous series and predic-table from atomic and structural values.
and n is the number of carbon atoms in the molecule considered.
- it may be expected that:
Tc/Pc = A' n + B' (28)
where At and B' are constants of a similar
nature to those of equation (261 Plotting the ratio of T /P versus n for a number of homologous series produces a series of curves which have slightly varying slopes and which have a definite curvature.
A study of these curves led to the suggestion that a relationship of the form:
Tc/Pca = A' n + B' (29)
18
that: 0<,a<.1.0 , the other terms having the same signi-ficance as before. This is equivalent to saying:
T/P c
Z r
Z
(30)where Z is a number having a particular value for each atom and structural element. r is the number of atoms or structural
elements corresponding to Z in the molecule.
A study of this proposal was made and it was found that in the cases of the paraffin hydrocarbons, olefins, aroma-tics, ethers, esters, amines, chlorine-substituted paraffins, sulfides and mercaptans, a value of "a" equal to 0.80 gave plots of TC/Pca versus n which were straight lines of equal slope. These plots are presented on Figures 14 to 18.
From them, elemental values of C, H, Dec> R6, 0, Dco, N, C1 and S were obtained by a method analogous to that used for critical volumes and critical temperatures.
Using the exponent of 0.80 for the alcohols, nitriles, carboxylic acids and phenols gave plots neither oarallel to those already considered nof straight. However, it was found that by assigning different values for the exponent for each series the plots of TC/P ca versus n could be made straight and parallel to those above. It was found that the exponents to be used were:
0.65 for the alcohols
0.68 for the nitriles
0.685 for the carboxylic acids and 0.665 for the phenols.
Plots or Tc/P versus n for the first two of these cases are presented on Figures 19 and 20 and from them values for the (OH) group and the carbon to nitrogen triple bond were obtained..
Values for F) Br, I, T and T were .calculated from.
cc nn
the experimental data for isolated compounds, average-values being taken in each case. The carbon to sulfur d.ouble bond. value was assumed to be equal to those for the carbon to carbon and the carbon to oxygen double bonds since this gave a reasonable prediction for carbon disul-fide using an exponent of 0.80. Similarly the sulfur to
oxygen double bond was assumed to be equal to this value since it gave a prediction not greatly in error for sul-fur dioxide.
IV RESULTS (1) CRITICAL VOLUMES
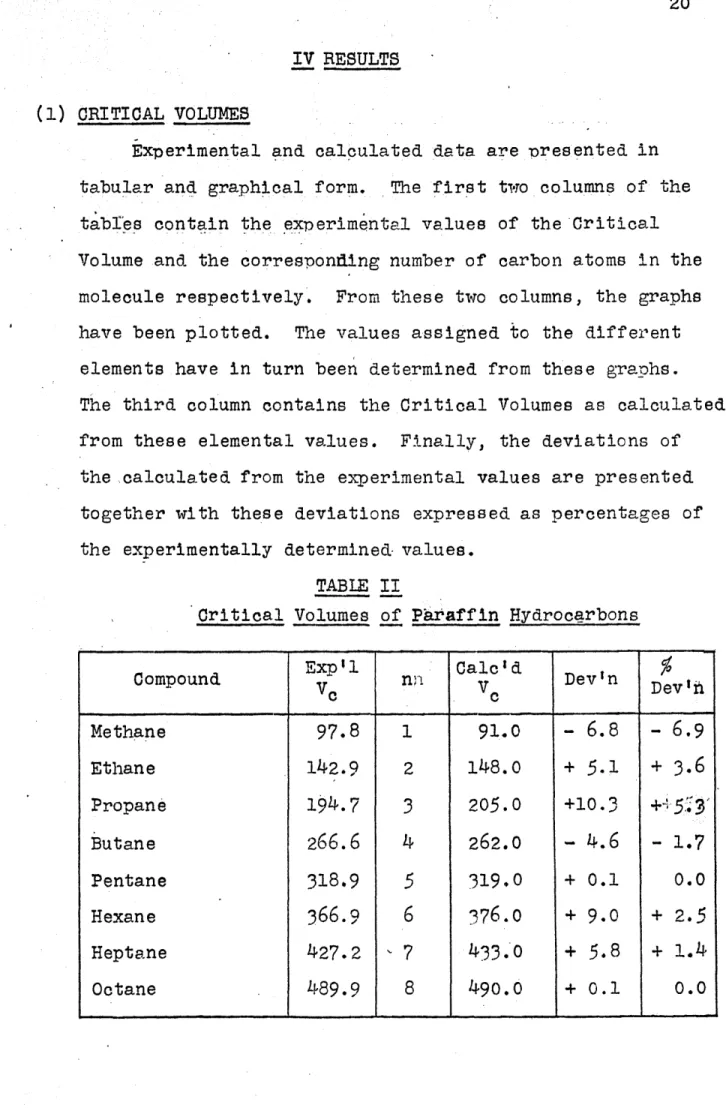
Experimental and calculated data are oresented in tabular and graphical form. The first two columns of the tables contain the experimental values of the Critical Volume and the corresponding number of carbon atoms in the
molecule respectively. From these two columns, the graphs have been plotted. The values assigned to the different elements have in turn been determined from these graphs. The third column contains the Critical Volumes as calculated from these elemental values. Finally, the deviations of the calculated from the experimental values are presented together with these deviations expressed as percentages of the experimentally determined- values.
TABLE II
Critical Volumes of Paraffin Hydrocarbons
Ep lCalcd De'n Ded
Compound xpl c Devn D Vc eh Methane 97.8 1 91.0 -
6.8
-6.9
Ethane 142.9 2 148.0 + 5.1 + 3.6 Propane 194.7 3 205.0 +10.3+5
Butane 266.6 4 262.0 4.6 - 1.7 Pentane 318.95
319.0 + 0.1 0.0 Hexane 366.96
376.0
+ 9.0 + 2.5 Heptane 427.2 7 433.0 + 5.8 + 1.4 Octane 489.9 8 490.0 + 0.1 0.0500
4,o r4 4>4 4300 200 Fig-ureI 01RITICAL VOLUMES I Paraffin.Hydrocarbons 100 03
4
5
6
7
9
10
NO. -Of Carbon Atoms. . n
300)
CRITICAL VOLMDS II Alcohols o Et hersa 100o
23
4
5
6
7
9
1oNo. of Carbon Atoms... n
23
Experimental values of V. versus n for the Paraffin Hydrocarbons are plotted on Figure 1 from which:
Slope of Curve = C + 2H = 57.0)
Vc at n = 0 2H = 34.0)
Hence C = 23.0 H = 17.0 TABLE III
Critical Volumes of Alcohols and Ethers
Exptl1 n Calcd - % Compound Devrn D Vc Vc Dev'h Methyl Alcohol 117.7 1 112.0 -
5.7
- 428 Ethyl Alcohol 167.3 2 169.0 + 1.7 + 1.0 n-Propyl Alcohol 219.8 3 226.0 + 6.2 + 2.8 Methyl Ether 169.7 2 169.0 - 0.7 - 0.4 Methyl Ethyl Ether 222.2 3 226.0 + 3.8 + 1.7Ethyl Ether 282.4 4 283.0 + o.6 + 0.2
Ethyl Propyl Ether 341.1
5
340.0
1.1 - 0.3Experimental values of Vc versus n for the Alcohols and Ethers are presented on Figure 2 from which:
V. at n = 0 =2H + 0 =
55.0,
Hence O= 21.0 TABLE IV(a)Critical Volumes of Carboxylic Acids
Compound Ex'l n Calc'd Devn De%n
V0 y
Acetic 170.9 2 174.0 + 3.1 + 1.8
Propionic Acid 234.9
3
231.0 - 3.9 - 1.7n--Butyric Acid 291.4
4
288.0 - 3.4 - 1.2TABLE IV(b)
Critical Volumes of Esters
Compound Exp1 n Cab16 d Dev'n
VC VC Devin Methyl Formate 171.9 2 174.0 + 2.1 + 1.2 Ethyl Formate 229.1 3 231.0 + 1.9 + 0.8 Propyl Formate 284.8 4 288.0 + 3.2 + 1.1 Isobutyl Formate 354.2
5
345.0 - 9.2 - 2.6 Isoamyl Formate 411.46
402.0 -- 9.4 - 2.3 Methy. Acetate 227.7 3 231.0 + 3.3 + 1.5 Ethyl Acetate 285.7 4 288.0 + 2.3 + 0.8 Propyl Acetate 344.6 5 345.0 + 0.4 + 0.1 Isobutyl Acetate 415.8 6 402.0 -13.8 -3.3
Methyl Propionate 282.1 4 288.0 +5.9
+ 2.1 Ethyl Propionate 344.6 5 345.0 +o.4
+ 0.1 Methyl Butyrate 340.05
345.0 + 5.0 + 1.5 Methyl Isobutyrate 339.05
345.0 +6.0
+ 1.8 Ethyl Butyrate 405.86
402.0 - 3.8 - 0.9 Ethyl Isobutyrate 420.06
402.0 -18.0 - 4.3 Methyl Valerate 415.86
402.0 -13.8 - 3.3Experimental values of Vc versus n for the Carboxylic Acids and the Esters are presented on Figure 3 from ihich:
V. at n = 0 = DOo + 2 x 0 =
6o.o
500
rd300
0
0 1
2
3
4
5
6
7
9
9
0
NO. Of Carbon Atomls... n C-V Ma
TABLE V
Cri ti cal Volumes of Chlorine-substituted Methanes
Compound EXP m CalcId Dev'n /%
Vc Vc DevIn
Methyl Chloride 136.5 1 137.5 + 1.0 + 0.7
Chloroform 231.0 3 230.5 - 0.5 - 0.2 Carbon Tetrachloride 276.0 4 277.0 + 1.0 + 0.4
Experimental values of V0 versus m for the
Chlorine-substituted Methanes are presented on Figure 4 from which: Slope of Curve = C1 - H = 46.5 Hence Cl =
63.5
TABLE VI
Critical Volumes of Chlorine-substituted Paraffins
Compound Exp i l Calccd Devin
Vc c DevIn
Methyl Chloride 136.5 1 137.5 + 1.0 + 0.7 Ethyl Chloride 195.5 2 194.5 - 1.0 - 0.5
Experimental values of Vc versus n for the Chlorine-substituted Paraffins are oresented on Figure 5 from which:
V. at n = 0 = H + 01 = 80.5 Hence Cl =
63.5
- thus confirming the value obtained from Figure 4.0
4.,
Ugzure
CR IT ICAL VOLUMES IV Chlor ine-subst ituted Me thane a
0
0 2* 34
No. of Carbon Atoms... m .. . May 1st.,1
c < 4 a CRITICAL VOLUMES V Chlorine-substituted Paraffins
*o, Of Garbon Atoms...., zi
-Soo 600
300
200 Figure CRITICAL VOLUMES V Amines 12
5 6
70
No. Of Carbon Atoms.,... n
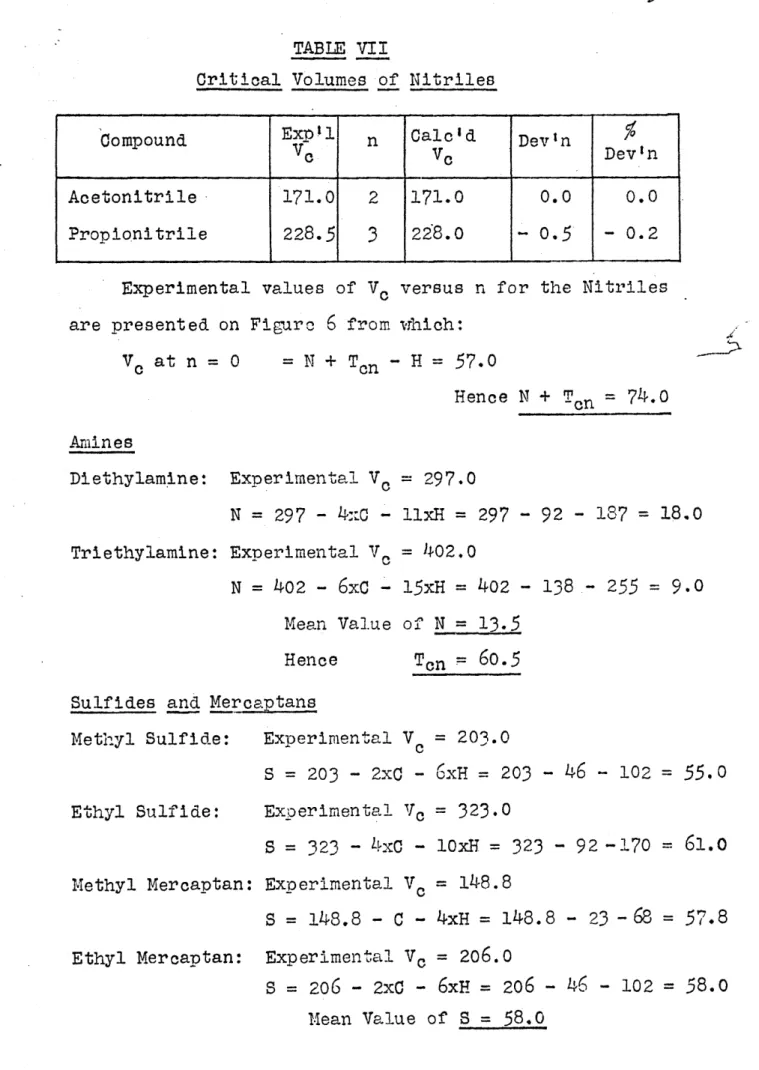
TABLE VII
Critical Volumes of Nitriles
Compound Expel n Calc'd Devin
Ve VC Devn
Acetonitrile 171.0 2 171.0 0.0 0.0 Propionitrile 228.5
3
228.0 0.5 - 0.2Experimental values of VC versus n for the Nitriles are presented on Figure
6
from which:VC at n = 0 = N + Ton - H =
57.0
Hence N + Tcn = 74.0 Amines Diethylamine: Triethylamine: Experimental Vo = 297.0 N = 297 - 4:c - llxH = 297 - 92 - 187 = 18.0 Experimental V. = 402.0 N = 402 -6xC
- 15xH = 402 - 138,- 255 = 9.0 Mean Value of N = 13.5 Hence Sulfides and Mercaptans Methyl Sulfide: Ethyl Sulfide: Experimental Vc = 203.0 S = 203 - 2xC -6xH
= 203 - 46 - 102 =55.0
Exoerimental Vc = 323.0 S = 323 - 4x0 - lOxH = 323 - 92 -170 =61.0
Methyl Mercaptan: Experimental Vc = 148.8S = 148.8 -
C
- 4xH = 148.8 - 23 -68 = 57.8 Ethyl Mercaptan: Experimental V. = 206.0S = 206 - 2xC -
6xH
= 206 - 46 - 102 =58.0
Iean Value of S = 58.031
Olefins and Diolefins
Ethylene: Experimental Vc = 127.2 Dcc = 127.2 - 2x0 - 4xH = 127.2 - 46
68
= 13.2 Butadiene-l,3: Experimental V c = 220.5 2xDcc =220.5 - 4xC -6xH
= 220.5 - 92 - 102 = 26.5 Mean Value of Dcc = 13.2 Aromatics Benzene: Experimental V= 256.2 R6 = 256.2 - 6x0 -6xH
- 3xDoc = 256.2 - 138 - 102 - 39.6 = -23.4 Toluene: Experimental Vc 31 '51 R6 = 315.1 - 7-C - 8xH - 3xDoc = 315.1 - 161 - 136 - 39.6 = -21.5 Mean Value o! R6 = -22.5 Acetylenes Acetylene: Experimental Vc 112.7 Toc = 112.7 - 20 - 2H = 112.7 - 46 - 34 = 32.7 Mean Value of T.c = 32.7 Fluorine-substituted Hydrocarbons Dichlorodifluoromethane: Experimental Vc = 218.0 2xF = 218 - 0 - 2x01 = 218 - 23 - 137 =68.o
Fluorobenzene: Experimental V = 271.5 F = 271.5 - 6x0 -5xH
- R6 - 3xD0c = 271.5 - 138 - 85 + 22.5 - 39.6 = 31.4 Mean Value of F = 33.1Bromine-substituted Hydrocarbons
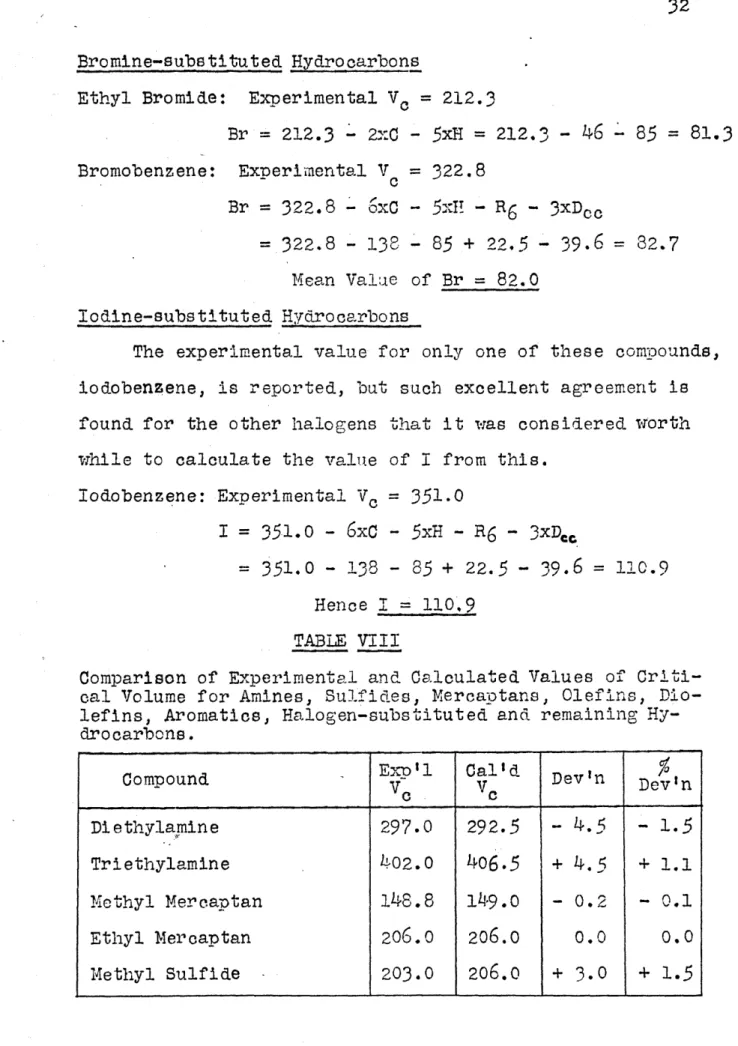
Ethyl Bromide: Experimental V. = 212.3
Br = 212.3- 2xC - 5xH = 212.3 -46 -85 = 81.3 Bromobenzene: Experimental Vc 322.8 Br = 322.8 6xC -
5xH
- R6 3xDoc =.322.8 - 138 - 85 + 22.5 -39.6
= 82.7 Mean Value of Br = 82.0 Iodine-substituted HydrocarbonsThe experimental value for only one of these compounds, iodobenzene, is reported, but such excellent agreement is found for the other halogens that it was considered worth while to calculate the value of I from this.
Iodobenzene: Experimental V= 351.0
I
= 351.0 -6xC
-5xH
- R6 -3xDee
= 351.0 - 138 - 85 + 22.5 -
39.6
= 110.9Hence I = 110,9 TABLE VIII
Comparison of Experimental and Calculated Values of Criti-cal Volume for Amines, Sulfides, Mercaptans, Olefins, Dio-lefins, Aromatics, Halogen-substituted and remaining Hy-drocarbons.
Compound Exopl Cald Dev'n pevn
C C Diethylamine 297.0 292.5 - 4.5 - 1.5 Triethylamine L02.0 406.5 + 4.5 + 1.1 Methyl Mercaptan 148.8 149.0 - 0.2 - 0.1 Ethyl Mercaptan 206.0 206.0 0.0 0.0 Methyl Sulfide 203.0 206.0 + 3.0 + 1.5
33
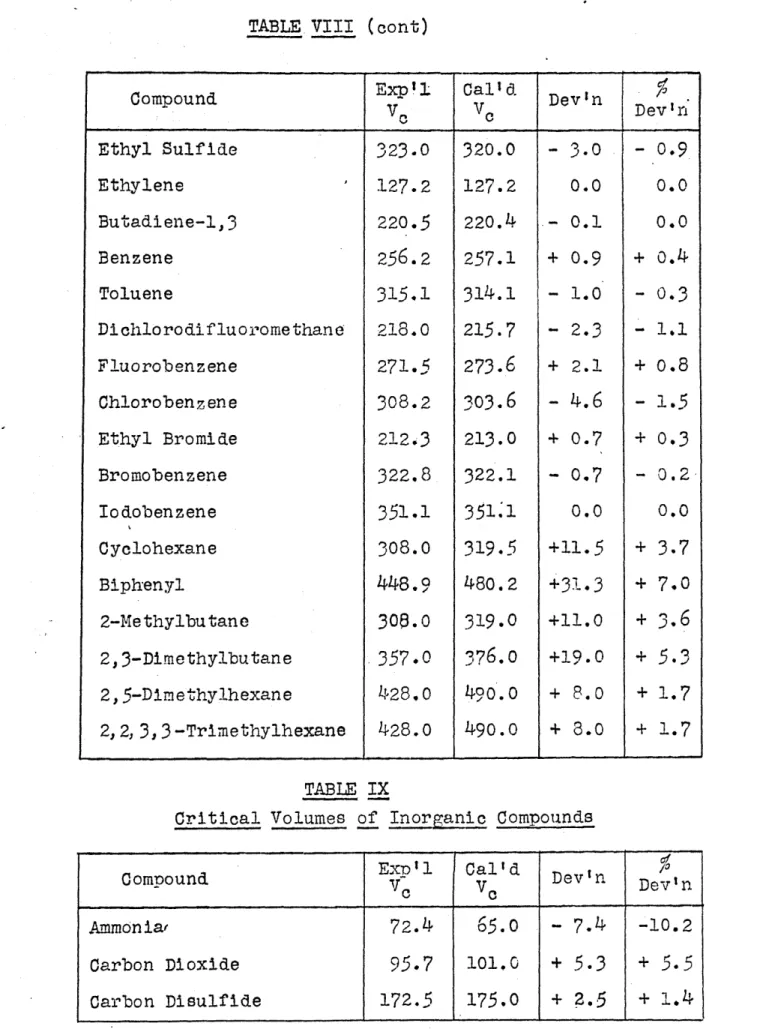
TABLE VIII (cont)
Compound p i Calld Dev'n
-oe o Dev Inr Ethyl Sulfide 323.0 320.0 - 3.0 - 0.9 Ethylene 127.2 127.2 0.0 0.0 Butadiene-1,3 220.5 220.4 - 0.1 0.0 Benzene 256.2 257.1 + 0.9 + 0.4 Toluene 315,1 314.1 - 1.0 - 0.3 Dichlorodifluoromethane 218.0 215.7 - 2.3 - 1.1 Fluorobenzene 271.5 273.6 + 2.1 + 0.8 Chlorobenzene 308.2 303.6 - 4.6 - 1.5 Ethyl Bromide 212.3 213.0 + 0.7 + 0.3 Bromobenzene 322.8 322.1 - 0.7 - 0.2 Iodobenzene 351.1 351.1 0.0 0.0 Cyclohexane 308.0 319.5 +11.5 + 3.7 Biph'enyl 448.9 480.2 +31.3 + 7.0 2-Methylbutane 300.0 319.0 +11.0 + 3.6 2,3-Dimethylbutane 357.0 376.0 +19.0 +
5.3
2,5-Dimethylhexane 428.0 490.0 + 8.0 + 1.7 2,2, 3,3-Trimethylhexane 428.0 490.o + 8.0 + 1.7 TABLE IXCritical Volumes of Inorganic Compounds
Compound 1Expl Cal'd Dev'n
C c
Ammonia 72.4
65.0
- 7.4 -10.2Carbon Dioxide 95.7 101.0 +
5.3
+5.5
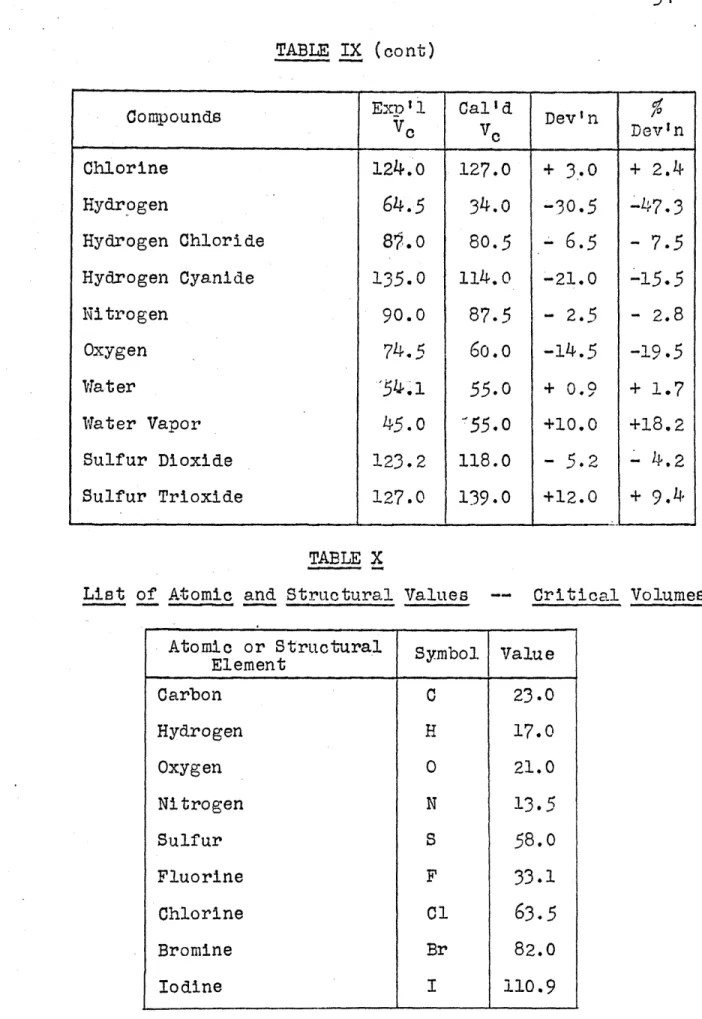
TABLE IX (cont)
Compounds Exp 1 Cald Dev'n
Chlorine 124.0 127.0 + 3.0 + 2.4
Hydrogen
64.5
34.0 -30.5 -47.3Hydrogen Chloride 8',.O 80.5 -
6.5
- 7.5 Hydrogen Cyanide 135.0 114.0 -21.0 -15.5 Nitrogen 90.0 87.5 - 2.5 - 2.8 Oxygen 74.5 6o.o -14.5 -19.5 Water54.1
55.0 + 0.9 + 1.7 Water Vapor 45.0 55.0 +10.0 +18.2 Sulfur Dioxide 123.2 118.0 - 5.2 - 4.2 Sulfur Trioxide 127.0 139.0 +12.0 + 9.4 TABLE XList of Atomic and Structural Values Critical Volumes
Atomic or Structural Symbol Value
Element_________ Carbon C 23.0 Hydrogen H 17.0 Oxygen 0 21.0 Nitrogen N 13.5 Sulfur S 58.0 Fluorine F 33.1 Chlorine Cl 63.5 Bromine Br 82.0 Iodine I 110.9
35
TABLE X (cont)
Atomic or Structural Symbol "Value El-ement
Double Bond (0=0) Dcc 13.2 Double Bond (0=0) Doo 18.0 Double Bond (C=S) Dos 18,0 Dot6le Bond (S=0) Dso 18.0 Triple Bond (CEC) Tec 32.7 Triple Bond (EN) Ton
6o.5
Triple Bond (NEN) Tnn
60.5
Six-membered Ring(2) CRITICAL TEMPERATURES
Experimental and calculated d.ata are again presented in both tabular and graphical form in a manner similar to that used foi' Critical Volumes.
The first two columns of the tables contain the experi-mentally determined Normal Boiling and Critical Temperatures, expressed in degrees Kelvin. Following these are the ratios of the Normal Boiling to the Critical Temperatures and the corresponding number of carbon atoms in the molecule, n. From these two columns, the graphs of the Normal Boiling, to Critical Temperature Ratio versus Number of Carbon Atoms in the molecule have been plotted. The values assigned to the various elements have been -determined from these graphs. Coluitins
(5)
and(6)
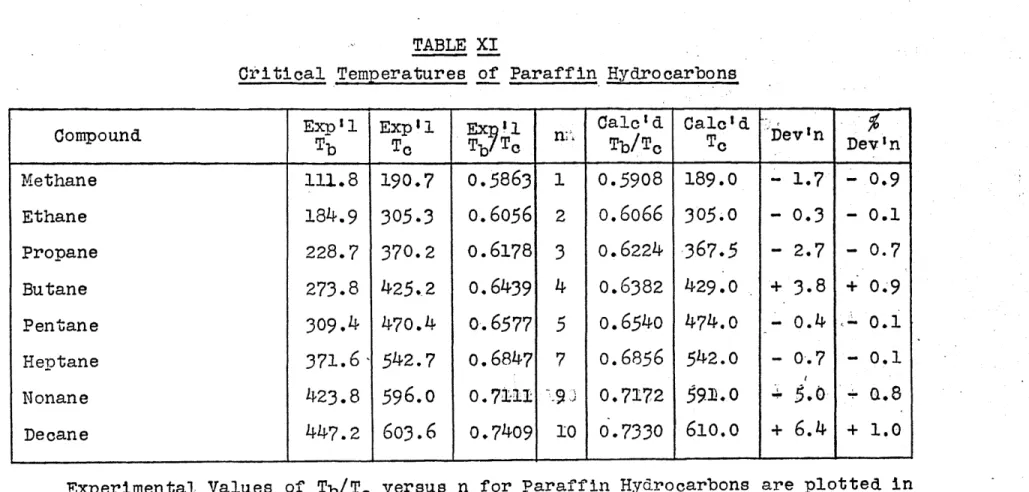
present the calculated values of the Normal Boiling to the Critical Temperature Ratio and the Critical Temperature respectively. Finally, the deviati.ons of the calculated from the experimental values of the Criti-cal Temperature are presented together with these deviations expressed as percentages of the experimentally determinedTABLE XI
Critical Temperatures of Paraffin Hydrocarbons
Compound b Expl EX n. Calcid Calc'd ]ev'n
Tb To TbT n Tb/To To DevIn
Methane 111.8 190.7
0.5863
1 0.5908 189.0 1.7 - 0.9Ethane 184.9 305.3
o.6056
2o.6o66
305.0 - 0.3 - 0.1Propane 228.7 370.2 0.6178 3 0.6224 367.5 - 2.7 - 0.7 Butane 273.8 425.2 0.6439 4 0.6382 429.0 + 3.8 + 0.9 Pentane 309,4 470.4
0.6577
5o.6540
474.0 - 0.4 0.1 Heptane 371.6- 542.7 0.6847 7 0.6856 542.0 - 0.7 - 0.1 Nonane 423.8 596.0 0.7111 9 0.7172 591.05.0,
Q.8 Decane 447.2 603.6 0.7409 10 0.733061o.o
+6.4
+ 1.0Experimental Values of Tb/Tc versus n for Paraffin Hydrocarbons are plotted in Figure
7
from which:Slope of Curve = C + 2H = 0.0158
)
) Tb/To at n = 0 = 2H = 0.5750)
Hence C = -0.5592 H = 0.2875 "J)o.65
ligure
7
0.570
5
7
8
9
10
No. of Oarbon Atoms,... .. n
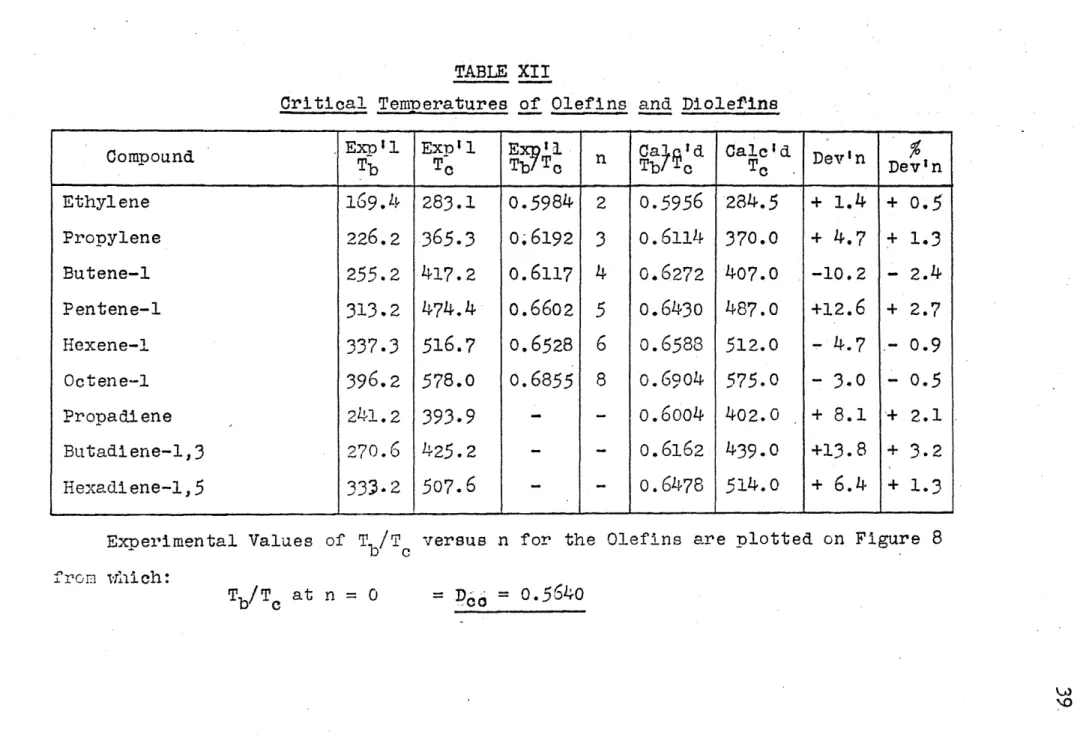
TABLE XII
Critical Temp eratuires o Olefins and DioleI'ins
Compound - . E l E p1 nx~ a~ d Calc'id. { Dev'in De i n
Ethylene 169.4 283.1 0.5984 2
0.5956
284.5 + 1.4 + 0.5 Propylene 226.2365.3
o.61923
0.6114 370.0 + 4.7 + 1.3 Butene-l 255.2 417.2 0.6117 4 0.6272 407.0 -10.2 - 2.4 Pentene-1 313.2 474.4 0.66025
0.6430 487.0 +12.6 + 2.7 Hiexene-1337.3 516.7
0.65286
0.6583 512.0 - 4.7 -0.9 Octene-1 396.2578.0
0.6855 8 0.6904 575.0 - 3.0 -o.5
Propadiene .241.2393.9
- - 0.6004 402.0 + 8.1 ~+ 2.1 Butadiene-1,3 270.6 425.2 - -- 0.6162 439.0 +13.8 + 3.2 Hexadliene-1,5 333-2 507.6 - -- 0.6478514.0
+6.4
+ 1.3Experimental Values of7 Tb/c versus n for the Olefins are plotted on Figure 8 from wrhich:
Tb/Tc at n =0 =-o = 0.5640
41
AA
SOle f in o Aromatics * U 2 ~ 8 6 * gNo. of Carbon
Atome...n
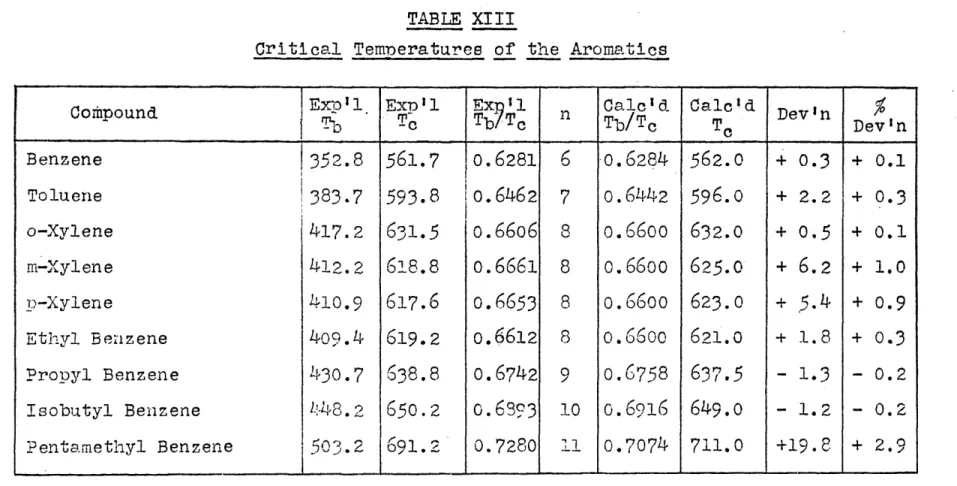
TABLE XIII
Critical Temoeratures of the Aromatics
Cothpund
IExP']0l
Ex 1l T-c Ex?1 Tb/Tc Calcid Calc'd Devn %Tb/Tc T D Devin
Benzene 1352.8 561.7
o.6281
6
o.6284
562.0 + 0.3 + 0.1Toluene j383.7 593.8 io.6462 7 o.6442 596.o + 2.2 + 0.3
o-Xylene 417.2 631.5 0.6606 8 o.66oo 632.0 + 0.5 + 0.1
m-Xylene 412.2 618.8
o.6661
8o.66oo
625.0 + 6.2 + 1.0p-Xylene 410.9 617.6 o.6653 8 o.66oo 623.0 + 5.4 + o.9
Ethyl Benzene 409.4 619.2 o.6612 8 o.66oo 621.0 + 1.8 + 0.3
Propyl Benzene 430.7 638.8 o.6742 9 0.6758 637.5 - 1.3 - 0.2
Isobutyl Benzene 448.2 650.2 c.6393 io o.6916 649.o - 1.2 - 0.2
Pentamethyl Benzene
503.2
691.2 0.7280 11 0.7074 711.0 +19.8 + 2.9Exoerimental values of Tb/T c versus n for the Aromatics are plotted on Figure 8
from wfhich:
Tb/To atn=O = 3Doc + R-6H=
5336
Hence = .5666.
Critical Temperatures of the Ethers
Cornpund~sExpil Exp'l EXI~ 1 Calc'd Calcid e'
Copud b T0 TbIc Tb/Tc To ei De'n
Methyl Ether 24I8.3
40o.1
0.6206 20.6231
398.0 - 2.1 - 0.5Methyl Ethyl Ether 281.1 437.9 0.6419
3
0.6389 440.0 + 2.1 + 0.5Ethyl Ether 307.7 467.0 0.6589
4
0.6547 470.5 + 3.5 + 0.7Ethyl Propyl Ether
334.6
500.6 0.6684 50.6705
499.0 - 1.6 - 0.3Ethyl Allyl Ether 340.3 518.2 0.6577 -
0.6596
517.0 - 1.2 - 0.2Methylene Diethyl Ether 362.2
527.2
0.6870 - 0.6870 527.2 0.0 0.0Experimental values of Tb/To versus n for the Ethers are plotted on Figure 9 from which:
Tp
065
CRITI(AL TEMPERATURES III Etherse
o Alcohols
02
3
4
5
6
7
8
9
10
No. of Carbon Atoms,...
Temperatures of
Compounds Exp1 EXp'l Exp'l n Calc'd Calc'd Dev'n %
Tb Tc Tb/O Tb/Tc To Devin
Methyl Formate 305.0 487.2 0.6260 2
0.6286
486.o - 1.2 - 0.2Ethyl Formate 327.5 508.5
o.6441
3 o.6444 509.0 + 0.5 + 0.1Propyl Formate 354.5 538.0 o.6589 4 0.6602 537.0 - 1.0 - 0.2
Isobutyl Formate 371.4 551.2
o.6738
5
0.6760 550.0 - 1.2 - 0.2Isoamyl Formate 396.7 576.2 0.6885
6
o.6918
574.0 - 2.2 - o.4Methyl Acetate 330.3
506.9
o.6516
3o.6444 513.0
+6.1
+ 1.2Ethyl Acetate 350.3 523.2 0.6695 4
o.6602
531.0 + 7.8 + 1.5Propyl Acetate 374.8 549.4 0.6822 5
o.6760
555.0 + 5.6 + 1.0n-Butyl Acetate 399.7 579.2 o.6901 6 o.6918 578.0 - 1.2 - 0.2
Isoamrl Acetate '45.7 599.2 0.6938 7 0.7076 588.0 -11.2 - 1.9
Methyl Propionate 353.1 530.6 o.6655 4 0.6602 535.0 + 4.4 +
o.5
Ethyl Propicnate 372.3 546.1
o.6817
5 0.6760 551.0 + 4.9 + .0.9Propyl Prepionate 396.6 578.2
o.6859
6
0.6918 573.0 - 5.2 - 0.9TABLE XV (Cont)
CompoundEx-l EXP'1 Expi n CalcId aloid Devn %
Tb Tb/To Tb/To T De n Isobutyl Propionate Isoamyl Propionat'e Hethyl Butyrate Methyl Isobutyrate Ethyl Butyrate Ethyl Isobutyrate Propyl Butyrate Propyl Isobutyrate Isobutyl Isobutyrate Isoamyl Isobutyrate Methyl Valerate Ethyl Valerate Ethyl Isovalerate Propyl Isovalerate Isobutyl Isovalerate 411.2 592.2
433.4
375.5
365.8
394.5
384.9
416.2408.6
421.9 451.84oo.5
418.74o 8.2
429.1 441.7 611.2554.5'
540.7566.2
553.2
6oo.2
589.2602.2
619.2
567.2
570.2588.2
609.2 621.20.6944
0.7091 0.67720.6765
0.6968
0.6958
0.6934
0.69350.7006
0.7279 0.7061 0.7343o.
6934
0.7044 0.71107
85
5'
6
6
7
7 89
6
77
8 90 _____________________________________________________________________________________________ I L __________________________ ________________ 0.1076
0.7234 0.676o
0.6760
0.6918 0. 6918 0.70760.7076
0.7234 0.7392 0.6918 0.70760.7076
0. 7234 0. 7392 582.06oo.o
556.0
541.0
576.0
556.0
588.0577.5
584.0 613.0579.0
592.0 578.0594.0
6oo.o
-10.2 -11.2 + 1.5 + 0.3+ 3.8
+ 2.8 -12.2-11.7
-18.2 - 6.2 +11.8 +21.8 -10.2 -15.2 -21.2 - 1.7 - 1.8 + 0.3 + 0.1 + 0.7 1+ 0.5 2.0 2.03.0
- 1.0 + 2.1 + 3.8- 1.7
- 2.5 - 3.4from which:
Tb/Tc at n = 0 = 2 x 0 + Doo = 0.5970
Hence Doo =
0.5640
This value for Dco is equal to that obtained for DOc*.
4* 6 4-P P I OTN I /Cl1, 0 !VeV
Critical Temperatures of the Carboxylic Acids
Exptl Exp'l Expil Calcd Calcd d
Compound- Tb Tc TbTc n Tb/To To Devin DevIn
Acetic Acid 391.3 59
4.8
0.6579
2 0.6628 590.0 - 4.8 - 0.8Propionic Acid 414.3 611.7 0.6773 3 0.6786
611.o
- 0.7 - 0.1n-Butyric Acid 436.7 628.2 0.6952 4 0.6944 631.0 + 2.8 + 0.4
i-Butyric Acid 427.6 609.2 0.7019 4 0.6944 616.o + 6.8 + 1.1
n-Valeric Acid 460.2 652.2 0.7056 5 0.7102 648.0 - 4.2 - 0.6
i-Valeric Acid 449.9 634.2 0.7094 5 0.7102 633.0 - 1.2 - 0.2
Experimental values of Tb/c versus n for the Carboxylic Acids are plotted on Figure 11 from which:
Tb/T c at n = 0 =Dco + 0 + (OH) - H = 0.6312
TABLE XVII
Critical Temperatures of the Alcohols
Exp'l Exp'l Exp 1 Calc'd Cal'd D
Compound b TTb TbTc n TblTc To Devin Devin
Methyl Alcohol 337.7 513.2
o.6580
1 0.6405 527.0 +13.8 + 2.7Ethyl Alcohol 351.7 516.3 o.6812 2 o.6563 535.0 +18.7 + 3.6
n-Propyl Alcohol 371.0
536.9
0.6910
3o.6721
552.0 +15.1 + 2.8i-Prepgrl-Alcbh61 355.5 568.2 o.6995. 0.6721 5'9.0 +20.8 + 4.1
n-Butyl Alcohol 390.9 560.2 o.6978 4
o.6879
569.0 + 8.8 + 1.6i--Butyl :Alcoholr 380.5 538.2 0.7070 4 0.6879 554.0 +15.8 + 2.9
sec-4Butyl Alcohol-' 372.8 538.2 o.6927 4 o.6879 542.5 + 4.3 + 0.8
tert-Butyl Alcohol 356.0 508.2 0.7005 4 0.6879 518.0 + 9.8 + 1.9
i-Amyl Alcohol 403.7 580.2 0.6958
5
0.7037 574.o -6.2
- 1.1tert-Amyl Alcohol 375.0 545.2
o.6878
5 0.7037 533.0 -12.2 - 3.2n-Heptyl Alcohol 449.0 638.2 0.7035 7 0.7353 611.0 -27.2 - 4.3
n-Octyl Alcohol 467.2 658.2 0.7098 8 0.7511 622.0 -36.2 -
5.5
Critical Temperatures of the Amines
Compound Expl Expr1 To~on Ex i nbT 'Tv~ Ca c'd Calc'd %TDe
Tb
Tcb To Tc DevnMethylamine
266.7 430.1
0.6201
1
0.6158
433.0
+ 2.9 + 0.7
Ethylamine 289.8 456.40.6350
2 0.6316 459.0 + 2.6 +o.6
Propylamine 321.9 497.0 0.6477 3 0.6474 497.0 0.0 0.0 Dimethylamine 280.6 437.8 0.6409 2 0.6316 444.0 + 6.2 + 1.4 Diethylamine 329.2 496.7 0.6628 4 0.6632 496.5 - 0.2 0.0 Dipropylamine 383.9 550.2 0.69776
0.6948 552.0 + 1.8 + 0.3 Trimethylamine 276.7 434.2 0.6373 3o.6474
427.0 - 7.2 - 1.7 Triethylamine 362.7 535.2 0.67776
0.6948 522.0 -13.2 - 2.5 Aniline 457.6 699.2 - - 0.6534 700.0 + 0.8 + 0.1 Methyl Aniline 468.9 702.2 - - 0.6692 702.0 - 0.2 0.0Dimethyl Aniline 466.7 688.2 -
o.6850
682.0 - 6.2 - 0.9Experimental values of Tb/Tc versus n for the Amines are plotted on Figure 11 from which:
Hence N = - 0.2625 Tb/ Tc at n = 0 = 3H+N