Design of a Constraint Device for Compliant Bodies using Quasi-Conformal
Contact Surfaces as Applied to Mouse Imaging
by
Lucy W. Du
S.B. Mechanical EngineeringMassachusetts Institute of Technology, 2014
Submitted to the Department of Mechanical Engineering in Partial Fulfillment of the Requirements for the Degree of
Master of Science in Mechanical Engineering at the
Massachusetts Institute of Technology
June 2016
@ 2016 Massachusetts Institute of Technology All rights reserved.
ARCHIVE
MASSACHUSETTS INSTITUTE OF TECHNOLOGY
LIBRARIES
Signature of Author...
Signature redacted
Lucy W. Du Depar met of Mechanical Engineering
May 20, 2016
Signature redacted
Certified by
7 ... ...
....
....
.y......
Martin L. Culpepper Professor of Mechanical Engineering Thesis Supervisor
Accepted by...
Signature redacted
Rohan Abeyaratne Professor of Mechanical Engineering Graduate OfficerDesign of a Constraint Device for Compliant Bodies using
Quasi-Conformal Contact Surfaces as Applied to Mouse Imaging
by Lucy W. Du
Submitted to the Department of Mechanical Engineering on May 20, 2016 in Partial Fulfillment of the Requirements for the Degree of
Master of Science in Mechanical Engineering
ABSTRACT
The purpose of this work is the modeling and prototyping of quasi-conformal constraint contacts and the investigation of their positioning ability for compliant bodies, specifically for the holding of mice in optical imaging setups. The direct application of this work is the restraint of laboratory mice for biological imaging of micron- and submicron-scale biological structures. No existing research has measured the shear stiffness of mouse facial tissue or modeled the effect of quasi-conformal contact constraints on nonlinear materials. The constraint devices and techniques currently available for mice have limitations that have prevented further exploration of their biological structures. The theoretical model, design rationale, and testing results of a prototype device utilizing quasi-conformal constraints are presented in this thesis. This device is capable of restraining anesthetized mice to sub-micron movement in all axes of translation, without additional surgery or discomfort to the mouse. With the findings presented in this thesis, the design of further optimized devices can be made-both for anesthetized and awake mice-enabling further studies in bone marrow and neural activity that are currently impossible. This could ultimately lead to breakthroughs in stem cell and neurobiological research.
Thesis Supervisor: Martin L. Culpepper
ACKNOWLEDGEMENTS
There are truckloads of people that have supported me through this whole "these-ing" process whom I cannot thank enough.First, I would like to Professor Marty Culpepper, who welcomed me into the Precision Compliant Systems Lab (PCSL) long ago, when I was just a wee-sophomore. I have learned countless invaluable skills-professional, academic, and otherwise-over the last 5 years. Without his guidance and support, I would not have become the engineer that I am today.
Next, I would like to thank the staff at MGH Center for Systems Biology, Professor Charles Lin, and Professor Shih-Chi Chen for their collaboration on this project. Many thanks to Raphael Turcotte for the help in testing and understanding the application and scope of the project. Particularly, I would like to thank Tony Raphael for his help, patience, and time while Rachel and I came over to MGH time after time with various odd requests for mouse testing. He has gone incredibly out of his way to help us with our data collection.
My fellow PCSL labmates (Aaron Ramirez, Marcel Thomas, Charlie Wheeler, and Rachel Dias Carlson) have provided much encouragement and advice over the past several years. Without their guidance and wise words about research, classes and grad life in general, I would still probably be running around in circles with my hair on fire. My time in the PCSL has been amazing with their camaraderie and companionship.
Thanks to all the MakerWorks mentors for their help and advice on design, machining, and much more. I could always count on MakerWorks to be a great place to hang out and learn something new while procrastinating. I have received more guidance from them than I could have ever imagined. Further thanks to the people of LMP, particularly to Bill Buckley and Saana for their support over the years.
I would like to thank all of my friends who listened to my endless months of complaining and dramatizing, while responding only with endless words of encouragement and the occasional sassy comment to put me in my place. Many thanks to Chris Merian and John Mayo for
continuously reminding me to stop overcommitting myself and reminding me to sleep. I don't know what kind of impossible mess I'd be in if it weren't for them.
Next, there's Maha Haji, who has an amazing ability to make me feel sane, even in my most insane moments. She has convinced me day after day that I haven't gone crazy, and that there's always a light at the end of the tunnel. Thank you for making me believe that things will always get better. Oh and for binge-watching "Once Upon a Time" with wings and rose wine. A million thanks to Hanna Lin, Julia Hopkins, and Cynthia Lu for their endless supply of encouraging words and "YOUGOTTHIS" statements. I loved (and desperately needed) every second of our brunches, Dumpling House deliveries, and pretentious hot chocolate sessions. I would also like to thank Cyndia Cao for humoring me and pretending to "be productive" with me while actually watching Disney movies and playing League of Legends (for better or for worse). Finally, thank you to Jamison Go, for inspiring me to be a better engineer and to believe in myself. I would have never achieved as much as I have today without you, and I know you will continue to inspire me to succeed in the future.
Last and definitely not least, I would like to thank my family. Thanks to my parents for raising me, teaching me, and bearing with me through all my grumpiness, panics, and temper tantrums. My sister, Beverly, has been the best role model a little sister could ever have. I have looked up to her my whole life and owe much of my motivation for success to her incredible achievements and encouragements.
CONTENTS
Abstract... 3 Acknowledgements ... 5 Contents ... 7 Figures... 11 Tables ... 15 1 Introduction ... 171.1 Constraint Devices and Design Principles ... 20
1.2 Motivation and Application: Mouse Imaging ... 21
1.2.1 Background: Optical Imaging... 21
1.2.2 Bone Marrow Imaging... 24
1.2.3 Brain Imaging... 25
1.3 Prior Art: Holding Devices and Methods ... 26
1.3.1 Positioning Ability ... 26
1.3.2 Invasiveness ... . . ... 29
1.3.3 U ser In terface ... 30
1.4 Thesis Outline ... 31
2 Mouse Tissue Characterization ... 33
2.1 Measurement of Material Properties ... 33
2.1.1 Tissue Material Behavior ... 35
2.1.2 Material Properties from Literature ... 37
2.2 Design of Material Testing Device... 38
2.2.1 Functional Requirements...38
2.2.2.1 Linear Stage Design ... 41
2.2.2.2 Actuator Selection ... 44
2.2.2.3 Sensors and Control... 45
2.2.2.4 Functional Requirements Revisited ... 46
2.3 Experimental Setup and Procedure... 47
2.3.1 Compression Stiffness ... 48
2.3.2 Shear Stiffness ... 50
2.4 Experimental Results and Analysis ... 51
2.4.1 Compression Stiffness... 51
2.4.2 Shear Stiffness ... 53
3 Quasi-Conformal Contact System M odeling... 57
3.1 System M odeling ... 57
3.2 Conformal Contacts... 59
3.3 Finite Element Simulation of Contact M odels ... 61
3.3.1 Point Contact FEA M odeling ... 62
3.3.2 Conformal Contact FEA M odeling... 63
3.3.3 FEA Results Discussion... 65
3.4 Limitations ... 68
4 Prototype Device Design ... 69
4.1 Functional Requirements... 69
4.2 M echanical Design... 70
5.1.1 M ouse Preparation Procedure ... 78
5.1.2 Instrumentation Setup ... 79
5.2 Device Performance Testing ... 81
5.3 Results and Discussion ... 82
5.3.1 Comparison to Other Contacts ... 86
5.3.2 Comparison to Theoretical Model ... 88
5.4 Further M odeling ... 89
6 Conclusions & Future W ork ... 95
6.1 Thesis Synopsis... 95
6.2 Future W ork... 96
6.2.1 Further Theory Development and Validation... 96
6.2.2 Device Refinement... 97
6.2.3 Expanding Application for other M edical Imaging... 97
References ... 99
A Instrumentation & Electronics for M aterials Testing...103
A.1 Instrumentation Setup... 103
A.1.1 Voice Coil... 103
B Error M odel for M aterials Testing Setup ... 107
FIGURES
Figure 1.1: Prototype m ouse restraint device... 18
Figure 1.2: (a) Y- and (b) z-axis mouse movement from testing of prototype device... 19
Figure 1.3: The 3-legged stool (a) is an example of kinematic constraint, while a 5-legged rolling chair (b) is an example of elastic averaging [2],
[3].
... . 20Figure 1.4: Confocal and two-photon microscopy. ... 22
Figure 1.5: Image from a two-photon microscope (a) with and (b) without a mouse holder [141. ... 2 4 Figure 1.6: In vivo imaging of dendrites and dendritic spines. Scale bar: 10pm [12]... 26
Figure 1.7: Restraint techniques compared against setup time and performance [17]-[211. ... 27
Figure 1.8: Prototype mouse holder designed by Culpepper et al [22]. ... 28
Figure 1.9: Measured displacement of initial prototype device of an anesthetized mouse over (a) 60s, (b) 8s, (c) during transition from anesthetized to awake and (d) fully awake [22]... 29
Figure 1.10: Locations on a mouse head that must remain clear for device design (shown in red) [2 3 1. ... 3 1 Figure 2.1: C ontact joint spring m odel. ... 34
Figure 2.2: Applicable forces in a contact constraint system. ... 35
Figure 2.3: Example of a nonlinear stress-strain curve. ... 36
Figure 2.4: M aterials testing device setup... 40
Figure 2.5: Desired force-displacement inputs and output measurements for (a) compression stiffness and (b) shear stiffness. Inputs are in yellow and output measurements are in red. ... 41
Figure 2.6: Test device top view showing axes of movement... 42
Figure 2.7: Y-axis movement stage components including (1) flexure stage, (2) Renishaw linear encoder, (3) compression spring, and (4) micrometer. ... 43
Figure 2.8: X-axis movement components including (1) ABS contact probe, (2) precision shaft in air bearing and (3) linear voice coil actuator. ... 44
Figure 2.9: Shear stiffness test spring schematic and load path... 45
Figure 2.10: Therm al regulation box... 46
Figure 2.11: Overall m aterial testing setup... 47
Figure 2.12: Mouse (a) with bolt in skull and (b) mounted in test device... 48
Figure 2.13: M ouse tissue com pression test setup. ... 49
Figure 2.14: Instron setup with tissue sam ple... 50
Figure 2.15: Shear stiffness test setup with indicated movement... 51
Figure 2.16: Exam ple shear stiffness curves [28]. ... 52
Figure 2.17: Shear stiffness as a function of input displacement... 54
Figure 3.1: Spring systems for devices with (a) point and (b) quasi-conformal rear contacts. kp and kc represent effective point contact and quasi-conformal contact stiffnesses, respectively... 58
Figure 3.2: Conform al contact surfaces ... 59
Figure 3.3: Contact joint spring system showing focus of FEA simulations. ... 60
Figure 3.4: (a) Perfectly conformal contacts as compared to (b) quasi-conformal...60
Figure 3.5: Back-of-head constraint shape with labeled arcs of curvature. ... 61
Figure 3.6: SolidWorks setup for point contact FEA simulation. ... 62
Figure 3.7: SolidWorks setup for conformal contact FEA simulation...64
Figure 3.8: Force-displacement curves for point and conformal contacts from FEA. ... 65
Figure 3.9: (a) Resulting contact pressure along arc of conformal contact and (b) the definition of an gle alp h a (a). ... 67
Figure 4.1: CAD model of prototype restraint device. ... 70
Figure 5.1: (a) Back view of the holder and capacitance probe setup. (b) Final testing setup for
d ata collection ... 78
Figure 5.2: Mouse in holder with measuring target attached... 79
Figure 5.3: Capacitance probe positioning with labeled axes...80
F igure 5.4: P ressure film result. ... 80
Figure 5.5: Setup to measure applied force of rear contact...82
Figure 5.6: Close-up view of y-axis displacement with labeled heartbeats and respiratory m o v em en t...83
Figure 5.7: Z-axis displacement of (a) different quasi-conformal contact sizes at large force and (b) different forces applied for the large contact size... 85
Figure 5.8: Plot comparing multiple device configurations in the (a) y-axis and (b) z-axis...87
Figure 5.9: Rear contact geometry for point contact configuration. ... 90
Figure 5.10: Updated system spring model for point contact configuration... 91
Figure 5.11: Diagram with (a) two convex ellipsoids and (b) one concave, one convex ellipsoid. ... 9 2 Figure A.1: PCB layout for voice coil control amplifier... 104
TABLES
Table 1.1: Im aging techniques and resolutions... 23
Table 2.1: Functional requirements for material testing device. ... 39
Table 2.2: Functional requirements & expected performance. ... 46
Table 2.3: Measured compression stiffness properties. ... 53
Table 2.4: Measured and literature material property values. ... 53
T able 2.5: Final shear stiffness values... 54
Table 3.1: Point contact FEA results... 63
Table 3.2: Conform al contact FEA results... 64
Table 3.3: Point vs. conformal stiffness comparison (FEA)... 66
Table 4.1: Functional requirements for prototype device... 69
Table 4.2: Degrees of freedom of motion and corresponding constraints. ... 72
Table 5.1: Displacement measurements for conformal constraint. ... 84
Table 5.2: Displacement data for various constraint configurations. ... 88
Table 5.3: Stiffness comparison for theoretical (FEA) and experimental values... 89
Table 5.4: Inputs to Hertzian contact calculations. ... 92
Table 5.5: Stiffness comparison for theoretical (Hertzian) and experimental values... 93
CHAPTER
1
INTRODUCTION
The purpose of this work is to model and prototype quasi-conformal constraint contacts and investigate their positioning ability for compliant bodies, specifically for the holding of mice in optical imaging setups. This work includes: the design of a material property testing device for mouse tissue, material property characterization of mouse tissue in compression and shear directions, a modeling method for predicting the stiffness of quasi-conformal constraints, the design of a mouse constraint device utilizing quasi-conformal constraints, and preliminary testing of a prototype. Existing research has not characterized shear properties of mouse tissue; mouse facial muscle material properties has also not been investigated. The constraint devices and techniques currently available for mice have limitations addressed later in this thesis. The techniques and findings presented in this thesis may be used to design other constraint systems using quasi-conformal contacts and nonlinear elastic materials.
The direct application of this work is the restraint of laboratory mice for biological imaging. Currently, the quality of biological images of micron- and submicron-scale biological structures is limited by the movement of the mouse specimen, rather than the resolution of the imaging equipment. A proper restraint device that limits the movement of the imaged mice can enable the full resolution of the imaging equipment to be utilized. With proper images, these biological structures can be better examined and tracked, leading to more significant findings. No prior work has been done to investigate the performance improvement of conformal contacts on the constraint of nonlinear elastic materials. The devices previously designed for similar applications have not been designed following mechanical constraint design rules. With the
findings presented in this thesis, a design of a device can be optimized keeping both predicted
performance and user interface in innid.
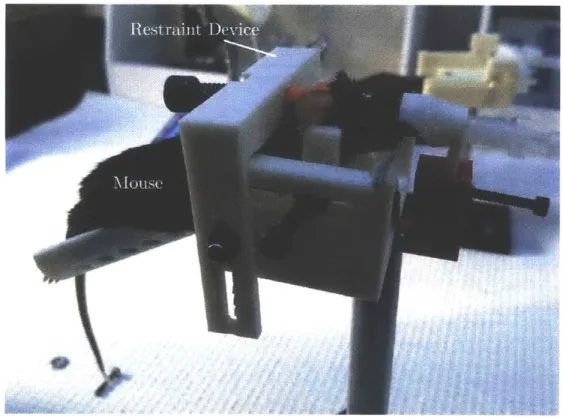
The prototype restraint device built in this thesis is shown in Figure 1.1. A mouse is placed in the device and prepared for surgery prior to the application of the rear constraint. When the mouse is ready for imaging, the rear quasi-conformal constraint is applied.
Figure 1.1: Prototype mouse restraint device.
The performance of the device is defined by the magnitude of the mouse movement in three axes. This novement was measured using capacitance probes and a conductive block fixed
N ort I3.3N 4 - Io r~ C<ntj\ (a) Short (3,3N) No - ear Contact (b)
Figure 1.2: (a) Y- and (b) z-axis mouse movement from testing of prototype device.
A
1.1 Constraint Devices and Design Principles
Many of the restraint devices that exist today for holding biological specimens were designed empirically rather than using systematic design principles. There are two design principles that are typically used in machine design: kinematic constraint and elastic averaging. Kinematic constraint uses one contact to constrain each degree of freedom of a rigid body. This allows positioning of the body to be highly repeatable and accurate, as there is no forced geometric congruence and no over constraint. One of the limitations of kinematic constraint is the high stress at each point contact and lower overall system stiffness. Elastic averaging uses a large number of contact points to spread out the support of a large load. This type of mechanism is over constrained, but over time and wear, the high and low contact stresses of the points will eventually average out by elastic deformation. An elastically averaged system typically has higher load capacity and stiffness [1]. Two everyday examples of kinematic and elastic averaging are shown in Figure 1.3. The 3-legged stool locates the stool on a surface by exactly constraining each degree of freedom. However, a swivel chair uses more than the necessary number of constraints
to distribute the pressure at each constraint location.
For the application of restraining biological bodies, the requirement for repeatability of placing the specimen in the same location relative to the holder is not necessary. The desired stiffness of the overall system is more important. Additionally, applying a high local contact pressure can be detrimental to the biological subject in the device; distributing the restraint force over a larger area decreases the local contact pressure, which can allow for higher overall restraint forces. Therefore, elastic averaging is the chosen design principle for this prototype device.
1.2 Motivation and Application: Mouse Imaging
In vivo imaging of live animals has resulted in many biomedical and clinical research
advancements. Animal biological models provide a platform to study the progression of diseases and therapeutic responses requiring manipulation that cannot be performed directly on humans. The mouse is the most widely used model for the study of human systems. Many of these studies use sub-micron imaging techniques to image tissue and organ structures in order to monitor and characterize physiological activity in animals. The genetics, housing conditions and diet of mice can easily be controlled to achieve the biological conditions required for certain tests and experiments [4]. Imaging techniques and biological structures of interest will be discussed in the sections below.
1.2.1 Background: Optical Imaging
Optical imaging is the most common method used to image tissue structures and features in mice. Two of the most commonly used imaging methods are confocal and two-photon microscopy. A diagram showing the fundamental differences in confocal and two-photon microscopy is shown in Figure 1.4.
Confocal
Pho~Ituumit iplier I )etdect Lase Beam Oject k SpC11101tiTwo-Photon
Photim iUtiplie Dctector,
laser I eamx II( rI )id Ir mat iR
'Ieal
Phm
pImen /s
Figure 1.4: Confocal and two-photon microscopy.
A confocal microscope detects either scattered light or fluorescent light from an illuminated specimen. The pinhole aperture then filters out the out-of-focus background fluorescence to
produce a clear optical image. However, large excitation volume can cause phototoxicity in cells
and compromise the integrity of the entire cell, leading to severe problems in live specimen.
Therefore, the overall excitation volume for confocal microscopy should be kept minimal, limiting
the effective penetration depth of confocal microscopy [5], 161.
Two-photon microscopy provides an advantage in imaging living cells, especially in the
Other types of imaging techniques used for in vivo imaging of specimen are Optical Coherence Tomography (OCT), Adaptive Optics Scanning Laser Ophthalmoscope, Positron Emission Tomography (PET), and Magnetic Resonance Imaging (MRI). The common imaging methods and their resolutions are shown in Table 1.1. The resolutions listed for lateral and axial directions are relative to the objective lens of the microscope.
Table 1.1: Imaging techniques and resolutions.
Imaging Technique Lateral Resolution Axial Resolution Units
Optical Coherence Tomography (OCT) [7] 3 1 1um
Multiphoton Microscopy
181
0.207 0.814 ImAdaptive Optics Scanning Laser 0.7 2 /m
Ophthalmoscope [9]
Spectral Domain OCT
[101,
[111 2.4 1 pmThe imaging performed at the MGH Center for Systems Biology is primarily confocal and two-photon microscopy. While these imaging methods have high resolution, the movement of the live imaging subject does not allow the full use of the high resolution capabilities. Anesthetized subjects simplify this problem for some studies where anesthesia does not affect the structures imaged, but the movements of heartbeats, breaths, and occasional convulsions that range from tens of microns to millimeters can still result in blurry images without proper restraint. There exists post-processing software that can mitigate the effect of mouse movement over long periods of imaging, but these methods are costly and time consuming.
A proper restraint device that can restrain the motion of a mouse during an imaging session of up to 24 hours would allow for: high resolution images micro-tissue structures, tracking of cell movement over long imaging periods, and study of physiological response to sensory input in awake animals. The prototype in this thesis was designed for anesthetized mouse imaging, but the methods developed in this thesis can be applied to designing a holder for awake animals.
While some stereotaxic devices currently exist, many studies find that they are insufficient to achieve the quality of images required, even for anesthetized mice. One study reported that the "movement caused by heartbeat, respiration and slow drifts prevented online improvement of
signal to noise ratio by frame averaging" [12]. It has also been reported that "tissue movement by
as little as a few micrometers can render three-dimensional image stacks uninterpretable" [131. A
device designed to properly constrain the movement of imice to less than 1pn would enable better
images and lead to further advancement in clinical and biomedical studies, detailed below.
1.2.2 Bone Marrow Imaging
Bone marrow is an extremely impactful biological structure of interest. Transplantation
of bone marrow is crucial to stem cell based therapy and is used to treat cancers of the blood
system. The tracking of stem cells during the homing and engraftment process allows researchers
to characterize the cell environment, promoting cell survival. Hematopoietic stem cells are usually
12-251m in size, while capillaries and red blood cells are typically 5-10pum and 6-8um, respectively.
The imaging of the bone marrow in the skull for a 24 hour imaging period is necessary to observe
the cell migration and proliferation process for this characterization. An example of stem cell
1.2.3 Brain Imaging
In vivo brain imaging is another important direction of interest in the biomedical field.
Studying a functional brain enables scientists to map neural circuits and investigate brain function related motor activity. Brain function can be monitored for changes as a result of aging and disease, allowing scientists to study the effects of diseases on brain function and aid in the development of cures [151. While some of these tests can be performed on anesthetized mice, the anesthesia suppresses some cerebral function, making it difficult for researchers to obtain certain data required to study brain cancer and strokes. There is currently research being done to investigate the use of anti-angiogenic drug therapies to repair vascular network cells destroyed by brain tumors in order to develop more efficient therapies [16]. The structures of interest in the brain are neurons and dendrites that range between
0.2um
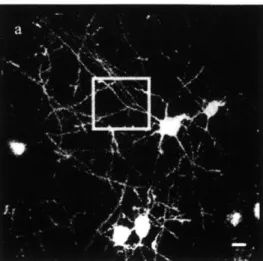
and 2um in size. A device to constrain mice, particularly awake and un-anesthetized, without pain or discomfort would allow these studies to progress further. Figure 1.6 below shows an example of brain imaging taken for anesthetized mice.-Aak-Figure 1.6: In vivo imaging of dendrites and dendritic spines. Scale bar: 1011m [121.
Reproduced with permission. All rights reserved. License
#
3865681281971.1.3 Prior Art: Holding Devices and Methods
There currently exists several devices and methods used to restrict movement of mice for various biological imaging setups and surgeries. This section introduces these restraint methods along with their limitations and discusses the motivation and necessity of a new device.
1.3.1 Positioning Ability
The positioning ability of some existing constraint methods are shown in Figure 1.7; the relative maximum resultant movements of these methods and setup times are shown. Some of these methods require surgery and permanent adhesion of parts to the skull of the mouse, while others use adjustable probes placed around the mouse's head for positioning. The limitations to
Cral oiuy
FI nt Iti-b1sd biIizer (uide Tubes
Adl( kit le screws Sh'~I 1Holdler
1-3
pm 10- IPmNaxilluini Nlovemn1eJnt
Figure 1.7: Restraint techniques compared against setup time and performance 117]-[21].
Reproduced with permission. All rights rescrvcd. License -3782610888279. 3782611041718, 386608004 0041.
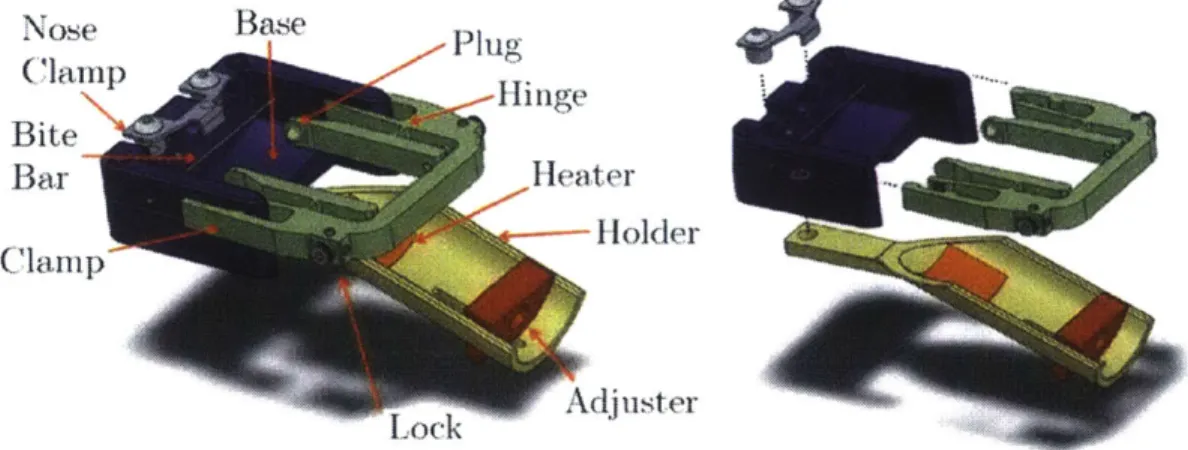
The design of most of these methods were developed through trial and error, rather than a systematic design progression. A mouse restraint device for anesthetized mice was developed by Culpepper et al [221. This device utilizes the principle of exact kinematic constraint with three contact points on the mouse's head, an( a bite bar. These points exactly constrain all six degrees of freedom of the rigid body (mouse head). The prototype is shown in Figure 1.8.
5dayvs
GAlu1ed Ifead Hlloder , I ,1-T
Nose Ba
I 1iii~xv
Bte
Bdseater
Figure 1.8: Prototype mouse holder designed by Culpepper et al [221.
The performance of this device was measured using capacitance probes, and the device was able to keep maximum skull movement to
0.1-0.2im
for heartbeats. A mouse was allowed to wake up from the anesthesia to test the performance of the device for awake mice, but the device was unable to restrain the mouse to1lpm.
The data collected from these tests are shown in Figure 1.9.Stability - Ainesthetized 1(2 3. I 10 2C; 30 it) 'M ( Tine [s] (a) Stability - Tranisit 11)1 3'AW( * (). I Timae [s4 (c)
Figure 1.9: Measured displacement of initial prototype device of an anesthetized mouse over (a) 60s, (b) 8s, (c) during transition from anesthetized to awake and
(d) fully awake 1221.
While this initial prototype was able to restrain anesthetized mice to <-1im, more design modifications would need to be made for awake mouse imaging without rigidly adhering any parts to the skull. The effectiveness of elastic averaging was explored for the development of the prototype in this thesis.
1.3.2 Invasiveness
The devices shown in Figure 1.7 have varying degrees of invasiveness. Some of the more invasive methods involve performing surgery on the mouse to attach a plate permanently to the
I j -01 31 Staility - Arthetilzed 2 1 Tirne fs] Stabilitv - Awakening 0 GO 1120 SO0 210 Time Is] (d) -20(
skull. This plate is then bolted down firmly to a rigid test setup under the microscope. This method requires time for surgery, but also several weeks of recovery time for the mouse to adjust to the attachment plate. This method is able to achieve the best performance, but has one major limitation in addition to the surgery and setup time. The rigid attachment of the plate to the skull requires adhesives, which are toxic to the cells in bone marrow; this method cannot be used for bone marrow imaging. The device proposed in this thesis aims to be minimally invasive such that no extra setup time besides placing the mouse in the holder is involved.
1.3.3 User Interface
The design for a restraint device not only needs to fulfill the functional requirements, but also needs to be easily usable for the biologists acquiring the images. If the device is not easy to use, the time spent to use the device could be spent on post-processing images, or further surgery for cranial windows instead. It is also important for biologists to have haptic feedback when they apply the contacts on the mouse, so that they can feel how hard the contacts are pushing on the mouse. All adjusting screws need to be easily graspable by an adult hand, as the use of further tools (screwdrivers, wrenches, etc.) would be an extreme hassle.
Another consideration is the space and form factor of the restraint device relative to the imaging setup. All optical setups would require direct access to the top of the head and require some clearance around the location. Therefore, any parts above the plane of imaging on the head could interfere with the objective lens or any part of the microscope. Figure 1.10 shows locations on a mouse's head that need to remain accessible to biologists and cannot have portions of the device in the way.
Figure 1.10: Locations on a mouse head that must remain clear for device design (shown in red) [23J.
1.4 Thesis Outline
Chapter 2 of this thesis presents the design of experiment and experimental results for the characterization of mouse facial tissue. Chapter 3 discusses the theoretical modeling of' the quasi-conformal contacts and how to incorporate them into a holistic model of a holder system. A detailed design process utilizing the data and calculations from Chapters 2 and 3 is discussed in Chapter 4 for a prototype holder optimized for data collection and testing. Chapter 5 details the experimental design, setup, limitations, and data acquisition process for the holder. The results of the experiment and overall performance of the holder are also discussed. This thesis concludes with a synopsis of the work, results, and a discussion of future work in Chapter 6.
CHAPTER
2
MOUSE TISSUE
CHARACTERIZATION
This chapter presents the method used to determine and characterize the compression and shear stiffnesses of mouse tissue. Section 2.1 describes the motivation and importance of the material properties to be measured. The design of the materials testing device is presented in Section 2.2, and the setup and measurement procedures are defined in Section 2.3. The results and analysis are discussed in Section 2.4.
2.1 Measurement of Material Properties
When designing a positioning device for compliant objects, the stiffness of the compliant object contributes a large factor to the compliance of the overall system. It is crucial to understand the material properties of the compliant object in question, in this case, mouse facial tissue. The tissue on top of the bone consists of a layer of skin above a layer of muscle. This contact joint can then be modeled as springs in series, as shown in Figure 2.1.
kpmb
k.
km
k.,usl
kmo
F
Figure 2.1: Contact joint spring model.
Skin, like many materials, has different properties in tension and compression. The tensile modulus of mouse skin was found to be 6MPa at 20-30% strain, while the compression modulus was only 32kPa at the same strain [24]. Based on these findings, a device that could hold the skin of the mouse in tension, rather than compression for position could allow for a stiffer device. However, pulling the skin in tension may cause discomfort, pain, and injury for the mouse. The most practical strategy is to hold the mouse with contact points that apply compression on the skin.
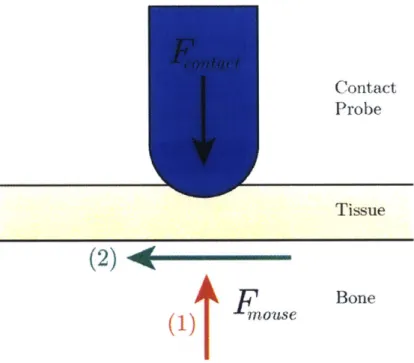
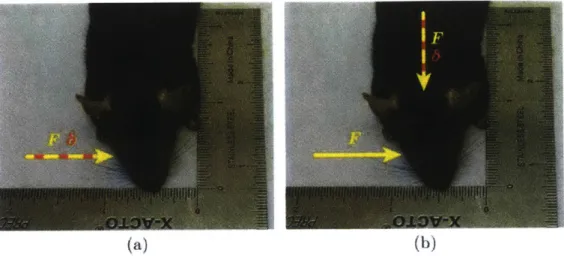
Figure 2.2 below shows a contact pushing on the skin of a mouse. The contact probe compressing the tissue would apply a force, Fcontact. The mouse being held could apply forces either axial to the contact probe-indicated by Fmouse (1)-or perpendicular to the contact probe-indicated by Fmouse (2). The stiffness of the overall contact joint is determined by the compression stiffness of the relevant materials for movements in the axial direction (relative to the contact probe) and the shear stiffness for movements in the perpendicular direction.
Contact
Probe
T issue
(2)*
FOUS1
Figure 2.2: Applicable forces in a contactIBone
constraint system.
2.1.1 Tissue Material Behavior
The tissue layer for a mouse is made of skin and mnuscle both of which are considered nonlinear viscoelastic materials, meaning their stiffnesses change as a function of strain and strain rate. The stiffnesses of the tissues at each contact probe location determine the overall performance of the device. The applied force or strain rate applied to each contact probe directly affects the performance of the device. A typical nonlinear stress-strain curve is described in Equation (2.1).
0- = q -(e - 1), (2.1)
where UT is the threshold stress and q is the modulus coefficient for the given material.
The threshold stress relationship is presented in Equation (2.2).
T = FT (2.2)
where FT is defined as the rminimum threshold force said to be significant for tissue resistance, and A is the cross-sectional area of the material in compression. A threshold force value of
0.01N
was used for measurements in both this thesis and the experiments performed by Wangct al. An example of a nonlinear stress-strain curve is shown in Figure 2.3.
is
'p
Figr 21 E 1f a te s st Ir te.
Figure 2.3: Example of a nonlinear stress-strain curve.
To find the elastic modulus. E, of a nonlinear material for a given stress or strain, the localized slope of the stress-strain curve can be found about that stress or strain.
material under constant stress is shown in Equation (2.4). This phenomenon is known as stress relaxation.
e(t) = 1 e-a, (2.4)
where
A
is the rate of relaxation, and 17 is the viscosity of the material. For this. device, the contact probe will apply either a constant force or displacement on the tissue. In the case of a constant applied force, the skin may exhibit creep, but will still approach the overall displacement for a pure elastic material. If a constant displacement is applied, the skin may experience stress relaxation, but the final displacement will still be that of the initial application and will not change. Therefore on the operating timescale of this device, viscoelastic effects may be neglected, and the tissue will be considered a nonlinear elastic material.2.1.2 Material Properties from Literature
The compression modulus and thickness of mouse skin on the hind limb was measured by Wang et al, but no measurements have been taken beyond a stress of 71kPa, and facial skin was not tested. The thickness of skin was found to be 278 + 102 pm [4]. Further experimentation to measure these values was therefore unnecessary for the proper design of a constraint device. The values measured in this thesis will then be compared with the values published in literature.
The elastic properties of muscle tissue have been characterized by several studies. A study performed by Kot et al utilized shear wave ultrasound elastography to find the elastic modulus of human muscle. The values were found to range from 8kPa to 46kPa; however the induced strain during measurement was not stated
[251.
Another study utilized ultrasound elasticity measurements to measure the properties of bovine muscle, but strains greater than 0.16 were not induced[26].
Material properties for mouse muscle also need to be known to obtain reliable stiffness values for this thesis.Both elastic properties and yield strength of mouse bone are necessary to know for the design of this device. These properties dictate the maximum applicable force from each contact,
as well as how the bone material should be treated in the spring system presented in Figure 2.1. One study used three-point bending tests to investigate the properties of an adult rat skull. The elastic modulus of the skull bone at slow loading conditions was found to be 5.917GPa with a standard deviation of
0.763GPa.
The yield stress of bone was reported to be 104-121MPa [27]. Based on these values, the maximum force that can be applied to the skull based on bone material properties and geometry is 5N.In order to model and design a device for this application, the material properties-namely compression, shear modulus, and thickness-for muscle and skin must be known. As a result, a test setup to measure the material properties of mouse facial tissue was designed and built.
2.2 Design of Material Testing Device
The material testing for this application is best performed on a mouse post-mortem. Due to the restrictions of CAC protocols, it would not be practical to place the mouse in a Universal Testing Machine, such as Instron. A custom test device capable of measuring to the required accuracy and resolution was designed, built, and used. This device was designed and tested in conjunction with Rachel Dias Carlson [28].
2.2.1 Functional Requirements
In order to get a good measurement of the stiffnesses required-compression and shear-the measurement device required a high degree of accuracy and resolution for both input control and output measurements. The functional requirements for this device are outline below in Table 2.1.
Table 2.1: Functional requirements for material testing device.
Property Required Value Desired Value Units
Maximum Axial Force 5 5 N
Shear Direction Travel 10 20 mm
Force Control Accuracy t 0.05 0.01 N
Dimensional Stability <1 <1 pm
Displacement Resolution <100 10 nm
Constant Strain Rate 0.5 0.1 mm/s
The maximum axial force is the maximum compression force that the chosen actuator would need to apply into the mouse skull. A calculation of the yield strength and measurement of bone thickness of the skull determined a maximum force that is to be applied by the contact probe. Shear direction travel describes the required travel of the linear stage in the direction perpendicular to the applied compression load. This linear stage is required to test the shear properties of the skin under compression. The force control accuracy describes the maximum allowable error for the magnitude of the input force. The dimensional stability refers to the position of the machine components relative to each other for the duration of the test (about one minute).
Displacement resolution is the smallest measurable increment that could be measured in each axis
of interest (x- and y-axes). The strain rate applied to the tissue must be constant, so that the viscoelastic effect of the skin does not affect the measurements during the experiment.
2.2.2 Mechanical Design
A single device was designed to do measurements for both compression and shear force-displacement measurements. The completed device is shown below in Figure 2.4.
Voi(c' Coil
~K
>~~
Linear Ei.wcdenisSprng
Alicruimeter
Figure 2.4: Materials testing device setup.
In order to measure the compression modulus on facial tissue of the mouse, an accurate displacement measurement would need to be measured as an incrementally increasing force is applied. For the shear modulus, the actuator would need to apply a constant force as a second perpendicular force is applied. The resultant displacement in the y-direction would need to be measured. Given these constraints, it was necessary to have a force-controlled actuator in the x-and y-axes x-and accurate, high-resolution displacement measurements in each axis. It is important to note that while the x-direction force actuation must be continuous and actively controlled, the y-direction force application need only be incremental. Figure 2.5 below shows a Mouse head with
(a)
(b)
Figure 2.5: Desired force-displacement inputs and output measurements for (a) compression stiffness and (b) shear stiffness. Inputs are in yellow and output
measurements are in red.
2.2.2.1
Linear Stage Design
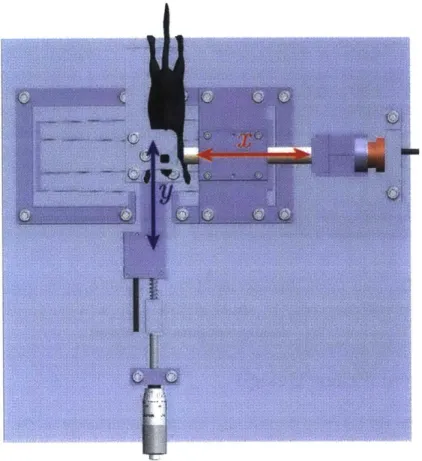
In order to get accurate force-displacement measurements at the required resolution, all unknown quantities, such as friction, must be eliminated. The compression test only requires movement in one axis, while the shear test requires two. This test setup was thus designed with two frictionless axes of movement, shown in Figure 2.6.
C., ea,! -- ii s mmm
Ii'
Figure 2.6: Test device top view showing axes of movement.
The mouse is mounted on the center of a symmetrical, single degree-of-freedom, four-bar flexure stage oriented such that the movement of the flexure stage is in the direction. The y-axis movement stage components are highlighted in Figure 2.7. A flexure stage was chosen because the force-displacement characteristics of the stage were both repeatable and easily characterized on an Instron. A flexure stage also provides a manufacturable and inexpensive frictionless solution
Figure 2.7: Y-axis movement stage components including (1) flexure stage, (2) Renishaw linear encoder, (3) compression spring, and (4) micrometer.
The flexure was optimized according to the functional requirements for force and travel in the x- and y-directions. A safety factor of 2 was applied for yield at a displacement of 3mm on either side of the initial position. The geometry of the flexures were designed such that the stiffness in the undesired directions-x and z--were greater than 5 x 10⁶N/m. The flexure stage was then characterized using an Instron to account for manufacturing tolerances and errors and confirm the modeling.
The x-axis movement stage was also designed to be frictionless. The 3D printed ABS part contacting the mouse was attached to the end of a precision steel shaft supported by a New Way 0.5" ID air bushing (S301201). The air bearing selected has a radial stiffness of 1N, pTm, which is more than sufficient for the radial loads that it would be experiencing
1291.
Two Renishaw Linear Encoders (T1001-10A with Ti2000A1OA interfaces) were attached to the moving portions of the assembly: one to measure the x-axis displacement of the precision shaft, and one to measure the y-axis displacement of the flexure stage [30].Figure 2.8: X-axis movement components including (1) ABS contact probe, (2) precision shaft in air bearing and (3) linear voice coil actuator.
2.2.2.2
Actuator Selection
The test device has force inputs for both the x- and y-axes, but only the x-direction input force needs to be continuous. Therefore, for simplicity, only the x-axis was chosen to be electrically powered and controlled. Ultimately, a 5N Moticont linear voice coil actuator (LVCM-025-029-01) controlled by a LabVIEW program was selected to apply the input force in the x-direction
[31].
A linear voice coil was chosen for this application because it provided a simple force-control option through current control and was able to achieve the linear travel and applied force required. The force and corresponding displacements from the Renishaw encoder were then used to determine a compression stiffness of the facial tissue.
k.
Figure 2.9: Shear stiffness test spring schematic and load path.
When an input displacement Sapplied is applied, the displacement y is measured by a linear encoder. The spring constants of the compression spring (6.90 N/mm) and flexure (3.16 N/mm) were measured individually using an Instron machine. Given these stiffnesses, the shear stiffness of the skin can be calculated and a modulus determined using Equation (2.6) below.
F = kspring(6 - y) - (kp exure + ksirear)y =
0
(2.5)
kshear -kspring (6 - y) - kflexurey (2.6)
y
2.2.2.3
Sensors and Control
The linear encoders and voice coil were all controlled using a National Instruments DAQ system and a myR.IO, respectively. Two LabVIEW programs were written: one to record the linear encoder data and one for force control of the voice coil. The linear encoders have an accuracy of 30nm and resolution of l0nm, and the voice coil can control force within 0.02N. The electronics schematic and current control schematic are described in detail in Appendix A.
2.2.2.4
Functional Requirements Revisited
The functional requirements for this device are revisited and compared to the values the device has been designed to reach in Table 2.2 below. The error budget and other details for determining the designed metrics are presented in Appendix B.
Table 2.2: Functional requirements & expected performance. Property Required Value Designed Value Units
Force Control Accuracy 0.05 + 0.02 N
Dimensional Stability <1.0 2.6 pm
Displacement Resolution 100 30 mm
Constant Strain Rate 0.5 + 0.1 mms
The dimensional stability required value was not imet in the design of this device due to thermal expansion. The temperature of the testing environment was unpredictable. Ultimately, a thermal regulation box made from temperat tire insulating foam, 80-20, and polycarbonate was constructed and placed around the setup to minimize
immediate
temperature changes of the setup and minimize expansion for the duration of the test. The thermal regulation box is shown in Figure 2.10.2.3 Experimental Setup and Procedure
The material testing experiments were performed in the MGH Center for Systems Biology with post-mortem type CX3CRI-GFP mice. All testing was performed in accordance with CAC protocols. The masses of the mice tested ranged from 24.1-35g, and ages ranged from 10-14 months. The overall test setup with a fully mounted mouse is shown in Figure 2.11.
Figure 2.11: Overall material testing setup.
The mouse preparation involved removing the skin and hair on the top of the head to expose the bone of the skull. The skull was then fixed to an aluminum head-plate using dental cement. The head-plate was then bolted to standoffs on the center stage of the flexure.
47
I1
-SOL--L6
Figure 2.12: Mouse (a) with bolt in skull and (b) mounted in test device.
After the first trials, it became apparent that the adhesion between the dental cement and the bone was not strong enough to fix the mouse's head. In addition to the adhesive, a bolt screwed into the mouse's head was needed to fix the head relative to the plate for the shear stiffness testing, shown in Figure 2.12. In the testing for the compression stiffness, the 3D printed contact was creating a moment about the attachment point and the head was pivoting about that point. Instead, a separate test where a portion of skin from the imouse's face was removed and placed on an aluminum block rigidly attached to the setup was performed.
2.3.1 Compression Stiffness
According to literature, skin is known to be a nonlinear elastic material. To determine a compression stiffness curve, the displacement is measured as a function of the input force applied by the voice coil. The procedure is outlined below.
Figure 2.13: Mouse tissue compression test setup.
In addition to the data collected from the test device, further samples were tested on an Instron machine. The setup is shown in Figure 2.14. The tissue samples tested were 6mm diameter round samples, and a strain rate of 1 mm/min was applied. As before, the threshold initial force
Figure 2.14: Instron setup with tissue sample.
2.3.2 Shear Stiffness
The shear stiffness was measured on the mouse head as a whole. After the mouse is bolted and fixtured onto the test setup, a constant force of
5N
was applied by the voice coil into the cheek to compress the tissue, as a point-contact constraint would. The experimental procedure is outlined below.1. Place mouse on flexure stage at the correct height, such that the voice coil probe is between the eye and ear of the
nouse.
2. Apply constant
5N
force with voice coil (FI) and start recording data from y-axis linear --- - - - -- - -- -- - - - - - - M- 7-==;:- -4 - MFigure 2.15: Shear stiffness test setup with indicated movement.
2.4 Experimental Results and Analysis
The results from the compression stiffness tests are discussed and compared to similar tests in literature in Section 2.4.1. The results from the shear stiffness tests are similarly discussed in Section 2.4.2.
2.4.1 Compression Stiffness
The force-displacement data was collected for 12 tissue samples from a variety of possible holder-contact locations on the mouse. Each curve was fit using Equation (2.7), where FT =
0.01 N is the minimum threshold force, and d is the measured displacement of the tissue. Equation
F = FT(e pd - 1) (2.7)
The stiffness coefficient p and the modulus coefficient p can be related by the tissue thickness to, by the relationship shown iii Equation (2.8).
q
to (2.8)
Figure 2.16 below shows four samples plotted and a fitted curve with p good agreement between the collected data and the selected fitted curve.
35. There is '20--e 18 16 12 10 S 6 4 ----* +O Sampe -Flt: p =35'1) Szimiple 2 Sample 3 - SiampiAt 4
4
The material properties and calculated p and q values are shown in Table 2.3 below.
Table 2.3: Measured compression stiffness properties.
Parameter Skin Muscle Units
Tissue Thickness 0.455 0.063 1.030 0.380 mm
q Value 11.49 0.14 7.85 2.50
---p Value 25.50 3.54 7.70 0.42
---The calculated modulus and thickness values from the tests performed agree with values found in literature. While there are not published data for all the tissue types measured in the test, the values measured fall within the range that was found in literature for human and bovine skin and muscle. Both the measured and literature values are presented in Table 2.4 below.
Table 2.4: Measured and literature material property values. Type of Tissue q Value Range Thickness Range [mm] Source
Mouse Skin (Cheek) 11.49 0.14 0.455 0.063 Measured
Mouse Muscle (Cheek) 7.85 t 2.50 1.030 0.380 Measured Mouse Skin (Hind Limb) 10.77 2.03 0.278 0.102 [201
Rabbit Muscle (Soleus) 4.6 - 7.4
[231
The stress-strain curve for the skin will be used as a material property in the FEA presented in Chapter 3.
2.4.2 Shear Stiffness
The shear stiffness of the tissue was calculated using Equation (2.6). This value includes the static friction between the ABS contact and the mouse skin, which is difficult to measure or quantify. The purpose of this test is to determine whether the stiffness of the contact-including both shear stiffness of the skin and the static friction involved-is significant relative to the compressive stiffness for each contact point. Therefore, a measurement of the combined quantity for the shear stiffness is sufficient.
U 0,4054 0.) Wi ) 0)2A 0125 08 f )27
01
Figure 2.17: Shear stiffness as a function of input displacement.
Figure 2.17 shows the shear stiffness as a function of input displacement. As the skin is pulled taut, the stiffness increases in that direction, as expected. As seen from the error bars, the measured values vary greatly; this is likely the result of "stickislip," where the static friction force in some trials is overcome by the applied shear force, and the skin slips against the contact, but not in others. The final values measured and calculated are summarized below in Table 2.5.
Table 2.5: Final shear stiffness values
For the first 10um of applied shear displacement under a 5N contact force, the average shear stiffness was 4.27N/mm. This stiffness is two orders of magnitude less than the compression stiffness of the skin at the same displacement (141.ON/mm). Therefore, the shear
stiffness-including frictional force-can be neglected, and each device contact only applies constraint normal to the contact surface.
CHAPTER
3
QUASI-CONFORMAL CONTACT
SYSTEM MODELING
This chapter develops the method for modeling quasi-conformal contacts in systems with compliant materials. The assumptions and equations necessary for implementing this approach are presented. The holder device is modeled as a system of springs, and each contact is modeled as an individual spring to determine an effective stiffness. The stiffnesses are then combined to determine the overall stiffness of the system.The overall system model is presented in Section 3.1. An overview of conformal contacts and motivation for the application is discussed in Section 3.2. In Section 3.3, the methods used for nonlinear Finite Element Analysis of point and conformal contacts are presented. Finally, the model limitations are explained in Section 3.4.
3.1 System Modeling
The holding method used in this thesis can be modeled as a system of springs, where each point of contact between the holder and the mouse is an individual spring with a stiffness. A schematic of the spring system for the proposed concepts are shown in Figure 3.1 below. The two concepts below are identical other than the rear contact at the back of the mouse's head. The rear contact in the first configuration (Figure 3.1a) is effectively two point contacts, whereas the rear contact in the second configuration (Figure 3.1b) is a quasi-conformal contact approximately
-mu- - - U
-matching the radii of curvature of the
nouse's
head. Each spring in the figure only has stiffness along the direction of the spring.k
1
k
N ouse M ouse
Head Head
(a) (b)
Figure 3.1: Spring systems for devices with (a) point and (b) quasi-conformal rear contacts. kP and ke represent effective point contact and quasi-conformal contact
stiffnesses, respectively.
The conformal nature of the rear contact in configuration (b) allows the contact to apply a constraint in both the x and y directions. All springs in Figure 3.1 can also constrain in the z-axis due to the placement on the mouse head. The first configuration is the setup used in Rachel
U
3.2 Conformal Contacts
Two surfaces are considered to be conformal if all points on the surface, as well as
orientation angles match (see Figure 3.2). Conformal contacts are composed of two surfaces
considered to be conformal relative to each other in one orientation.
A
Figure 3.2: Conformal contact surfaces.
In constraint design, conformal contacts are considered to be in the realm of elastic
averaging, as opposed to exact constraint due to the large surface area of constraint. As a result,
conformal contacts can be designed to be significantly stiffer than a point contact, as the contact
is effectively a system of springs in parallel; they can also be designed to be more robust for larger
applied forces. In this particular application, a conformal contact would also allow for a greater
overall contact force, as the force is distributed over a larger area. The maximum local force that
skin and bone can withstand is limited, not only by material properties and yield, but also pain
and injury to the animal. The trade-off for conformal contacts is the lower repeatability and
possible difficulty in manufacturing a closely conformal contact.
The contact pushing on the mouse head can be modeled as many springs in series, as
The combined stiffness of the contact, skin, and muscle, however, can be modeled in FEA and also verified through experimental measurements.
Figure 3.3: Contact joint spring system showing focus of FEA simulations.
A perfectly conformal surface is ideal, but unrealistic in real-world applications. Manufacturing errors and biological differences make perfectly conformal contacts impractical for this application. The compliance of the mouse skin