HAL Id: hal-00071060
https://hal-insu.archives-ouvertes.fr/hal-00071060
Submitted on 31 May 2006
HAL is a multi-disciplinary open access
archive for the deposit and dissemination of
sci-entific research documents, whether they are
pub-lished or not. The documents may come from
teaching and research institutions in France or
abroad, or from public or private research centers.
L’archive ouverte pluridisciplinaire HAL, est
destinée au dépôt et à la diffusion de documents
scientifiques de niveau recherche, publiés ou non,
émanant des établissements d’enseignement et de
recherche français ou étrangers, des laboratoires
publics ou privés.
A new modeling of the X-ray diffraction by disordered
lamellar structures, such as phyllosilicates.
Alain Plançon
To cite this version:
Alain Plançon. A new modeling of the X-ray diffraction by disordered lamellar structures, such as
phyllosilicates.. American Mineralogist, Mineralogical Society of America, 2002, 87, pp.(11-12) 1672
1677. �hal-00071060�
0003-004X/02/1112–1672$05.00 1672 INTRODUCTION
In comparison with the usual determination of crystal struc-tures, where the problems include determination of the space group and determination of the positions and nature of the at-oms in the unit cell, the structural determination of lamellar materials is rather different because the nature and structure of the layers involved are roughly known, and the problem is mainly the determination of the stacking parameters of these layers. For example, phyllosilicates consist of stacked layers that are either 1:1 layers (layers composed of a tetrahedral sheet where Si is the cation, associated with an octahedral sheet con-taining Al or Mg cations), or 2:1 layers (where the octahedral sheet is sandwiched between two tetrahedral sheets). In the lat-ter, octahedral or tetrahedral substitutions in the sheets result in positive charge deficits compensated either by interlayer cations or by octahedral hydroxide sheets with a positive charge. An important feature of these two families of layers is that their unit-cell parameters are very close, allowing phyllosilicate crys-tals to form with layers of these two families. Phyllosilicates are then commonly mixed-layer minerals. Another character-istic is that the different types of layers of these crystals be-have differently when they are submitted to heating or intercalation treatments. By combining the information deduced from the evolution of the X-ray diffraction (XRD) patterns af-ter a 450–550∞C heating treatment (waaf-ter molecules are, if present, removed from the interlayer spaces), with that obtained from the corresponding evolution after a glycerol or an ethyl-ene glycol treatment (these molecules replace water in the interlayer spaces where water is present, and lead to a specific
d-spacing), it is possible to predict the nature of the layers that build the crystals and the problem is mainly the determination
of the way these layers are stacked (Brown and Brindley 1980; Moore and Reynolds 1989).
The primary method for the determination of the stacking parameters of lamellar structures is the modeling of their pow-der XRD patterns (powpow-der diffraction because lamellar par-ticles are usually fine grained). If the goal is to determine the succession of the layers along the normal to the layers, the XRD patterns must be obtained from samples in which particles are as parallel as possible in order to remove, in a reflection geom-etry, the hkl reflections (with h and/or k π 0). If the goal is additionally to determine the stacking defects in the plane of the layers, the XRD patterns must also be recorded for samples in which particles are as unoriented as possible. A transmis-sion geometry then allows a better control of the experimental parameters (Drits and Tchoubar 1990).
Several mathematical formalisms have been proposed for modeling the powder XRD patterns of oriented samples of minerals containing one or more kinds of layers (Kakinoki and Komura 1952, 1965; Reynolds 1967; Drits and Sakharov 1976). Different types of software have been designed, based on these formalisms. Among them, the most widespread is NEWMOD (Reynolds 1985). The software of Drits and Sakharov (1976) has been widely used by those authors but is not generally avail-able. More recently, Plançon and Drits (2000) have built a pack-age for the calculation of 00l reflections of two- (MLM2C) and three-component systems (MLM3C). Plançon (1976, 1981) also developed a mathematical formalism for the modeling of the XRD patterns of unoriented samples. The corresponding software, CALCIPOW (Plançon 1976), has been used for dif-ferent structural characterizations, e.g., of kaolinites (Plançon and Tchoubar 1977), heat-treated 2:1 phyllosilicates (Muller et al. 2000), nacrites (Ben Haj Amara et al. 2000), and birnessites (Lanson et al. 2002).
A common assumption of all these formalisms is that the * E-mail: [email protected]
New modeling of X-ray diffraction by disordered lamellar structures, such as
phyllosilicates
A
LAINP
LANÇON*
Institut des Sciences de la Terre d’Orléans, 1a rue de la Férollerie, 45100 Orléans, France
ABSTRACT
The “classical” modeling of powder X-ray diffraction (XRD) patterns of lamellar structures, such as phyllosilicates, assumes that the samples are composed of “crystals” having various thick-ness and well-defined translations between layers. This model is able to describe the high-angle domain of XRD patterns but sometimes fails in the low-angle region. The new model proposed here considers the samples to be composed of “particles” that have larger sizes than crystals and contain defects such as cracks, inner-porosity, bent layers, edge dislocations, etc. These defects induce varia-tions in the d-spacings, introduced in the calculation by distribuvaria-tions of the d-spacings. For phyllosilicates, this model is consistent not only with XRD, but also with small-angle X-ray scatter-ing (SAXS) data, transmission electron microscopy (TEM) results, and high-resolution transmission electron microscopy (HRTEM) observations.
PLANÇON: NEW MODELING OF XRD BY LAMELLAR STRUCTURES 1673
samples are composed of “crystals” in which the layers are perfectly parallel, and the translations between layers are well defined. All of these crystals do not have the same number of layers and the calculation must take into account a distribution of crystal thicknesses, for example a log-normal one (Drits et al. 1997a).
COMPARISONOFSTRUCTURALCHARACTERIZATIONS BYXRDMODELINGANDBYOTHERTECHNIQUES
The modeling of the XRD patterns of clay minerals gener-ally suggests the presence of crystalites averaging 10 layers (Moore and Reynolds 1989; Drits et al 1997a) with in-plane dimensions of a few tens of nanometers (Plançon and Tchoubar 1977; Ben Haj Amara et al. 2000). Other techniques have also been used to obtain information on the way the layers are stacked, including small-angle X-ray scattering (SAXS), mission electron microscopy (TEM), and high-resolution trans-mission electron microscopy (HRTEM). These three techniques clarify what is determined by XRD.
When kaolinite samples are studied by XRD and TEM, it appears that the in-plane “mean” size of the particles seen by TEM is much greater than the few tens of nanometers deter-mined by modeling of the XRD patterns. The difference can reach one order of magnitude. When the same samples are ad-ditionally studied by HRTEM, it appears (Plançon and Tchoubar 1977) that even for “well-crystallized” kaolinites, a particle is not a perfect stack of parallel layers but contains edge disloca-tions or cracks, and particles can be slightly bent (even when they are thick). Comparison of the XRD data with TEM and HRTEM results leads to the conclusion that the “crystals” seen by XRD are in fact “coherent scattering domains” (CSD), which are only parts of larger entities, the “particles” seen by TEM and HRTEM.
A sample of Rupsroth beideillite (A) was studied simulta-neously by XRD (Besson 1980) and SAXS (Pons 1980). Us-ing XRD methods Besson (1980) determined a mean thickness of 15 layers but Pons (1980) found a mean thickness of 400 layers by SAXS. The CSDs seen by these two techniques are thus very different.
In a study of kaolinites (Plançon and Tchoubar 1977), the size of the in-plane CSD determined by modeling the hkl re-flections was always noticeably smaller for the 20,13 reflec-tions than for the 02,11 ones. For example, for a “well-crystallized” Georgia kaolin (like KGa-1), the diameter of the CSD is 150 nm for the 02,11 band but only 50 nm for the 20,13 one.
These three observations can have the same explanation, namely that the samples are composed of particles that are not stackings of perfectly parallel layers but contain, as observed by HRTEM, cracks, bubbles, bent layers, edge dislocations, and perhaps other defects. From a diffraction point of view, the amplitude diffracted by a particle is the summation of the indi-vidual contributions of unit cells, through phase terms exp(2 p i s.r), where s is the diffraction vector and r determines the position of the unit-cell origin. For perfect stacking there is a perfect periodicity of r, and there are directions in space for which all the phase terms are the same. If we consider that some disorder exists in the periodicity, r becomes r + Dr and the phase term becomes exp(2 p i s.r) * exp(2 p i s. Dr), where
the second element of the product introduces a smearing. If s is small, exp(2 p i s. Dr) differs only slightly from 1, even for a non-negligible Dr. Thus SAXS, using a small s, sees the par-ticles almost as if they did not contain any defects. For one Dr value, exp(2 p i s. Dr) departs increasingly from 1 as the dif-fraction vector s increases. The smearing effect then increases with s, and consequently the apparent CSDs decrease. XRD sees these CSDs, which are only parts of the particles.
An interesting approach was proposed recently by Ben Rhaiem (1999). Theoretical SAXS intensities were calculated for smectite particles containing only one type of layer but three
d-spacings (13.5, 17, and 20.5 Å), corresponding to three glycolation states of the interlayer spaces, with a dominant pro-portion of the mean distance (respective propro-portions: 0.1, 0.8, and 0.1 for the above d-spacings). It was assumed that the non-mean d-spacings break the coherence of the diffracted beams in XRD. In this case, large particles (80 layers) would produce XRD patterns like a set of crystals in which all the layers would have the same 17 Å d-spacing. Such a set was determined ran-domly, keeping the above proportion of the three interlayer spaces. Then, a calculation of the corresponding XRD pattern was made with a simplified distribution of crystal thickness. This pattern fits rather well with the SAXS pattern in the low-angle region.
So, it may be supposed that the classical description of XRD by phyllosilicates, which assumes the existence of crystals con-taining parallel layers with definite d-spacings and a thickness distribution of these crystals, is an approximation of the real diffraction phenomenon, which involves particles that are larger than these crystals and contain only roughly parallel layers with a distribution of distances between these layers. The discrep-ancy between the two models is expected to increase with the decrease of the modulus of the diffraction vector. In the most accurate works done recently (e.g., by Drits et al. 1997b; Sakharov et al. 1999), such discrepancies are observed between some calculated and experimental XRD curves in the low-angle region, explained until now, by the uncertainty in experimen-tal conditions that could modify the exact Lorentz-polarization factor.
The model proposed here for the description of the diffrac-tion by phyllosilicates considers the particles as a whole, in-cluding the defects that disturb the regularity of the stacking of the layers. To be valid, this model must lead to the same inten-sity distribution in the high-angle region of XRD as the “clas-sical” model, but it leads to a different intensity distribution in the smallest angle region, the discrepancies increasing with the decrease in the diffraction vector.
CALCULATIONOF 00l INTENSITIESINTHENEW MODEL
It has been proposed, mainly by Kakinoki and Komura (1952) and Drits and Sakharov (1976), to model the 00l reflec-tions of XRD patterns by a matrix formalism. This procedure was extended later by Plançon and Tchoubar (1977) and Plançon (1981) to the modeling of the hkl intensities with h and/or k π 0. A review of this problem can be found in Drits and Tchoubar (1990). These calculations make use of matrix products involv-ing three matrices whose rank, for layer stackinvolv-ings with a
reichweite R = 0 or 1 (Jagodzinski 1949), is the number of different types of layers. The first matrix contains only the struc-ture factors of the layers (which depend on the Z component of the diffraction vector along the normal to the layer planes), the second contains only the proportion of each type of layer (it does not depend on Z), and the third one, called Q (Z) in the following, contains the probabilities of the adjacent-layer suc-cessions and the corresponding phase terms which depend only on the translations between layers. The Qij(Z) term in the Q
matrix describes the following of an i-type layer by an adja-cent j-type one.
Q
ij(Z)
=
p
ijexp 2p
(
iZd
i)
,where pij is the probability of the ij succession and di is the
thickness of the i-type layer.
p j r ij= =
Â
1 1(r being the rank of the matrices) means that the probability for an i-type layer to be followed by any type of layer is 1.
For example, for a two-component system where layers are named A and B, the Q(Z) matrix is
Q
p
d
p
d
p
d
p
d
(Z)
iZ
iZ
iZ
iZ
AA A AB A BA B BB B=
(
)
(
)
(
)
(
)
Ê
ËÁ
ˆ
¯˜
exp
exp
exp
exp
2
2
2
2
p
p
p
p
In the new model, in contrast to the classical one, the layers are the same, their proportions are the same, and then only this
Q(Z) matrix must be modified. Between an i-type and a j-type layer, there are now not only one but nij translations. The Qij(Z)
term becomes:
Q p d p d
p d p d
ij ij ij ij ij
ijq ijq ijn ijn
(Z) iZ iZ iZ iZ =
(
)
+(
)
+ +(
)
+ +(
)
1 2 1 2 2 2 2 2 exp exp ... exp ... exp p p p p , i.e., Qij (Z) =p
d
q n ijqiZ
ijq ijexp
2
.
1p
(
)
=Â
, where pijq is theprobability of the q-ieth translation, dijq , among the nij ones.
(
p
p
q n ijq ij ij=
=Â
1 )Calling di the smallest of the nij translations (di is the
thick-ness of the i-type layer), the dijq translation can be analyzed as
dijq = di + Dijq with Dijq ≥ 0.
Each Dijq > 0 corresponds to an “abnormal” distance
be-tween an i- and a j-type layer. By introducing pDijq , the
prob-ability of the Dijq translation among all the deviations of the
translations between an i- and a j-type layer, pijq = pij * pDijq,
with
pD
ijq q=1nij
Â
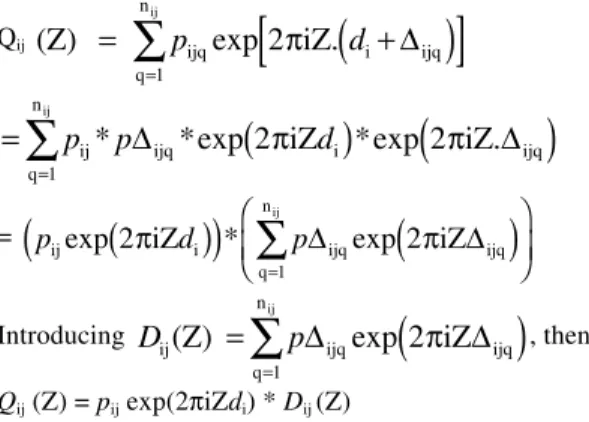
= 1.The Qij(Z) term can be rewritten:
Qij
(Z)
ijqiZ
i ijq q nij=
[
(
+
)
]
=Â
p
exp
2
.
d
1p
D
=
(
)
(
)
=Â
p
ijp
ijqd
i ijq q niZ
iZ
ij*
D
*exp
2
*exp
2
.
D
1p
p
=p
ijd
ip
ijq ijq q niZ
iZ
ijexp
2
*
exp
2
1p
p
(
)
(
)
Ê
ËÁ
(
)
ˆ
¯˜
=Â
D
D
Introducing
D
ijp
ijq ijqq n
(Z) iZ
ij=
(
)
=Â
D
exp 2
D
1p
, then Qij (Z) = pij exp(2piZdi) * Dij (Z)Then the Qij (Z) terms of the new model are those of the
classical one multiplied by a “corrective” term, Dij(Z), which
characterizes the deviations of the real layer distances from the ideal ones.
For particles without such deviations, there is only one trans-lation between layers, nij = 1, dij1 = di, Dijl = 0 and pij1 = 1. Then
Dij (Z) =1 , that is for Qij(Z) the formalism of the classical model.
If there is not a discrete distribution of Dijq but a continuous
distribution, Dij(z), with 0 £ z £ Dzmax, the Dij (Z) term becomes:
D Z
ijp
ijz
ijz
z ziZ
dz
( )
( )exp
( )
max=
(
)
=Ú
D
D
D2
0p
.The distribution of “abnormal” distances between layers generally depends on the nature of the i- and j-type layers. For example, in a mixed-layer kaolinite-smectite (K-S), it can be assumed that the swelling behavior of smectite layers induces a set of distances for S-S interlayers, another set for K-S interlayers, another one for S-K interlayers, and still another one for K-K interlayers (which have no swelling behavior). On the contrary, if all interlayer spaces can be considered as iden-tical, the Dij(Z) disorder term becomes independent of i and j
and can be extracted from the matrix as a multiplicative term. To come back to the two-component system described above, the Q(Z) matrix becomes:
Q p d D Z p d D Z p d D Z p d D Z ( ) exp ( ) exp ( ) exp ( ) exp ( ) Z iZ iZ iZ iZ AA A AA AB A AB BA B BA BB B BB =
(
(
)
)
(
(
)
)
(
)
(
)
(
(
)
)
Ê Ë Á 22pp 22pp ˆ¯˜for particles containing abnormal distances.
Figures 1 to 4 represent the diffracted intensities calculated for illite-smectite (I-S) minerals with a 0.5 proportion of each type of layer. The atomic coordinates are those proposed by Moore and Reynolds (1989). Smectite interlayers are glycolated. The instrumental variables are also those used by Moore and Reynolds (1989) for their illustrations (i.e., 6.6∞ and 2∞ for Soller slits 1 and 2, 1∞ for divergence slit, goniom-eter radius = 0.20 m, CuKa radiation) as well as the sample variables (e.g., s* = 12∞ for the standard deviation of a Gaussian distribution for the orientation of the particles).
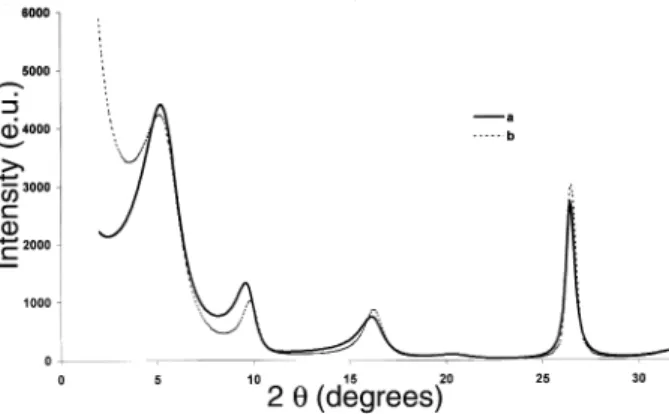
Figure 1 corresponds to the randomly interstratified min-eral (reichweite R=0). The a curve was calculated with the new model, with an arbitrary number of 50 layers in each particle, an arbitrary distribution of additional distances between each type of layers of 1, 2, 3, and 4Å, with respective probabilities of 0.05 for each of them. The b curve corresponds to the classi-cal model with a uniform distribution of the crystal thickness
PLANÇON: NEW MODELING OF XRD BY LAMELLAR STRUCTURES 1675
between 2 and 13 layers. The two models lead to similar distri-butions of intensities in the high-angle domain, but differences exist in the low-angle region that increase when approaching 0∞ 2q.
Figure 2 illustrates the sensitivity of the new model to the probabilities and values of the additional distances. Calcula-tions have been done for the randomly interstratified mineral. The a curve corresponds to the previous set of additional dis-tances 1, 2, 3, and 4 Å, with the same 0.05 probabilities for each of them. The b curve corresponds to a set of additional distances 2, 4, 6, and 8 Å, with 0.05 probabilities for each of them. The c curve corresponds to a set of additional distances 1, 2, 3, and 4 Å, with the respective probabilities 0.075. With such a set of parameters, the effect on the intensities of an in-crease of the values of the additional distances is stronger in the low-angle region than in the high-angle one. An increase in the probabilities of the additional distances has an opposite effect.
Figure 3 illustrates the calculation for the same models and
parameters as Figure 1, but for the regularly ordered I-S min-eral (R = 1 and pII = 0). The two models lead approximately to
the same distribution of intensities in the high-angle region, but to significantly different intensities in the low-angle re-gion.
Additional modification of 00l intensities for particles containing disorder of the “first type”
Another type of disorder can be considered in the particles, in addition to the above types, namely those described by Guinier (1964) as disorder of the first- or the second-type, de-tailed in Drits and Tchoubar (1990). Even for monomineralic samples, the origins of the unit cells may not follow a strict periodicity because of small variations in the unit-cell param-eters. Whether deviations from strict periodicity accumulate (second-type disorder) or not (first-type disorder), their effect on the diffraction patterns will be different. If there is no corre-lation between changes in unit-cell parameters and changes of the structure factors, the disorder of the first type plays the
FIGURE 1. Comparison of the calculated XRD intensities for a
50-50 mixed-layer illite-smectite mineral, R = 0, using (a) the new model with additional distances between layers of 1, 2, 3, and 4 Å with respective probabilities 0.05, (b) the classical model with a uniform distribution of crystal thickness from 2 to 13 layers.
FIGURE 2. Comparison of the calculated XRD intensities for a
50-50 mixed-layer illite-smectite mineral, R = 0, using the new model with (a) additional distances between layers of 1, 2, 3, and 4 Å with respective probabilities 0.05; (b) additional distances between layers of 2, 4, 6, and 8 Å with respective probabilities 0.05; and (c) additional distances between layers of 1, 2, 3, and 4 Å with respective probabilities 0.075.
FIGURE 3. Comparison of the calculated XRD intensities for an
ordered 50-50 mixed-layer illite-smectite mineral (R = 1, pII = 0) using
(a) the new model with additional distances between layers of 1, 2, 3, and 4 Å with respective probabilities 0.05 and (b) the classical model with a uniform distribution of crystal thickness from 2 to 13 layers.
FIGURE 4. Comparison of the calculated XRD intensities for a
50-50 mixed-layer illite-smectite mineral, R = 0, using the new model,
without disorder of the first type (curve a) and with such disorder (di =
same role as the temperature factor, and its effect increases with the modulus of s. Such an effect can provide an explana-tion for the decrease of the in-plane CSD size of kaolinites with the increase in s, mentioned above. This effect can be in-troduced in the Q(Z) matrix in the same way as the tempera-ture factor is introduced, i.e., by an exponential term exp(- di
Z2/4). The d
i factor is expected to have the same order of
mag-nitude as the temperature factor of the ions of the layers and depends on the type of the layers.
Figure 4 represents the calculations for the same randomly interstratified I-S sample, without (curve a, which is the same as curve a of Fig. 1) and with a di factor of five for the
devia-tion of the unit-cell origins (the temperature factors used in the calculation are respectively 1.5 for cations, 2 for anions, and 11 for interlayer molecules: Moore and Reynolds 1989). The effect of di is as expected, i.e., a decrease in reflection
intensi-ties increasing with the diffraction vector. For example, the intensity of reflection at 26.5∞ (2q) is reduced by a factor of 1/3.
Generalization of the formalism
The formalism developed above for the 00l reflections of a two-component system with R = 0 or 1 can be generalized to systems containing more than two components, and/or R > 1, and/or to hkl reflections (h and/or k π 0). Generalization to greater values of R is obvious, according to Drits and Sakharov (1976) and Plançon (1981). For R = 2, a two-component sys-tem requires square matrices of dimension 4 (it is then neces-sary to specify the type of the preceding layer for each i-j succession of layers). And so on, for R > 2.
Generalization to crystals containing more than two com-ponents is also obvious, according to Drits and Sakharov (1976) and Plançon and Drits (2000). For example, for R = 0 or 1, a two-component system requires rank-2 matrices, whereas a three-component system requires rank-3 matrices. As usual, the word “component” must be understood as a layer having its own unit-cell content.
Generalization to the calculation of hkl reflections (with h and/or k π 0) rather than 00l reflections can also be made, as indicated by Plançon (1981). The phase terms that require in the case of the 00l intensity calculation only the component of the diffraction vector along the normal to the layers plane and the d-spacing between layers, must be replaced by phase terms containing appropriate translations between layers with their in-plane components. The distribution of the thickness of the particles is introduced in the new model exactly in the same way as the distribution of the thickness of the crystals in the classical model.
DISCUSSION
Classical modeling of powder XRD patterns of lamellar materials considers that the samples are composed of rather small “crystals” (usually a few tens of nanometers in the three dimensions, with a distribution of the crystal thickness), where the layers are perfectly parallel with well-defined translations between them (Reynolds 1967; Drits and Sakharov 1976; Plançon 1976, 1981). The model proposed here considers that lamellar materials are composed of “particles” that contain defects: cracks, inner-porosity, bent layers, edge dislocations,
etc. These defects induce variations in the d-spacings that must be introduced by distributions of the d-spacings in the calcula-tion of the XRD patterns.
To be credible, this model must at least reproduce the same diffraction features as the classical model in the high-angle domain of the XRD patterns. Figure 1 shows that this is the case: the “crystals” seen by XRD are only coherent scattering domains of the “particles.” In addition, this new model must produce a different distribution of intensity for the low-angle domain of the XRD patterns, usually imperfectly modeled by classical models. Figure 1 shows that this is the case.
This model must also agree with data provided by other techniques for swelling materials as well as for non-swelling ones. This model is consistent with TEM and HRTEM meth-ods that, in kaolinites, see particles larger than the crystals (Plançon and Tchoubar 1977). It is also consistent with SAXS, which also sees such particles in smectites (Besson 1980; Pons 1980). Additionally, the model accounts for a type of disorder that has not been taken into account so far, disorder of the first type (Guinier 1964), which corresponds to deviations of the unit-cell origins from the ideal positions and can explain the decrease in reflection intensities with an increase in s (Plançon and Tchoubar 1977). Figure 4 illustrates this effect. This new model suggests a systematic recording of a SAXS pattern to get the information of the particles size used in the interpreta-tion of the XRD pattern.
The software, MODXRSD, which corresponds to this new model and allowed the calculations of Figures 1 to 4, will be available from the author upon request.
REFERENCESCITED
Ben Haj Amara, A., Ben Rhaiem, H., and Plançon, A. (2000) Evolution structurale de la nacrite en fonction de la nature des molécules organiques intercalées. Journal of Applied Crystallography. 33, 1351–1359.
Ben Rhaiem, H. (1999) Analyse multi-echelle de phyllosilicates tunisiens par dif-fraction et diffusion aux petits angles des R.X. et par M.E.T., Ph. D.; Thesis, Tunis
Besson, G. (1980) structure des smectites dioctaédriques. Paramètres conditionnant les fautes d’empilement des feuillets, Ph. D.; Thesis, Orléans.
Brown, G. and Brindley, G.W. (1980) Crystal structure of clay minerals and their X-ray identification. Mineralogical Society, London.
Drits, V.A. and Sakharov, B.A. (1976) X-ray structure analysis of interstratified minerals. Nauka, Moscow, 225 pp (in Russian).
Drits, V.A. and Tchoubar, C. (1990) X-ray diffraction by disordered lamellar struc-tures. Springer Verlag, Berlin Heidelberg, 371pp.
Drits, V.A., Srodon, J., and Eberl, D.D. (1997a) XRD measurement of mean crystal-lite thickness of ilcrystal-lite/smectite. Reappraisal of the Kubler index and the Scherrer equation. Clays and Clay Minerals, 45, 461–475.
Drits, V.A., Sakharov, B.A., Lindgreen, H., and Salyn, A. (1997b) Sequential struc-ture transformation of illite-smectite-vermiculite during diagenesis of Upper Jurassic shales from the North Sea and Denmark. Clay Minerals, 32, 351–371. Guinier, A. (1964) Théorie et Technique de la radiocristallographie. Chap. 13:
Dif-fraction par les réseaux cristallins imparfaits. Dunod, Paris, pp 490–636. Jagodzinski, H. (1949) Eindimensionale Fehlordnung in Kristallen und ihr Einfluss
auf die Röntgeninterferenzen. I Berechnung des Fehlordnungsgrades aus den Röntgenintensitaten. Acta Crystallographica, 2, 201–207.
Kakinoki, J. and Komura, Y. (1952) Intensity of X-ray diffraction by one-dimen-sionally disordered crystals. I: General derivation in the case of the “Reichweite” S=0 and 1. Journal of Physical Society of Japan, 7, 30–35.
———(1965) Diffraction by one-dimensionally disordered crystals. I: the intensity equation. Acta crystallographica, 19, 137–147.
Lanson, B., Drits, V.A., Gaillot, A.C., Silvester, E., Plancon, A., and Manceau, A. (2002) Structure of heavy metal sorbed birnessite. I: Results from X-Ray dif-fraction. American Mineralogist, 87, 1631–1645.
Moore, D.M. and Reynolds, R.C. (1989) X-ray diffraction and the identification and analysis of clay minerals. Oxford University press, Oxford, Appendix 311– 325.
transforma-PLANÇON: NEW MODELING OF XRD BY LAMELLAR STRUCTURES 1677
tion of 2:1 dioctahedral layer silicates during dehydroxylation-rehydroxylation reactions. Clays and Clay Minerals, 5, 572–595.
Plançon A. (1976) Phenomène de diffraction produit par les systèmes stratifiés comportant simultanément des feuillets de natures différentes et des fautes d’empilement. Application à l’étude qualitative et quantitative des défauts dans les kaolinites partiellement désordonnées, Ph. D. Thesis, Orléans.
———(1981) Diffraction by layer structures containing different kinds of layers and stacking faults. Journal of Applied Crystallography, 14, 300–304. Plançon, A. and Tchoubar, C. (1977) Determination of structural defects in
phyllosilicates by X-ray diffraction. II Nature and proportion of defects in natu-ral kaolinites. Clays and Clay Minenatu-rals, 25, 436–450.
Plançon, A. and Drits, V. A. (2000) Phase analysis of clays using an expert system and calculation programs for X-ray diffraction by two- and three-component mixed-layer minerals. Clays and Clay minerals, 48, 57–62.
Pons, C.H. (1980) Mise en evidence des relations entre la texture et al structure dans
les systèmes eau-smectites par diffusion aux petits angles du rayonnement syn-chrotron, Ph.D. Thesis, Orléans.
Reynolds, R.C. (1967) Interstratified clay systems: calculation of total one-dimensionnal diffraction functions. American Mineralogist, 52, 661–672. ———(1985) NEWMOD a computer program for the calculation of
one-dimen-sional diffraction patterns of mixed-layered clays. R.C. Reynolds, 9 Brook Rd., Hanover, NH 03755, USA.
Sakharov, B.A., Lindgreen, H., Salyn, A., and Drits V.A. (1999) Determination of illite-smectite structures using multispecimen X-ray diffraction profile fitting. Clays and Clay Minerals, 47, 555–566.
MANUSCRIPTRECEIVED OCTOBER 23,2001 MANUSCRIPTACCEPTED FEBUARY 28, 2001 MANUSCRIPTHANDLEDBY DAVID L. BISH