Publisher’s version / Version de l'éditeur:
Proceedings International Workshop on Rational Evaluation of Ice Forces on Structures, REIFS'99, pp. 21-33
READ THESE TERMS AND CONDITIONS CAREFULLY BEFORE USING THIS WEBSITE. https://nrc-publications.canada.ca/eng/copyright
Vous avez des questions? Nous pouvons vous aider. Pour communiquer directement avec un auteur, consultez la
première page de la revue dans laquelle son article a été publié afin de trouver ses coordonnées. Si vous n’arrivez pas à les repérer, communiquez avec nous à PublicationsArchive-ArchivesPublications@nrc-cnrc.gc.ca.
Questions? Contact the NRC Publications Archive team at
PublicationsArchive-ArchivesPublications@nrc-cnrc.gc.ca. If you wish to email the authors directly, please see the first page of the publication for their contact information.
NRC Publications Archive
Archives des publications du CNRC
This publication could be one of several versions: author’s original, accepted manuscript or the publisher’s version. / La version de cette publication peut être l’une des suivantes : la version prépublication de l’auteur, la version acceptée du manuscrit ou la version de l’éditeur.
Access and use of this website and the material on it are subject to the Terms and Conditions set forth at Review of First-Year Ridge Geometries and Properties in Sakhalin Region
Frederking, Robert; Timco, Garry; Kamesaki, K.; Tada, H.
https://publications-cnrc.canada.ca/fra/droits
L’accès à ce site Web et l’utilisation de son contenu sont assujettis aux conditions présentées dans le site LISEZ CES CONDITIONS ATTENTIVEMENT AVANT D’UTILISER CE SITE WEB.
NRC Publications Record / Notice d'Archives des publications de CNRC: https://nrc-publications.canada.ca/eng/view/object/?id=b6cb5341-e8f1-4fd1-88df-b5ab52f71057 https://publications-cnrc.canada.ca/fra/voir/objet/?id=b6cb5341-e8f1-4fd1-88df-b5ab52f71057
REVIEW OF FIRST-YEAR RIDGE GEOMETRIES AND PROPERTIES IN SAKHALIN REGION1
R. Frederking National Research Council of Canada Ottawa, Ont., K1A 0R6, Canada G.W. Timco National Research Council of Canada
Ottawa, Ont., K1A 0R6, Canada
K. Kamesaki NKK Corporation
Tsu-City, Mie-Pref, 514-03, Japan
H.Tada Japan National Oil Corporation
Chiyoda-ku, Tokyo 100, Japan
Abstract
Information on the morphology and properties of first-year ice ridges in the Sea of Okhotsk is required for design of offshore structures. Data have been compiled to provide a picture of Okhotsk sea ice ridges. The data include sail heights, keel depths, consolidated layer thickness, porosity and ridge width. The data from the Sea of Okhotsk are compared with data for ridges from the Beaufort Sea. Okhotsk ice ridges were found to have similar proportions to Beaufort ridges, i.e. ratio of keel depth to sail height is on average 5:1, average sail porosity 35%, and average keel porosity 20%. Sakhalin ridges are smaller than Beaufort ridges, however they are proportionately 25 % wider than Beaufort ridges.
1. Introduction
The morphology and properties of first-year ice ridges in the Sea of Okhotsk are of interest for establishing the basis for design of offshore structures. Ice studies in the northern Sakhalin offshore have been carried out since the early 1980s. The results of many of these studies have been reported in annual Okhotsk Sea and Sea Ice Symposia held in Hokkaido, Japan. These symposia proceedings have been reviewed and used as a prime source of data on Okhotsk Sea ice ridges. To put the results of this compilation of ridge data from the Sea of Okhotsk into a broader context, they are compared with data for ridges from the Beaufort Sea and other locations.
2. Comparison of Sea of Okhotsk and Beaufort Sea Conditions
The Sea of Okhotsk is located off the eastern coast of Russia between 44 and 59 degrees North latitude and 135 and 155 degrees East longitude. The Beaufort Sea is off the northwestern coast of Canada, between 70 to 75 degrees North latitude and 127 to 160 degrees West longitude. The Sea of Okhotsk is separated from the North Pacific Ocean by the Kamchatka Peninsula and the Kuril Islands. Each year the ice melts out completely from the Sea of Okhotsk so only first year sea ice is found there. The Beaufort Sea is open to the Arctic Ocean, and consequently multi-year ice is also present.
1 Proceedings International Workshop on Rational Evaluation of Ice Forces on Structures pp 21-33, Mombetsu, Japan, February 2-4, 1999.
In general, the Beaufort is characterized by colder winters. The average cumulative number of freezing degree-days for the Beaufort Sea at Tuktoyaktuk is 4750 Co-days. By way of comparison, the average for Chayvo on Sakhalin is about 2200 Co-days, and the 50 year exceedance value is 2750 Co-days (Kamesaki et al, 1998). Because of the north to south movement of ice in the Sea of Okhotsk, one might take a location further to the north to characterize the number of freezing degree-days for Sakhalin ice conditions. Kamesaki et al (1998) suggested that the number of freezing degree-days might be increased by 500 Co-days to take this factor into account. Polomshnov et al (1996) has reported a freezing index of 4220 Co -days for Gizhiga at 62 degrees north latitude, the most northerly point of the Sea of Okhotsk. Even with these observations, it is reasonable to conclude that the Beaufort Sea region has a colder climate than the Sea of Okhotsk.
The 20 year return period wind speed and gust velocity for the Beaufort Sea are 27 and 34 m/s respectively. For the Sea of Okhotsk wind speeds can reach 25 to 30 m/s, quite comparable to the Beaufort.
Currents in the Beaufort are quite low, but can reach speeds of 0.05 to 0.1 m/s at the southern edge of the Beaufort gyre. The maximum tidal component of velocity is 0.05 m/s. Wind driven surface currents can reach 0.5 m/s. In the Sea of Okhotsk the maximum surface current is 1.85 m/s, with the tidal component 1.2 m/s. The Sea of Okhotsk is thus considerably more dynamic than the Beaufort Sea. Drift velocities at the southern edge of the Beaufort gyre are on average about 5 km/day, while net drift velocities along the Sakhalin coast are 30 to 50 km/day. Thus it can be seen that the ice dynamics of the Sea of Okhotsk are greater than those of the Beaufort Sea.
3. Sakhalin Ridge Geometries and Properties
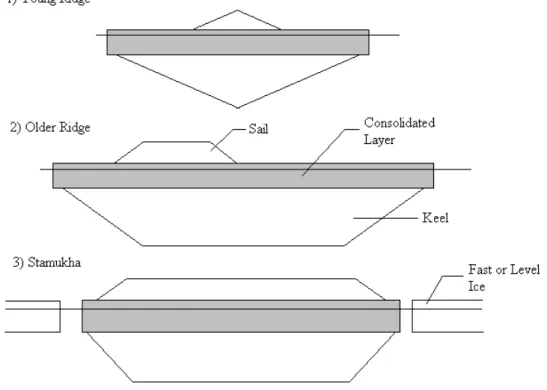
The following description will mostly refer to ridges but it should be pointed out that ridges or hummocks and stamukhi form in the same manner. Stamukhi are stationary-grounded ice ridges and thus grow larger. The formation of ridges depends on the time of their creation. Thicker ice leads to the formation of larger (higher sails and deeper keels) ridges. Obviously an older ridge will be stronger as the consolidated layer grows in thickness over time. The time of formation is also important because of the ice thickness and drift speeds. Early in the winter when the ice is thin and the drift speeds are marginally slower, ridges are smaller, however there is more time for the consolidated layer to thicken. As the winter progresses, the ice becomes thicker and drift speeds increase, making it possible for larger ridges to form; however, in this case there is less time for consolidation.
When a ridge is formed, large blocks of ice pile up on top of each other. Brash ice (small ice fragments), which form due to ice failure, move towards the water line of the ridge due to gravity and buoyancy, tending to fill the voids between ice blocks and form what will become the consolidated layer. This causes the initial porosity of the consolidated layer to be smaller than the upper (sail) and lower (keel) parts of the ridge. The upper part of the ridge, or sail, contains ice fragments with small voids and large ice blocks. The porosity of the sail is usually around 30% (Beketsky et al, 1996).
The consolidated layer is delineated as the first continuous layer of ice relatively free of cavities or pores below sea level. The porosity of the consolidated layer is essentially zero, and it forms one continuous layer of ice across the ridge. The lower part of the ridge, or keel, is made
up of blocks and fragments of ice. It is composed of soft and hard ice layers, and has an average porosity of around 20% (Beketsky et al, 1996).
According to Beketsky et al, (1997b), ridges are formed in one of three ways in the Okhotsk Sea. First, they can be created due to the impact of floes of level ice with fast ice. Such ridges are due to the combined forces of onshore winds, currents and tides resulting in a horizontal movement of level ice towards the coast. Sakhalin Bay is a common location for this type of ridging.
The second way that ridges are formed is within the boundary zones between drift ice and fast ice to the north of Sakhalin Island. These ridges are usually formed in the northeastern Sakhalin offshore along with drift ice floes. They are usually small, ranging in thickness from 0.2-0.3 m to 1-1.2 m depending on the time of their formation.
The third mode of ridge formation occurs when two drifting ice floes collide. The resulting ridge tends to be long and straight, usually no more than 0.7-0.8 m in thickness (Beketsky et al, 1997b).
Ridges usually take on one of three cross sectional profiles that are illustrated in Figure 1. The most common shape of ridge in the Okhotsk Sea was found to be of trapezoidal cross-section for both sail and keel where the axis of each do not line up one above the other. This is represented as the second ridge in Figure 1. It was found that the sail and keel axis of such ridges had a lateral displacement of about 5-10 m between them (Beketsky et al, 1997b). The first ridge is representative of a young ridge, whereas the third ridge is representative of an older grounded stamukha.
Another parameter important ridge parameter is the number of ridges that are present in a given area at any time of the year. In Russia, the number of ridges in an area, or ridge frequency, is indexed as a point from 0 to 5. A 0 represents an area where no ridges are present whereas a 5 represents an area where the entire surface is covered with ridges.
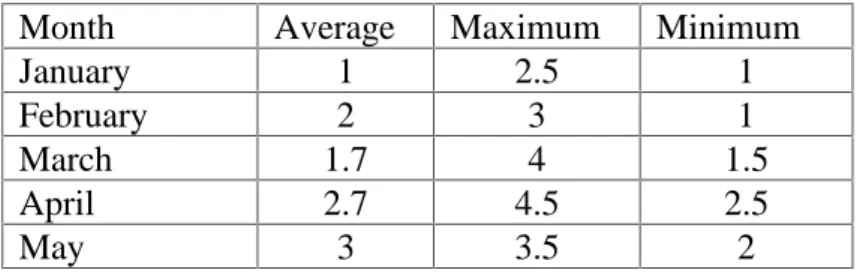
For the period from 1986 to 1991, the average ridge frequency was recorded to increase from 1 point in January to 3 points in May, with a maximum value of 4.5 points in April. The values were obtained using an aerial survey and counting the average number of ridges in a 100-meter by 100-100-meter square. Table 1 shows the trend in ridge frequency from the months January to May (Surkov, 1997).
Table 1 Monthly Ridge Frequency (in Points) from 1986 to 1991
Month Average Maximum Minimum
January 1 2.5 1
February 2 3 1
March 1.7 4 1.5
April 2.7 4.5 2.5
May 3 3.5 2
There have also been extensive studies of ice properties in the Sea of Okhotsk. Some of these results are summarized in Table 2 (Astafiev et al, 1991). The ice temperatures range from -11.3 oC in February to -1.0 oC in May. The salinity of the ice ranges from 7.3 parts per thousand (ppt) in January and to 2.8 ppt in May, and the uniaxial compressive strength of the ice ranges from 1.7 MPa in March to 0.5 MPa in May. These strength data are a summary of more extensive results reported by Polomoshov et al (1992).
Table 2 Monthly Ice Temperatures, Salinity, and Uniaxial Compressive Strength
Parameter January February March April May
Temperature(oC) -10.7 -11.3 -3.4 -1.8 -1.0
Salinity (ppt) 7.3 6.5 4.4 3.6 2.8
Strength (MPa) 0.68 1.44 1.72 096 0.52
The salinity values seem to be at odds with those reported in a 1992 study which found values ranging from 28.1 ppt to 0.2 ppt (Polomoshov, 1992). This difference could be due to a number of causes, such as the location of the salinity sample in the ice sample. During the winter, ice salinity is a maximum at the surface, decreases to a minimum in the centre of the ice cover, and then increases towards the bottom of the ice cover. It could be possible that one study measured the salinity at the centre of the ice sheet, whereas another could have taken their samples from the ice surface. This would cause a discrepancy between readings, but since neither source indicated where in the ice cover samples were taken, the results are uncertain.
As mentioned previously, ice ridges are the major concern for oil development in most northern offshore areas. With the emphasis placed on ice ridges, background data are required in order to produce a description of the geometry and size of ridges. Data were collected from various sources. The most frequent source was papers presented at symposiums and conferences for ice research or for Okhotsk Sea developments. Unfortunately, reporting was often incomplete
in the papers. Another problem resulted from the fact that most papers published on the Okhotsk Sea ridges are by the same group of authors. This can cause a problem if data found in separate papers are actually duplicates from the same source. For this reason, some of the data presented may actually be repeated, and makes any statistical analysis suspect.
3.1 Sail height to keel depth relations
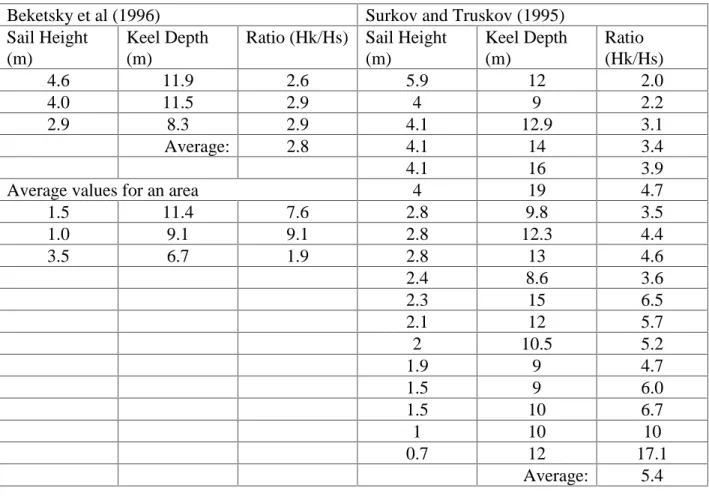
The most commonly presented data for ridges are sail height and keel depth. A search of the literature revealed that Surkov and Truskov (1995) have one of the most extensive presentations of ridge and stamukha data for Sakhalin. Data on floating ridges from a figure in their paper were digitized and recorded in Table 3. Each data pair represents the maximum sail height and keel depth along a profile across one ridge. Additional data from Beketsky et al (1996) were also located and added to the table. The Beketsky data are from three areas around the northern end of Sakhalin. The first three entries are digitized from profiles of individual ridges in the Beketsky et al (1996) paper. The second set of three entries represents average values for three differeent areas and may include stamukhi, which could explain some of the extremely high sail heights in relation to keel depth.
Table 3 Sail and keel depth data from Sakhalin
Beketsky et al (1996) Surkov and Truskov (1995)
Sail Height (m)
Keel Depth (m)
Ratio (Hk/Hs) Sail Height (m) Keel Depth (m) Ratio (Hk/Hs) 4.6 11.9 2.6 5.9 12 2.0 4.0 11.5 2.9 4 9 2.2 2.9 8.3 2.9 4.1 12.9 3.1 Average: 2.8 4.1 14 3.4 4.1 16 3.9
Average values for an area 4 19 4.7
1.5 11.4 7.6 2.8 9.8 3.5 1.0 9.1 9.1 2.8 12.3 4.4 3.5 6.7 1.9 2.8 13 4.6 2.4 8.6 3.6 2.3 15 6.5 2.1 12 5.7 2 10.5 5.2 1.9 9 4.7 1.5 9 6.0 1.5 10 6.7 1 10 10 0.7 12 17.1 Average: 5.4
The ratio of keel depth to sail height was determined for each ridge. The calculated ratios are in Table 3. From these findings we can see that the data collected by Surkov and Truskov gives an average ratio of 5.4. Note that Surkov and Truskov (1995) proposed an average ratio of
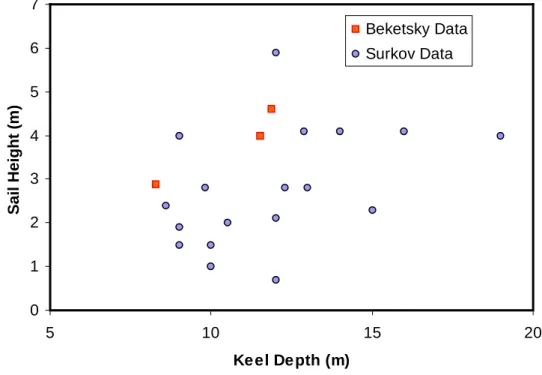
4.0 for the keel to sail ratio of ridges. In general more credence should be put in the Surkov and Truskov data rather than the Beketsky data since they are more numerous and a clear distinction is made between ridges and stamukhi. Data from the 18 ridges of Surkov and Truskov, plus the 3 ridges of Beketsky et al are plotted in Figure 2.
Figure 2 Relation between sail height and keel depth
Although the data appear scattered, it can be seen that generally as the sail height increases so does the depth of keel. There is some difference between the Beketsky and Surkov data; the Beketsky data being at the upper limit of sail height compared to the Surkov data, which suggests that some of the Beketsky ridges may in fact be grounded.
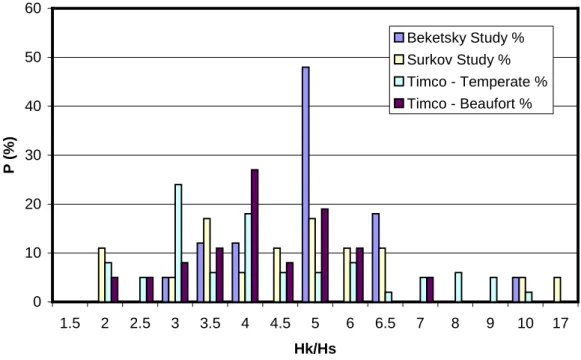
In order to get a better appreciation for what range of keel to sail ratios are most representative of ridges in the Sakhalin area; a distribution plot for the ratios is presented in Figure 3. A comparison is made between Surkov and Truskov (1995), and those from a study by Beketsky et al (1997a). Beketsky reported the percentage distribution of the ratio of sail height to keel depth, and concluded that over 50% of the ridges studied had a keel to sail ratio between 5 and 7. The percentage distribution comparison of values is presented in Figure 3.
This figure gives relations not only for Sakhalin ridges, but also for ridges in general. The Beketsky and Surkov data all represent ridge information collected from the Okhotsk Sea. The Timco data represents ridge data in other Arctic areas (Timco and Burden, 1997). The purpose of using it here is to show that the ridges of the Sakhalin area are of the same proportions as ridges across the Arctic. The Beketsky et al and Surkov and Truskov studies show a distribution more typical of the actual range of ratios in the Okhotsk Sea. When all of this ridge data is compiled, it appears that on average, ridges have a keel-to-sail ratio of about 5 but the values can range from as low as 2 to as high as 7.
0 1 2 3 4 5 6 7 5 10 15 20 Ke el De pth (m) Sa il He ight (m ) Beketsky Data Surkov Data
0 10 20 30 40 50 60 1.5 2 2.5 3 3.5 4 4.5 5 6 6.5 7 8 9 10 17 Hk/Hs P ( % ) Beketsky Study % Surkov Study % Timco - Temperate % Timco - Beaufort %
Figure 3 Distribution of keel to sail ratios from various sources
3.2 Sail and Keel Widths
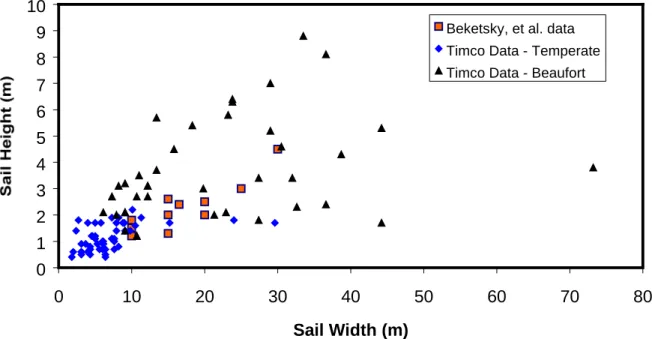
Other important characteristics of ridges that need to be considered are the widths of the sail and keel. These widths can become very large and thus can generate large forces on structures. It is important to be able to know how wide a ridge is in relation to the height of the sail. Beketsky et al (1997a) contains information on sail and keel widths of Sea of Okhotsk ridges. Figure 4 is a plot of sail height versus sail width. To improve confidence in it, comparable data from Timco and Burden (1997) were also added to the figure. The Timco data is for Beaufort Sea and temperate ridges.
From this figure a general linear relationship between the sail height and its width is evident. The Beketsky data from the Sakhalin region follows the same trend as the Timco data. This suggests that the relationship of sail width to sail height is similar for both the Sea of Okhotsk and Beaufort.
0 1 2 3 4 5 6 7 8 9 10 0 10 20 30 40 50 60 70 80 Sail Width (m)
Beketsky, et al. data Timco Data - Temperate Timco Data - Beaufort
Figure 4 Relation of sail width to sail height
It is also necessary to determine the size of the keel width. It has already been established that there is a general relationship between the keel and sail. In Figure 5 keel depth is plotted versus keel width. Using this figure, along with the relationship between sail height and keel depths, it is possible to relate keel width to height of the sail. Again comparable data from the Beaufort was obtained to compare with Beketsky’s. It can be seen that the comparison is good.
0 5 10 15 20 25 30 0 20 40 60 80 100 120 140 160 Keel Width (m)
Beketsky, et al. Data Timco Data - Temperate Timco Data - Beaufort
3.3 Consolidated Layer
One of the most important features of a ridge is the consolidated layer. This is the part of the ridge that is thought to exert the most pressure on structures due to its solid composition. The thickness of the consolidated layer is not a constant but increases with time as this part of the ridges refreezes. Surkov (1997) is one of the most comprehensive sources of data on consolidated layer thickness for the Sea of Okhotsk; however it is for stamukhas or grounded ridges. Nevertheless it is one of the most extensive data sources available, being derived from over 100 thermal drill profiles. These data are summarized in Table 4.
Table 4 Consolidated layer thickness of stamukhas in Sakhalin area (Surkov, 1997) Location Age, months Thickness, m Standard Deviation, m Number of Measurements
max Avg Min
Sakhalinsky Bay 2.5 8.5 4.0 2.0 1.3 80
Marija Cape 0.5 3.2 1.4 0.5 0.6 26
Odoptu Bay 1.5 6.1 2.4 0.7 1.3 25
The first thing apparent is the very large variation in thickness, the coefficient of variation ranging from 0.3 to 0.5. There is also an obvious trend of increasing thickness with time. An interesting comparison can be made between consolidated layer thickness and the thickness of the adjacent level ice for the Odoptu Bay location. The level ice had an average thickness of 1.6 m with a standard deviation of 1.2 m, as compared to 2.4 m and 1.3 m respectively for the consolidated layer. Thus the consolidated layer thickness is 1.5 times the adjacent level ice thickness. Beketsky et al (1996) has also reported on the consolidated layer thickness of stamukhas, see Table 5.
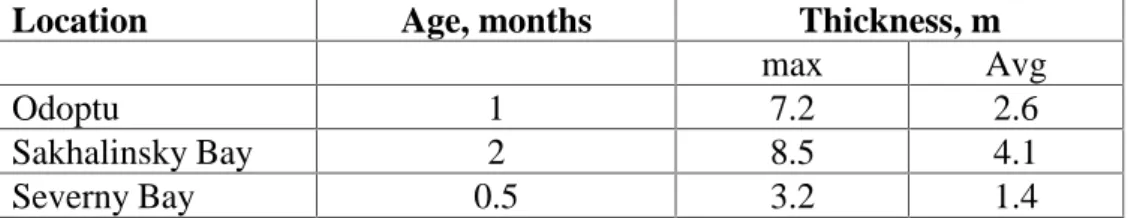
Table 5 Consolidated layer thickness for stamukhas (Beketsky et al, 1996)
Location Age, months Thickness, m
max Avg
Odoptu 1 7.2 2.6
Sakhalinsky Bay 2 8.5 4.1
Severny Bay 0.5 3.2 1.4
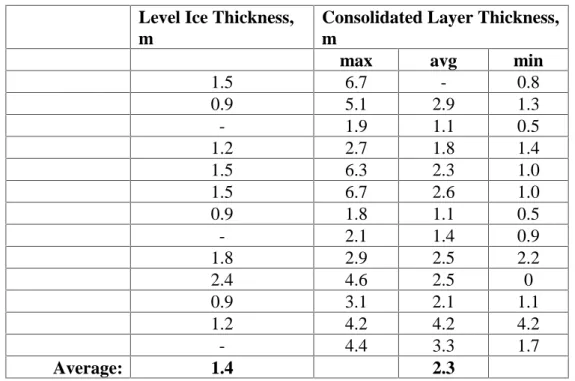
These numbers are consistent with those of Surkov. The only caution is the question of whether these data are from the same initial source. Note that the Sakhalinsky Bay data are virtually identical in both cases. To put these results into another context, a comparison was made with first-year ridges in the Beaufort Sea. The results of a study conducted in April and May, 1978 by McGonigal (1978) are presented in Table 6. No information on the age of the ridges is given, but it would be estimated that they were 2 to 3 months old.
Comparing the results from the Beaufort and Sakhalin for comparable ridge age, it can be seen that Sakhalin ridges appear to have thicker consolidated layers. Given the lower air temperatures of the Beaufort this is hard to explain. One explanation is that the Sakhalin data are from stamukhas that would probably have lower initial porosity (tighter packing or ice fragments) which would lead to development of a thicker consolidated layer.
Table 6 Consolidated layer thickness of ridges in the Beaufort Sea (McGonical, 1978) Level Ice Thickness,
m
Consolidated Layer Thickness, m
max avg min
1.5 6.7 - 0.8 0.9 5.1 2.9 1.3 - 1.9 1.1 0.5 1.2 2.7 1.8 1.4 1.5 6.3 2.3 1.0 1.5 6.7 2.6 1.0 0.9 1.8 1.1 0.5 - 2.1 1.4 0.9 1.8 2.9 2.5 2.2 2.4 4.6 2.5 0 0.9 3.1 2.1 1.1 1.2 4.2 4.2 4.2 - 4.4 3.3 1.7 Average: 1.4 2.3 3.4 Porosity
Beketsky et al (1996) have reported overall sail porosities of 31% and 20% for the keel. Porosity plays a significant role in the determination of keel strength, as well as the rate at which the consolidated layer grows.
4. Comparison of Sakhalin ridges to Beaufort and Temperate Ridges
Despite the fact that most papers on the Sakhalin offshore contain little specific information on ridges in the Sea of Okhotsk, they do contain formulas relating specific characteristics of ridges in the area. Most of the relational formulas compared keel depth and the width of the ridge to the sail height. This is done because sail height is the easiest characteristic of a ridge to measure.
Beketsky et al (1997a) have proposed the following relation for ridges:
Hk = 5 Hs (1)
where Hk is keel depth and Hs is sail height. By way of comparison the Surkov and Truskov
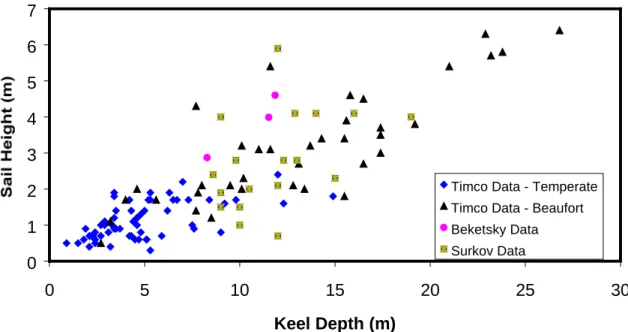
data in Section 3.1 suggests a ratio of 5.4, a value which is not significantly different from Beketsky’s. Timco and Burden (1997) found a keel to sail ratio of 4. All these data sets are plotted in Figure 6 for comparison.
0 1 2 3 4 5 6 7 0 5 10 15 20 25 30 Keel Depth (m)
Timco Data - Temperate Timco Data - Beaufort Beketsky Data Surkov Data
Figure 6 Relation between sail height and keel depth
It appears from this figure that there is a relation between sail and keel that is independent of the geographical location of the ridge. The keel will be, on average, approximately 5 times as deep as the sail is high. The region that the ridge is located in affects the size of the sail and keel, but not the ratio of their heights. From the above figure, it appears that temperate ridges have the smallest heights and Beaufort ridges have the largest. The Sakhalin ridges lie somewhere in between, with some ridges that approach the Beaufort ridges in height, but others as small as temperate ones. This is probably due to the highly dynamic nature of ice in the Sea of Okhotsk, which creates many ridges, ranging from the small to the large.
The keel width is another dimension that is very hard to measure from the surface. It necessitates drilling many holes or using expensive radar equipment, both procedures being very time consuming. For these reasons, it is desirable to be able to estimate the width of the keel from a knowledge of the height of the sail. In Figure 4 and Figure 5 we saw the relationship between Timco and Beketsky data on sail heights and widths, and on keel depths and widths. The relationship between each set of data appeared to be close enough that it was assumed that there was a universal relationship for each characteristic in Arctic regions. Each paper presented a formula relating keel width to sail height but they did not agree. Beketsky et al (1997a) proposed the following formula relating keel width and sail height: Bk = 19 Hs. Timco, however, proposed
the relationship Bk = 15 Hs, which is lower than Beketsky’s relationship. These relations are
similar, but suggest that Sakhalin ridges may be wider than ridges in the Beaufort. The greater dynamics of the Sea of Okhotsk may be an explanation for the wider ridges formed there.
Beketsky also proposed a relation for the thickness of the consolidated layer,
hL = 1.15 Hs (2)
where hL is consolidated layer thickness and Hs is the sail height. Note that the consolidated layer
thickness, hL, is included in the keel depth, Hk.
Bekker et al (1997) has proposed a design ridge with a 1% annual probability of exceedence. Its dimensions are as follows:
Hs = 3 m Hk = 21 m Bs = 20 m Bk = 57 m hL = 3.45 m and properties c = 0.58 kPa f = 21o. 5. Conclusions
Since there is limited information available on ridges in the Sea of Okhotsk, the conclusions made here must necessarily be restricted. Those made however, are supported by the available data. The following is a summary of the findings:
1. The ratio of keel depth to sail height (based on maximum values for a ridge section) is on average 5 to 1.
2. The average consolidated depth can be as high as 4 m.
3. The average sail porosity was 35% and the average keel porosity 20%. 4. The width of the keel is 19 times the height of the sail.
5. Sakhalin ridges appear to be about 25% wider than Beaufort ridges. References
Astafiev, V.N., Polomoshov, A.M., Truskov, P.A., 1991. Stamukhi on the Northern Sakhalin Offshore. Sakhalin Research and Design Institute. Okha, USSR. From the Proceedings of the First International Offshore and Polar Engineering Conference, Edinburgh, United Kingdom, 11-16 August, 1991, Vol. II, pp. 461-466.
Beketsky, S.P., Astafiev, V.N. and Truskov, P.A., 1996. Structure of Hummocks Offshore of Northern Sakhalin, Proceedings of the Sixth International Offshore and Polar Engineering Conference, Los Angeles, USA, May 26-31, 1996, Vol. II, pp. 398-400.
Beketsky, S.P., Astafiev, V.N., Bogdanchikov, S.M., 1997a. Technique of Determination of Design Parameters of Hummocks. Proceedings of the 16th International Conference on Offshore Mechanics and Arctic Engineering and Port and Ocean Engineering Under Arctic Conditions, Yokohama, Japan, April 13-17, 1997, Vol. IV, pp. 239-244.
Beketsky, S.P., Astafiev, V.N., Truskov, P.A., 1997b. Design Parameters for Hummocks and Grounded Hummocks in the Sea of Okhotsk. Proceedings of the Seventh International Offshore and Polar Engineering Conference, Honolulu, USA, May 25-30,1997, Vol. II, pp. 487-493. Bekker, A.T., Komarova, O.A. and Vasiljev, S.L., 1997. Method of Ridge Force Analysis on Offshore Structures. Proceedings 7th International Offshore and Polar Engineering Conference, Honolulu, May 25-30, 1997, Vol. II, pp.461-465.
Kamesaki, K., Tsukuda, K., Yamauchi, Y., Tada, Y. and Iijima, R. 1998. A Design Condition for Structures in Sea Ice – Estimate of Accumulated Freezing Index and level Ice Thickness at Chayvo, Sakhalin, Proceedings 13th Okhotsk Sea and Sea Ice Symposium, Hokkaido, Japan, February 1-5, 1998, pp. 168-173.
McGonical, D. 1978. First Year Pressure Ridge Study Beaufort Sea, April-May 1978, Frontier Research Division, Gulf Canada Resources Ltd.
Polomoshov, A.M., Truskov, P.A. and Tambovsky, V.S., 1992. Determination of Design Values for Sea Ice Physio-Mechanical Properties. Proceedings of the Second International Offshore and Polar Engineering Conference, San Francisco, USA, May 14-19, 1992, Vol. II, pp. 641-650. Polomoshov, A.M., 1992. Seasonal Variability of Sea Ice Physio-Mechanical Properties. Proceedings of the Seventh Okhotsk Sea and Sea Ice Symposium, Hokkaido, Japan, February 2-5, 1992, paper P-10.
Polomoshov, A.M., Astafiev, V.N. and Bogdanchikov, S.M., 1996. The problem of Choice of the Design Parameter for Ice Thickness. Proceedings of the eleventh Okhotsk Sea and Sea Ice Symposium, Hokkaido, Japan, February 25-28, 1996, pp. 171-174.
Surkov, G.A. and Truskov, P.A., 1995. Study of Ice Pressure Ridges and Stamukhi Offshore of Sakhalin. Proceedings of the Tenth Okhotsk Sea and Sea Ice Symposium, Hokkaido, Japan, February 5-8, 1995, pp.53-58.
Surkov, GA, 1997. Parameters of Ice Ridges of the Okhotsk Sea. Sakhalin Oil and Gas Institute. Okha, Russia. From the Proceedings of the Seventh International Offshore and Polar Engineering Conference, Honolulu, USA, May 25-30, 1997, Vol. II, pp.68-69.
Timco, G.W. and Burden, R.P., 1997. An Analysis of the Shapes of Sea Ice Ridges. Reprint From Cold Regions Science and Technology, Vol. 25, pp. 65 - 77.
Truskov, P.A., Beketsky, S.P., Surkov, G.A., Polomoshov, A.M., 1992. Strength Parameters of Hummocks. Sakhalin Research and Design Institute. Okha, Russia. From the Proceedings of the Second International Offshore and Polar Engineering Conference, San Francisco, USA, June 14-19, 1992, Vol. II, pp. 793-789.