HAL Id: inserm-00271195
https://www.hal.inserm.fr/inserm-00271195
Submitted on 18 Aug 2008
HAL is a multi-disciplinary open access archive for the deposit and dissemination of sci-entific research documents, whether they are
pub-L’archive ouverte pluridisciplinaire HAL, est destinée au dépôt et à la diffusion de documents scientifiques de niveau recherche, publiés ou non,
Educational differences in cancer mortality among
women and men: a gender pattern that differs across
Europe.
Gwenn Menvielle, Anton Kunst, Irina Stirbu, Bjorn Heine Strand, Carme
Borrell, Enrique Regidor, Annette Leclerc, Santiago Esnaola, Matthias Bopp,
Olle Lundberg, et al.
To cite this version:
Gwenn Menvielle, Anton Kunst, Irina Stirbu, Bjorn Heine Strand, Carme Borrell, et al.. Educational differences in cancer mortality among women and men: a gender pattern that differs across Europe.. British Journal of Cancer, Cancer Research UK, 2008, 98 (5), pp.1012-9. �10.1038/sj.bjc.6604274�. �inserm-00271195�
Educational differences in cancer mortality among women and men: a gender pattern that differs across Europe
Running title: Cancer mortality by education and gender in Europe
Gwenn Menvielle1, Anton E Kunst1, Irina Stirbu1, Bjørn Heine Strand2, Carme Borrell3,
Enrique Regidor4, Annette Leclerc5, Santiago Esnaola6, Matthias Bopp7, Olle Lundberg8,
Barbara Artnik9, Giuseppe Costa10, Patrick Deboosere11, Pekka Martikainen12, Johan P
Mackenbach1
1: Department of Public Health, Erasmus MC, University Medical Center Rotterdam, Postbus 2040, 3000 CA Rotterdam, The Netherlands
2: Division of Epidemiology, Norwegian Institute of Public Health, Oslo, Norway 3 : Agència de Salut Pública de Barcelona, Barcelona, Spain
4 : Department of Preventive Medicine and Public health, Universidad Complutense de Madrid, Madrid, Spain
5: INSERM U687, Saint-Maurice, France
6: Research Unit, Department of Health, Basque Government, Vitoria-Gasteiz, Spain 7: Institute of Social and Preventive Medicine, University of Zurich, Switzerland 8: CHESS, Stockholm University, Stockholm, Sweden
9: Department of Public Health, Faculty of Medicine, Ljubljana, Slovenia 10: Department of Public Health, University of Turin, Turin, Italy
11: Interface Demography, Centrum voor Sociologie-VUB, Brussels, Belgium 12: Department of Sociology, University of Helsinki, Helsinki, Finland
Corresponding author
Gwenn Menvielle, [email protected],
INSERM U687, Hôpital Paul Brousse, 16 avenue Paul Vaillant Couturier Bâtiment 15/16, 94807 VILLEJUIF CEDEX, France
The aim is to compare socioeconomic inequalities in total cancer mortality between women and men in different European populations, and to investigate which cancer sites explain the differences between gender and populations. We used longitudinal mortality datasets. Data were collected during the 1990s among women and men aged 30-74 at baseline in 12 European populations (Madrid, Basque region, Barcelona, Slovenia, Turin, Switzerland, France, Belgium, Denmark, Norway, Sweden, Finland). Socioeconomic status was measured using educational level. We conducted Poisson regression analyses and computed relative indices of inequality (RII). We observed large variations within Europe for educational differences in total cancer mortality among men and women. Three types of situations were observed: Denmark, Norway and Sweden (significant RII around 1.3-1.4 among both men and women); France, Switzerland, Belgium and Finland (significant RII around 1.7-1.8 among men and around 1.2 among women); Spanish populations, Slovenia and Turin (significant RII from 1.29 to 1.88 among men; no differences among women except in the Basque region where the RII is significantly lower than 1). Lung, upper aerodigestive tract and breast cancers explained most of the variations found between gender and populations in the magnitude of inequalities in total cancer mortality. Given time trends in cancer mortality, the gap in the magnitude of socioeconomic inequalities in cancer mortality between gender and between European populations will probably decrease in the future.
Key words
Introduction
Studies consistently reported socioeconomic inequalities for total mortality and for many causes of death (Borrell et al., 1999; Bucher & Ragland, 1995; Harding, 1995; Steenland et al., 2004). For cancer mortality, several studies consistently observed higher mortality rates among men with lower socioeconomic position (Borrell et al., 2003; Davey Smith et al., 1991; Doornbos & Kromhout, 1990; Faggiano et al., 1995; Faggiano et al., 1997; Mackenbach et al., 1999; Menvielle et al., 2005). On the contrary among women, many studies did not find important variations by socioeconomic status (Borrell et al., 2003; Faggiano et al., 1997; Menvielle et al., 2005; Michelozzi et al., 1999), while other studies observed higher total cancer mortality rates among women with higher or lower socioeconomic position, depending on the country (Faggiano et al., 1995; Mackenbach et al., 1999). This raises the questions to what extent socioeconomic inequalities in total cancer mortality among women really vary between countries, and which cancer sites are mostly responsible for the facts that inequalities in total cancer mortality rates among women are often small or even inverse. An international comparison of educational disparities in cancer mortality could provide some answers to these questions. Previous European comparisons focused on specific cancer sites (Mackenbach et al., 2004; Menvielle et al., 2007; Strand et al., 2007). However, no study included all cancer sites or tried to assess the role of different cancer sites in explaining the sometimes small inequalities among women. Such an international comparison would be informative on cancer etiology and may help to understand the ways in which cancer inequalities are related to national factors such as alcohol consumption patterns, the smoking epidemic or past social and sanitary developments.
A new large longitudinal dataset including many European populations spread all over Western Europe was recently collected. The aim of this study is to compare educational differences in total cancer mortality between women and men, and to investigate which cancer sites explain the differences between gender and populations.
Material and methods
Longitudinal data from 12 European populations was used (Madrid, the Basque region, Barcelona, Slovenia, Turin, Switzerland, France, Belgium, Denmark, Norway, Sweden and Finland). Most datasets covered the entire national population except France (a representative sample of 1% of the population), the entire regional population (Madrid, the Basque region), or the population from specific urban areas (Barcelona, Turin). Subjects were selected from census and followed up during the 1990s (Table 1). Subpopulations were excluded in three datasets: foreigners in Switzerland, subjects deceased outside Catalonia in Barcelona and foreigners and subjects born in overseas areas in France.
Analyses were performed among subjects aged 30-74 at the time of the census. The follow-up period was shorter for Belgium, Denmark, the Basque region and Madrid. In order to get results on comparable ages in terms of observed age at death, analyses were conducted on slightly older age groups at baseline for these populations (35-79 for Madrid and 30-79 for Belgium and the Basque region). The age range for the Danish data could not be changed, as no information on socioeconomic position was available for subjects aged over 75.
The linkage between census data and mortality registries was achieved for more than 96% of all deceased persons in almost all populations except Madrid (70%), the Basque region (93%) and Barcelona (94.5%). In these populations however, no variation in this percentage was found according to age, sex or socioeconomic position (in the Basque region unfortunately, this check could not be conducted for the socioeconomic position). In order to avoid an underestimation of absolute mortality rates in these three populations, observed absolute mortality was increased using correction factors (1/0.70, 1/0.93 and 1/0.945 respectively).
The socioeconomic status was measured with education declared at the census at the beginning of the follow-up period. This variable was categorized into three classes, which correspond to the ISCED (International Standard Classification of Education) classification: 0-2 (lower secondary education or less), 3-4 (upper secondary education), 5-6 (post-secondary education). The percentage of missing values for education was low: 6% for Belgium and less than 3% for the other populations. These subjects were excluded from the analysis.
The cause of death was obtained by linkage with death registries. Analyses were conducted for total cancer mortality (ICD 9: 140-249), and for the following cancer sites: lung (ICD 9: 162-3, 165), upper aerodigestive tract (UADT which group oral cavity, pharynx, esophagus and larynx) (ICD 9: 140-50, 161), colorectal (ICD 9: 153-4), stomach (ICD 9: 151), leukaemia and Hodgkin’s disease (ICD 9: 201, 204-8), kidney and bladder (ICD 9: 188-9), liver (ICD 9: 155), pancreas (ICD 9: 157), breast (ICD 9: 174-5), cervix (ICD 9: 180), prostate (ICD 9: 185), other neoplasms (ICD 9: rest 140-249).
The magnitude of socioeconomic inequalities in mortality was estimated in both absolute and relative terms. To estimate relative inequalities, we computed relative indices of inequality (RII) using Poisson regression. The calculation of the RII is based on a ranked variable, which specifies for each educational group the mean proportion of the population with a higher level of education. For instance, the rank of the lowest educational group is calculated as the proportion of the population with middle or high education, plus half of the proportion of the population with a lowest educational level. The RII is then computed by regressing the mortality on this ranked variable. Thus, the RII expresses inequality within the whole socioeconomic continuum and can be interpreted as the ratio of mortality rates between the two extremes of the educational hierarchy. As it takes into account the size and relative position of each educational group, it is well adapted to compare populations with different
educational distributions (Mackenbach & Kunst, 1997; Pamuk, 1985). Analyses were conducted separately for each population separately. In order to assess whether the estimates significantly differed between populations, we tested the interaction between country and education in a model that included all populations.
To estimate absolute socioeconomic inequalities we computed absolute mortality rate differences between the lowest and the highest educational level, both for all cancer mortality as for specific cancer types. Age-standardized mortality rates were computed, using the population of EU-15 plus Norway of 1995 as the standard population.
Results
Large differences were observed in the educational distribution between countries and among men and women (Table 1). The percentage of subjects with post-secondary education was lower among women in all populations except Sweden. This percentage was below 10% among women in Turin, France and Slovenia.
Graph 1 presents total cancer mortality rates by educational level. Mortality rates were dramatically lower among women. The mortality rate among women with the lowest education was lower than that found among men with the highest education in all populations except Denmark. Total cancer mortality rates were generally higher among men with lower educational levels. Among women however, the gradient was much narrower and was not observed in the Spanish regions, Slovenia and Finland. The lowest total cancer mortality rates were observed in the Spanish regions and in France for women, in the Nordic countries, especially in Sweden, for men (Tables 2&3). Breast, lung and colorectal cancers accounted for 39-46% of all cancer cases among women except in Denmark (52%). Among men, prostate, lung and colorectal cancers accounted for 47-52% of all cancer cases, except in France (42%), the Basque region (44%) and Belgium (57%).
RII for total cancer mortality by population are presented in tables 2 (for women) and 3 (for men). We can distinguish three main patterns: in Denmark, Norway and Sweden, we observed higher rates among low educated men and women with statistically significant RIIs around 1.3-1.4; in France, Switzerland, Belgium and Finland, RIIs were significantly higher than 1 among men and women, but they were larger among men (RII around 1.7-1.8) than among women (RII around 1.2); in Madrid, Barcelona, Slovenia and Turin, RIIs were significant among men (RII from 1.29 to 1.88) but not among women (borderline in Turin). The RII among women was even significantly lower than 1 in the Basque region.
RIIs among women by population and cancer site are presented in table 2. For some cancer sites, inequalities did not significantly differ between populations. No educational differences were found for leukaemia and Hodgkin’s disease. Small socioeconomic inequalities favouring high educated people were found for colorectal cancer, they were larger for liver cancer, and especially for cervical and stomach cancer. However, the analyses for cervix cancer were based on small number of deaths. For breast cancer, RIIs were significantly lower than 1 in all populations except in Turin, France and Switzerland.
A clear North-South gradient was found for lung cancer: we found an RII significantly lower than 1 in the three Spanish regions and Slovenia; and an RII significantly larger than 1 in Switzerland, Belgium, and the Nordic countries. No significant association between education and lung cancer mortality was observed in France and Turin. Statistically significantly higher UADT cancers mortality rates were found among lower educated women in Switzerland, France and the Nordic countries, even though mortality rates were low. Contrasting situations were found for pancreatic and kidney and bladder cancer. RIIs lower than 1 were found in the Spanish populations and in Slovenia whereas the highest RIIs were observed in the Nordic countries. For the category “other cancers”, the inequalities were remarkably similar: the RII ranged from 1.17 to 1.30 in 10 out of 12 countries.
RIIs among men by population and cancer site are presented in table 3. No statistically significant interaction between education and populations was observed for leukaemia and Hodgkin’s disease, prostate and pancreatic cancer. Mortality rates did not differ by educational level for leukaemia and Hodgkin’s disease and prostate, and we found slightly
Large variations between populations were found for lung, UADT and stomach cancers even though higher mortality rates among lower educated men were found in all populations. Larger RIIs were found in Northern countries and Switzerland for lung cancer; in Slovenia, Switzerland and France for UADT cancers; in the Southern populations for stomach cancer. A contrasting picture was found for liver cancer mortality with no educational differences in mortality in some populations (Belgium, Norway, Slovenia, Basque region) and higher mortality rates among lower educated people in others. Higher rates for low educated men were found for cancer of colorectum, they were slightly higher for cancer of bladder and kidney (RIIs around 1.5).
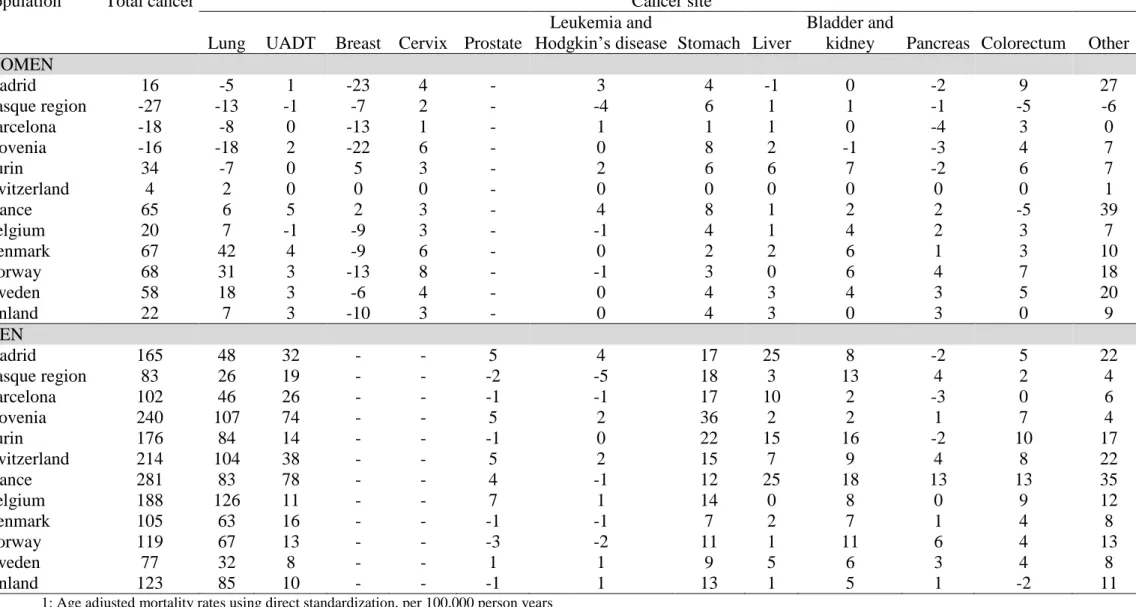
Absolute mortality rate differences by cancer site are presented in table 4. Few cancer sites (lung, UADT and breast) explain most of the European and gender discrepancies. Colorectal and prostate cancers are also frequent but do not explain much of the differences observed in absolute socioeconomic inequalities. Among women, populations with larger excess deaths among lower educated women due to lung cancer are also those where breast cancer mortality is more common among high educated women (Norway, Sweden and Denmark). These populations contrast to the populations where excess deaths among higher educated women are due to both breast and lung cancer (Spanish populations and Slovenia).
Discussion
Educational differences in total cancer mortality were about equally large among women and men in Norway, Sweden and Denmark. In the other countries, inequalities in cancer mortality among women were smaller as compared to men, non-existent in Madrid, Barcelona, Turin and Slovenia, and even reverse in the Basque region. Variations in socioeconomic inequalities in mortality from lung, UADT and breast cancers explained most of the differences between men and women and between European populations.
Evaluation of the data
In France and Switzerland, foreigners were excluded. Migrants have lower cancer mortality rates for most cancer sites, except some sites specific of their native country (nasopharynx, gallbladder or liver (because of exposure to hepatitis B virus)) (Bouchardy et al., 1994; Bouchardy et al., 1996; Bouchardy et al., 1995). As foreigners have generally lower educational levels, their exclusion may have led to some overestimation of socioeconomic inequalities in cancer mortality in France and Switzerland.
Potential influences of national practices in the coding of causes of death should be considered. All data came from populations with reliable cause-of-death registries. Our results would be biased only if diagnosing practices differed by socioeconomic position of the deceased. Even though there is no supporting evidence, such a bias cannot be entirely excluded.
Large variations between populations were observed in the educational distribution. Part of these differences may be due to real differences. Nevertheless, despite the use of a common
We evaluated the sensitivity of the results to alternative educational classifications. We used a classification into 4 educational levels by distinguishing between subjects who completed lower secondary education from those with primary education only. In addition, we applied another classification in which population distributions were as similar as possible between populations. The results were quite robust to these alternative classifications. The RIIs only slightly changed and the relative order of populations did not change. We infer that, even though we could not avoid some misclassification, this is unlikely to have biased the main results.
Comparison to previous studies
Other studies also observed that high-educated men have lower rates of total cancer mortality (Borrell et al., 2003; Davey Smith et al., 1991; Doornbos & Kromhout, 1990; Faggiano et al., 1995; Faggiano et al., 1997; Mackenbach et al., 1999; Menvielle et al., 2005; Michelozzi et al., 1999). The available literature among women was fragmentary, and mainly for Southern Europe countries, and did not consistently report socioeconomic inequalities in total cancer mortality. We found a North-South gradient among women with no inequalities in the South and large inequalities in the Nordic countries.
Our results agree with previous reports on higher cervix cancer mortality rates among women with lower education, and no association between education and mortality for leukaemia and Hodgkin’s disease. No clear association is documented in the literature for pancreatic, kidney and bladder cancer (Davey Smith et al., 1991; Faggiano et al., 1995; Faggiano et al., 1997; Fernandez & Borrell, 1999; Michelozzi et al., 1999; van Loon et al., 1995). However, from our international overview, kidney and bladder cancer have consistently higher mortality rates among lower educated men. Previous studies found contradictory results for colon and rectal cancer (Davey Smith et al., 1991; Faggiano et al., 1995; Faggiano et al., 1997; Fernandez &
Borrell, 1999). However, two American studies observed higher mortality from colorectal cancer among lower socioeconomic groups since the 1980s (Singh et al., 2002; Steenland et al., 2002). We consistently found a similar gradient in European populations in the 1990s, both among men and women.
Interpretation of key findings
We observed large disparities between populations in the difference between men and women in the magnitude of socioeconomic inequalities in total cancer mortality. For instance, this difference is much smaller in Sweden, Norway and Denmark. Compared to other countries, these countries have larger inequalities among women, and smaller inequalities among men. Looking at the situation by cancer sites will give some clues to understand these differences.
Patterns of educational differences in lung cancer mortality strongly differ according to population and gender. This result, already found in previous work (Mackenbach et al., 2004), is confirmed in the present study across a broader set of populations, including France, Slovenia, and the Basque region. The heterogeneity found between populations reflects differences in the diffusion of the smoking epidemic (Lopez et al., 1994). During this diffusion, higher smoking rates are first observed among subjects with higher socioeconomic position but later among subjects with lower socioeconomic position. The smoking epidemic was less advanced in Spain and Slovenia. There, we observed higher tobacco consumption among women with high education but already reverse patterns among men. On the contrary, this epidemic was already at its final stage in Nordic countries, Belgium and Switzerland, with higher tobacco consumption among women and men with low education. France and Italy showed an intermediate situation with no clear association between education and
Belgium than in more southern countries. This is mostly due to the clear north-south contrast observed among women for socioeconomic inequalities in smoking consumption. Thus the gradual diffusion of the smoking epidemic not only underlies international variations in socioeconomic inequalities in lung cancer mortality, but also explains why in southern populations these inequalities are still much larger among men than among women.
Alcohol consumption is likely to be involved in liver and UADT cancers. Socioeconomic inequalities were also observed in most populations among women. However, because of low overall mortality rates, UADT cancers hardly contribute to socioeconomic inequalities in total cancer mortality among women in all populations. We found especially large socioeconomic inequalities favouring high-educated men for these cancers in France and the Spanish populations. The results for men have been described elsewhere (Menvielle et al., 2007). Evidence on socioeconomic inequalities in alcohol consumption is still fragmentary. Nevertheless, data from the literature suggested differences between countries in socioeconomic inequalities in alcohol consumption, especially among men (Cavelaars et al., 1997)(Kunst and Schaap, 2008, personal communication). A north-south contrast was found among men. In Italy and Spain, alcohol consumption was higher among lower educated men whereas in more northern countries, alcohol consumption was higher among high educated men. Among regular drinkers, average alcohol consumption levels were strongly associated with low education among men from southern European countries (Spain, Italy).
Higher breast cancer mortality rates are generally observed among higher educated women. This is mainly due to differences in reproductive behaviour, and especially delayed first birth among women with high education (Braaten et al., 2004; Strand et al., 2005). We found variations between populations in socioeconomic inequalities in breast cancer mortality. The magnitude of relative inequalities did not strongly differ between populations; the magnitude
of absolute inequalities nevertheless substantially differed because of variations in national breast cancer mortality rates. These variations had an effect on inequalities in total cancer mortality among women. In Norway, Sweden and Denmark the “moderating” effect of breast cancer on inequalities in total cancer mortality is not as strong in these countries as in Madrid or Slovenia.
Consistent with literature, we found higher stomach cancer mortality rates among lower educated men and women (Davey Smith et al., 1991; Faggiano et al., 1995; Faggiano et al., 1997; Fernandez & Borrell, 1999; Menvielle et al., 2005; Michelozzi et al., 1999). Among cancers with highers rate among low educated people, stomach cancer is the only one for which inequalities tend to be smaller in the Nordic countries. As Helicobacter Pylori infection at young age is a risk factor for stomach cancer and is likely to be associated with factors linked to living conditions during childhood (Boffetta, 1997), the smaller inequalities in Nordic countries might be due to improved social and sanitary conditions in the past. There is however no evidence to directly support this suggestion. We hypothesize that relevant factors include the active housing policies as well as the more egalitarian social and economic policies developed in Nordic countries since the first half of the 20th century.
Differences between countries in health care access probably also explain part of the differences we observed, especially for cancers with high survival rates. Nevertheless, we did not observe socioeconomic inequalities for leukaemia and Hodgkin’s disease or prostate cancer mortality neither in cancer incidence. As these cancers do not present any socioeconomic inequalities in incidence and have a good prognosis, this result suggests that the contribution of medical care to inequalities in cancer mortality in Western Europe is
Future perspectives
The large geographical and gender variations in the magnitude of socioeconomic inequalities in cancer mortality suggest a large potential for change. Recent studies have suggested smaller educational differences in breast cancer mortality among younger generations of women in many European populations (Martikainen & Valkonen, 2000; Menvielle et al., 2006; Strand et al., 2007). On the other hand, countries in Southern Europe will enter into the last stage of the smoking epidemic, which may finally result in higher lung cancer mortality rates among low educated women in these countries as well. Given these recent trends, variations between countries and between genders in socioeconomic inequalities in cancer mortality are likely to become smaller in the future. Future trends will to a large extent be determined by trends in inequalities in lung, UADT and breast cancers. Policies that may affect these trends, including tobacco control, alcohol policies and breast cancer screening, should ensure that they reach lower groups as well as higher socioeconomic groups.
Funding
G Menvielle received a funding from the Fondation pour la Recherche Médicale for this analysis. The project was in part funded by the European Commission, through the Eurothine project (from the Public Health Program, grant agreement 2003125) and the Eurocadet project (from the commission of the European communities research directorate-general, grant No EUROCADET:SP23-CT-2005-006528).
Acknowledgements
We would like to acknowledge Jean-François Chastang for his help in the analysis of the French dataset.
Table 1: Socio-demographic characteristics, by gender and population
Women Men
Population Follow-up Education (%)1 Education (%)1
Person years
Cancer deaths
Middle/high High Person years Cancer deaths Middle/high High Madrid May-1996/Dec-1997 2,030,998 3,331 24.2 11.7 1,756,059 6,133 35.9 18.5 Basque region May-1996/Jun-2001 3,186,595 5,431 25.4 12.0 2,985,865 11,737 34.4 14.3 Barcelona Jan-1992/Dec-2001 4,489,610 11,450 23.1 13.8 3,714,380 20,253 34.8 19.5 Slovenia Apr-1991/Dec-2000 5,158,738 14,316 43.5 9.1 4,614,864 20,105 62.6 12.4 Turin Nov-1991/Oct-2001 2,611,141 7,837 24.5 6.8 2,611,968 11,294 32.8 10.6 Switzerland Dec-1990/Dec-2000 15,113,931 39,612 60.3 7.2 12,969,989 53,679 80.4 24.3 France Mar-1990/Dec-1999 1,270,981 2,883 37.2 10.0 1,135,299 5,375 49.4 12.7 Belgium Mar-1991/Dec-1995 13,688,568 37,354 32.7 13.9 12,700,788 58,760 38.7 16.8 Denmark Jan-1996/Dec-2000 7,033,258 24,170 49.9 19.9 6,893,032 25,915 59.9 20.1 Norway Nov-1990/Nov-2000 10,424,746 69,894 63.8 16.8 10,021,675 38,722 70.1 21.7 Sweden Jan-1991/Dec-2000 22,116,058 61,446 59.1 19.0 21,421,623 70,339 59.7 16.4 Finland Dec-1990/Dec-2000 13,478,149 32,880 48.6 19.7 12,396,052 39,734 51.2 21.5 1
Graph 1: Total cancer mortality rates1 (per 100000 person years) by education among women
and men, by population
Wo me n 0 1 0 0 2 0 0 3 0 0 4 0 0 5 0 0 6 0 0 7 0 0 Ma d B a s B a r S lo Tu r S w i Fr a B e l De n No r S w e Fin P opula tion M o r ta li ty r a te L o w e r s e c o n d a r y o r le s s Up p e r s e c o n d a r y Po s t- s e c o n d a r y M e n 0 1 0 0 2 0 0 3 0 0 4 0 0 5 0 0 6 0 0 7 0 0 Ma d B a s B a r S lo Tu r S w i Fr a B e l De n No r S w e Fin P opula tion M o r ta li ty r a te L o w e r s e c o n d a r y o r le s s Up p e r s e c o n d a r y Po s t- s e c o n d a r y
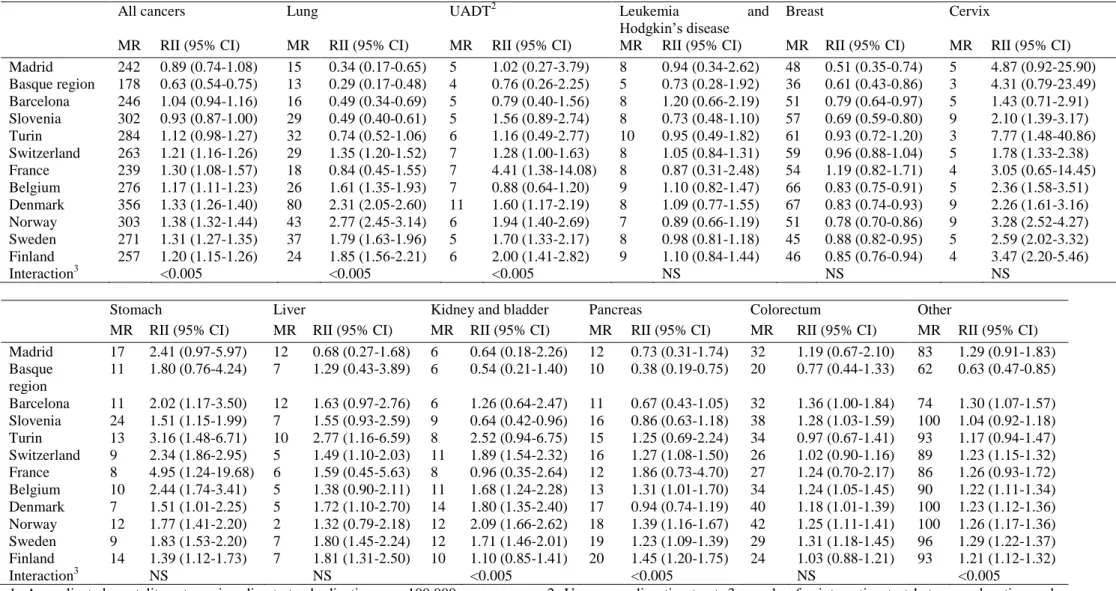
Table 2: Mortality rates1 (MR) and relative indices of inequality (RII) related to education by cancer site among women, by population.
All cancers Lung UADT2 Leukemia and
Hodgkin’s disease
Breast Cervix
MR RII (95% CI) MR RII (95% CI) MR RII (95% CI) MR RII (95% CI) MR RII (95% CI) MR RII (95% CI) Madrid 242 0.89 (0.74-1.08) 15 0.34 (0.17-0.65) 5 1.02 (0.27-3.79) 8 0.94 (0.34-2.62) 48 0.51 (0.35-0.74) 5 4.87 (0.92-25.90) Basque region 178 0.63 (0.54-0.75) 13 0.29 (0.17-0.48) 4 0.76 (0.26-2.25) 5 0.73 (0.28-1.92) 36 0.61 (0.43-0.86) 3 4.31 (0.79-23.49) Barcelona 246 1.04 (0.94-1.16) 16 0.49 (0.34-0.69) 5 0.79 (0.40-1.56) 8 1.20 (0.66-2.19) 51 0.79 (0.64-0.97) 5 1.43 (0.71-2.91) Slovenia 302 0.93 (0.87-1.00) 29 0.49 (0.40-0.61) 5 1.56 (0.89-2.74) 8 0.73 (0.48-1.10) 57 0.69 (0.59-0.80) 9 2.10 (1.39-3.17) Turin 284 1.12 (0.98-1.27) 32 0.74 (0.52-1.06) 6 1.16 (0.49-2.77) 10 0.95 (0.49-1.82) 61 0.93 (0.72-1.20) 3 7.77 (1.48-40.86) Switzerland 263 1.21 (1.16-1.26) 29 1.35 (1.20-1.52) 7 1.28 (1.00-1.63) 8 1.05 (0.84-1.31) 59 0.96 (0.88-1.04) 5 1.78 (1.33-2.38) France 239 1.30 (1.08-1.57) 18 0.84 (0.45-1.55) 7 4.41 (1.38-14.08) 8 0.87 (0.31-2.48) 54 1.19 (0.82-1.71) 4 3.05 (0.65-14.45) Belgium 276 1.17 (1.11-1.23) 26 1.61 (1.35-1.93) 7 0.88 (0.64-1.20) 9 1.10 (0.82-1.47) 66 0.83 (0.75-0.91) 5 2.36 (1.58-3.51) Denmark 356 1.33 (1.26-1.40) 80 2.31 (2.05-2.60) 11 1.60 (1.17-2.19) 8 1.09 (0.77-1.55) 67 0.83 (0.74-0.93) 9 2.26 (1.61-3.16) Norway 303 1.38 (1.32-1.44) 43 2.77 (2.45-3.14) 6 1.94 (1.40-2.69) 7 0.89 (0.66-1.19) 51 0.78 (0.70-0.86) 9 3.28 (2.52-4.27) Sweden 271 1.31 (1.27-1.35) 37 1.79 (1.63-1.96) 5 1.70 (1.33-2.17) 8 0.98 (0.81-1.18) 45 0.88 (0.82-0.95) 5 2.59 (2.02-3.32) Finland 257 1.20 (1.15-1.26) 24 1.85 (1.56-2.21) 6 2.00 (1.41-2.82) 9 1.10 (0.84-1.44) 46 0.85 (0.76-0.94) 4 3.47 (2.20-5.46) Interaction3 <0.005 <0.005 <0.005 NS NS NS
Stomach Liver Kidney and bladder Pancreas Colorectum Other
MR RII (95% CI) MR RII (95% CI) MR RII (95% CI) MR RII (95% CI) MR RII (95% CI) MR RII (95% CI) Madrid 17 2.41 (0.97-5.97) 12 0.68 (0.27-1.68) 6 0.64 (0.18-2.26) 12 0.73 (0.31-1.74) 32 1.19 (0.67-2.10) 83 1.29 (0.91-1.83) Basque region 11 1.80 (0.76-4.24) 7 1.29 (0.43-3.89) 6 0.54 (0.21-1.40) 10 0.38 (0.19-0.75) 20 0.77 (0.44-1.33) 62 0.63 (0.47-0.85) Barcelona 11 2.02 (1.17-3.50) 12 1.63 (0.97-2.76) 6 1.26 (0.64-2.47) 11 0.67 (0.43-1.05) 32 1.36 (1.00-1.84) 74 1.30 (1.07-1.57) Slovenia 24 1.51 (1.15-1.99) 7 1.55 (0.93-2.59) 9 0.64 (0.42-0.96) 16 0.86 (0.63-1.18) 38 1.28 (1.03-1.59) 100 1.04 (0.92-1.18) Turin 13 3.16 (1.48-6.71) 10 2.77 (1.16-6.59) 8 2.52 (0.94-6.75) 15 1.25 (0.69-2.24) 34 0.97 (0.67-1.41) 93 1.17 (0.94-1.47) Switzerland 9 2.34 (1.86-2.95) 5 1.49 (1.10-2.03) 11 1.89 (1.54-2.32) 16 1.27 (1.08-1.50) 26 1.02 (0.90-1.16) 89 1.23 (1.15-1.32) France 8 4.95 (1.24-19.68) 6 1.59 (0.45-5.63) 8 0.96 (0.35-2.64) 12 1.86 (0.73-4.70) 27 1.24 (0.70-2.17) 86 1.26 (0.93-1.72) Belgium 10 2.44 (1.74-3.41) 5 1.38 (0.90-2.11) 11 1.68 (1.24-2.28) 13 1.31 (1.01-1.70) 34 1.24 (1.05-1.45) 90 1.22 (1.11-1.34) Denmark 7 1.51 (1.01-2.25) 5 1.72 (1.10-2.70) 14 1.80 (1.35-2.40) 17 0.94 (0.74-1.19) 40 1.18 (1.01-1.39) 100 1.23 (1.12-1.36) Norway 12 1.77 (1.41-2.20) 2 1.32 (0.79-2.18) 12 2.09 (1.66-2.62) 18 1.39 (1.16-1.67) 42 1.25 (1.11-1.41) 100 1.26 (1.17-1.36) Sweden 9 1.83 (1.53-2.20) 7 1.80 (1.45-2.24) 12 1.71 (1.46-2.01) 19 1.23 (1.09-1.39) 29 1.31 (1.18-1.45) 96 1.29 (1.22-1.37) Finland 14 1.39 (1.12-1.73) 7 1.81 (1.31-2.50) 10 1.10 (0.85-1.41) 20 1.45 (1.20-1.75) 24 1.03 (0.88-1.21) 93 1.21 (1.12-1.32) Interaction3 NS NS <0.005 <0.005 NS <0.005
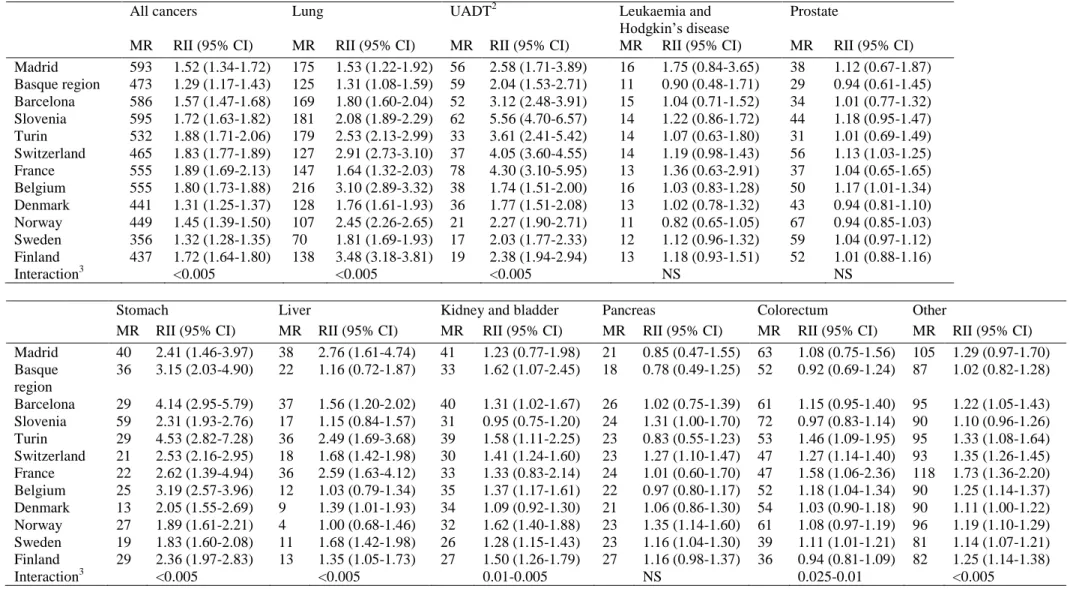
Table 3: Mortality rates1 (MR) and relative indices of inequality (RII) related to education by cancer site among men, by population.
All cancers Lung UADT2 Leukaemia and
Hodgkin’s disease
Prostate
MR RII (95% CI) MR RII (95% CI) MR RII (95% CI) MR RII (95% CI) MR RII (95% CI) Madrid 593 1.52 (1.34-1.72) 175 1.53 (1.22-1.92) 56 2.58 (1.71-3.89) 16 1.75 (0.84-3.65) 38 1.12 (0.67-1.87) Basque region 473 1.29 (1.17-1.43) 125 1.31 (1.08-1.59) 59 2.04 (1.53-2.71) 11 0.90 (0.48-1.71) 29 0.94 (0.61-1.45) Barcelona 586 1.57 (1.47-1.68) 169 1.80 (1.60-2.04) 52 3.12 (2.48-3.91) 15 1.04 (0.71-1.52) 34 1.01 (0.77-1.32) Slovenia 595 1.72 (1.63-1.82) 181 2.08 (1.89-2.29) 62 5.56 (4.70-6.57) 14 1.22 (0.86-1.72) 44 1.18 (0.95-1.47) Turin 532 1.88 (1.71-2.06) 179 2.53 (2.13-2.99) 33 3.61 (2.41-5.42) 14 1.07 (0.63-1.80) 31 1.01 (0.69-1.49) Switzerland 465 1.83 (1.77-1.89) 127 2.91 (2.73-3.10) 37 4.05 (3.60-4.55) 14 1.19 (0.98-1.43) 56 1.13 (1.03-1.25) France 555 1.89 (1.69-2.13) 147 1.64 (1.32-2.03) 78 4.30 (3.10-5.95) 13 1.36 (0.63-2.91) 37 1.04 (0.65-1.65) Belgium 555 1.80 (1.73-1.88) 216 3.10 (2.89-3.32) 38 1.74 (1.51-2.00) 16 1.03 (0.83-1.28) 50 1.17 (1.01-1.34) Denmark 441 1.31 (1.25-1.37) 128 1.76 (1.61-1.93) 36 1.77 (1.51-2.08) 13 1.02 (0.78-1.32) 43 0.94 (0.81-1.10) Norway 449 1.45 (1.39-1.50) 107 2.45 (2.26-2.65) 21 2.27 (1.90-2.71) 11 0.82 (0.65-1.05) 67 0.94 (0.85-1.03) Sweden 356 1.32 (1.28-1.35) 70 1.81 (1.69-1.93) 17 2.03 (1.77-2.33) 12 1.12 (0.96-1.32) 59 1.04 (0.97-1.12) Finland 437 1.72 (1.64-1.80) 138 3.48 (3.18-3.81) 19 2.38 (1.94-2.94) 13 1.18 (0.93-1.51) 52 1.01 (0.88-1.16) Interaction3 <0.005 <0.005 <0.005 NS NS
Stomach Liver Kidney and bladder Pancreas Colorectum Other
MR RII (95% CI) MR RII (95% CI) MR RII (95% CI) MR RII (95% CI) MR RII (95% CI) MR RII (95% CI) Madrid 40 2.41 (1.46-3.97) 38 2.76 (1.61-4.74) 41 1.23 (0.77-1.98) 21 0.85 (0.47-1.55) 63 1.08 (0.75-1.56) 105 1.29 (0.97-1.70) Basque region 36 3.15 (2.03-4.90) 22 1.16 (0.72-1.87) 33 1.62 (1.07-2.45) 18 0.78 (0.49-1.25) 52 0.92 (0.69-1.24) 87 1.02 (0.82-1.28) Barcelona 29 4.14 (2.95-5.79) 37 1.56 (1.20-2.02) 40 1.31 (1.02-1.67) 26 1.02 (0.75-1.39) 61 1.15 (0.95-1.40) 95 1.22 (1.05-1.43) Slovenia 59 2.31 (1.93-2.76) 17 1.15 (0.84-1.57) 31 0.95 (0.75-1.20) 24 1.31 (1.00-1.70) 72 0.97 (0.83-1.14) 90 1.10 (0.96-1.26) Turin 29 4.53 (2.82-7.28) 36 2.49 (1.69-3.68) 39 1.58 (1.11-2.25) 23 0.83 (0.55-1.23) 53 1.46 (1.09-1.95) 95 1.33 (1.08-1.64) Switzerland 21 2.53 (2.16-2.95) 18 1.68 (1.42-1.98) 30 1.41 (1.24-1.60) 23 1.27 (1.10-1.47) 47 1.27 (1.14-1.40) 93 1.35 (1.26-1.45) France 22 2.62 (1.39-4.94) 36 2.59 (1.63-4.12) 33 1.33 (0.83-2.14) 24 1.01 (0.60-1.70) 47 1.58 (1.06-2.36) 118 1.73 (1.36-2.20) Belgium 25 3.19 (2.57-3.96) 12 1.03 (0.79-1.34) 35 1.37 (1.17-1.61) 22 0.97 (0.80-1.17) 52 1.18 (1.04-1.34) 90 1.25 (1.14-1.37) Denmark 13 2.05 (1.55-2.69) 9 1.39 (1.01-1.93) 34 1.09 (0.92-1.30) 21 1.06 (0.86-1.30) 54 1.03 (0.90-1.18) 90 1.11 (1.00-1.22) Norway 27 1.89 (1.61-2.21) 4 1.00 (0.68-1.46) 32 1.62 (1.40-1.88) 23 1.35 (1.14-1.60) 61 1.08 (0.97-1.19) 96 1.19 (1.10-1.29) Sweden 19 1.83 (1.60-2.08) 11 1.68 (1.42-1.98) 26 1.28 (1.15-1.43) 23 1.16 (1.04-1.30) 39 1.11 (1.01-1.21) 81 1.14 (1.07-1.21) Finland 29 2.36 (1.97-2.83) 13 1.35 (1.05-1.73) 27 1.50 (1.26-1.79) 27 1.16 (0.98-1.37) 36 0.94 (0.81-1.09) 82 1.25 (1.14-1.38) Interaction3 <0.005 <0.005 0.01-0.005 NS 0.025-0.01 <0.005
1: Age adjusted mortality rates using direct standardization, per 100,000 person years, 2: Upper aerodigestive tract, 3: p-value for interaction test between education and population
Table 4: Mortality rate1 differencebetween subjects with lower secondary education or less and subjects with post-secondary education for total
cancer mortality and by cancer site, per gender and population
Population Total cancer Cancer site
Lung UADT Breast Cervix Prostate
Leukemia and
Hodgkin’s disease Stomach Liver
Bladder and
kidney Pancreas Colorectum Other WOMEN Madrid 16 -5 1 -23 4 - 3 4 -1 0 -2 9 27 Basque region -27 -13 -1 -7 2 - -4 6 1 1 -1 -5 -6 Barcelona -18 -8 0 -13 1 - 1 1 1 0 -4 3 0 Slovenia -16 -18 2 -22 6 - 0 8 2 -1 -3 4 7 Turin 34 -7 0 5 3 - 2 6 6 7 -2 6 7 Switzerland 4 2 0 0 0 - 0 0 0 0 0 0 1 France 65 6 5 2 3 - 4 8 1 2 2 -5 39 Belgium 20 7 -1 -9 3 - -1 4 1 4 2 3 7 Denmark 67 42 4 -9 6 - 0 2 2 6 1 3 10 Norway 68 31 3 -13 8 - -1 3 0 6 4 7 18 Sweden 58 18 3 -6 4 - 0 4 3 4 3 5 20 Finland 22 7 3 -10 3 - 0 4 3 0 3 0 9 MEN Madrid 165 48 32 - - 5 4 17 25 8 -2 5 22 Basque region 83 26 19 - - -2 -5 18 3 13 4 2 4 Barcelona 102 46 26 - - -1 -1 17 10 2 -3 0 6 Slovenia 240 107 74 - - 5 2 36 2 2 1 7 4 Turin 176 84 14 - - -1 0 22 15 16 -2 10 17 Switzerland 214 104 38 - - 5 2 15 7 9 4 8 22 France 281 83 78 - - 4 -1 12 25 18 13 13 35 Belgium 188 126 11 - - 7 1 14 0 8 0 9 12 Denmark 105 63 16 - - -1 -1 7 2 7 1 4 8
References
Boffetta, P. (1997). Infection with Helicobacter pylori and parasites, social class and cancer. IARC Sci Publ, 138, 325-329.
Borrell, C., Cortes, I., Artazcoz, L., Molinero, E. & Moncada, S. (2003). Social inequalities in mortality in a retrospective cohort of civil servants in Barcelona. Int J Epidemiol, 32, 386-389.
Borrell, C., Regidor, E., Arias, L.C., Navarro, P., Puigpinos, R., Dominguez, V. & Plasencia, A. (1999). Inequalities in mortality according to educational level in two large Southern European cities. Int J Epidemiol, 28, 58-63.
Bouchardy, C., Parkin, D.M. & Khlat, M. (1994). Cancer mortality among Chinese and South-East Asian migrants in France. Int J Cancer, 58, 638-643.
Bouchardy, C., Parkin, D.M., Wanner, P. & Khlat, M. (1996). Cancer mortality among north African migrants in France. Int J Epidemiol, 25, 5-13.
Bouchardy, C., Wanner, P. & Parkin, D.M. (1995). Cancer mortality among sub-Saharan African migrants in France. Cancer Causes Control, 6, 539-544.
Braaten, T., Weiderpass, E., Kumle, M., Adami, H.O. & Lund, E. (2004). Education and risk of breast cancer in the Norwegian-Swedish women's lifestyle and health cohort study. Int J Cancer, 110, 579-583.
Bucher, H.C. & Ragland, D.R. (1995). Socioeconomic indicators and mortality from coronary heart disease and cancer: a 22-year follow-up of middle-aged men. Am J Public Health, 85, 1231-1236.
Cavelaars, A.E., Kunst, A.E. & Mackenbach, J.P. (1997). Socioeconomic differences in risk factors for morbidity and mortality in the European Community: an international comparison. Journal of Health Psychology, 2, 353-372.
Davey Smith, G., Leon, D., Shipley, M.J. & Rose, G. (1991). Socioeconomic differentials in cancer among men. Int J Epidemiol, 20, 339-345.
Doornbos, G. & Kromhout, D. (1990). Educational level and mortality in a 32-year follow-up study of 18-year-old men in The Netherlands. Int J Epidemiol, 19, 374-379.
Faggiano, F., Lemma, P., Costa, G., Gnavi, R. & Pagnanelli, F. (1995). Cancer mortality by educational level in Italy. Cancer Causes Control, 6, 311-320.
Faggiano, F., Partanen, T., Kogevinas, M. & Boffetta, P. (1997). Socioeconomic differences in cancer incidence and mortality. IARC Sci Publ, 138, 65-176.
Fernandez, E. & Borrell, C. (1999). Cancer mortality by educational level in the city of Barcelona. Br J Cancer, 79, 684-689.
Giskes, K., Kunst, A.E., Benach, J., Borrell, C., Costa, G., Dahl, E., Dalstra, J.A., Federico, B., Helmert, U., Judge, K., Lahelma, E., Moussa, K., Ostergren, P.O., Platt, S., Prattala, R., Rasmussen, N.K. & Mackenbach, J.P. (2005). Trends in smoking behaviour between 1985 and 2000 in nine European countries by education. J Epidemiol Community Health, 59, 395-401.
Harding, S. (1995). Social class differences in mortality of men: recent evidence from the OPCS Longitudinal Study. Office of Population Censuses and Surveys. Popul Trends, 31-37.
Huisman, M., Kunst, A.E. & Mackenbach, J.P. (2005). Educational inequalities in smoking among men and women aged 16 years and older in 11 European countries. Tob Control, 14, 106-13.
Lopez, A.D., NE, C. & T, P. (1994). A descriptive model of the cigarette epidemic in developed countries. Tob Control, 3, 242-247.
Mackenbach, J.P., Huisman, M., Andersen, O., Bopp, M., Borgan, J.K., Borrell, C., Costa, G., Deboosere, P., Donkin, A., Gadeyne, S., Minder, C., Regidor, E., Spadea, T.,
Valkonen, T. & Kunst, A.E. (2004). Inequalities in lung cancer mortality by the educational level in 10 European populations. Eur J Cancer, 40, 126-135.
Mackenbach, J.P. & Kunst, A.E. (1997). Measuring the magnitude of socio-economic inequalities in health: an overview of available measures illustrated with two examples from Europe. Soc Sci Med, 44, 757-771.
Mackenbach, J.P., Kunst, A.E., Groenhof, F., Borgan, J.K., Costa, G., Faggiano, F., Jozan, P., Leinsalu, M., Martikainen, P., Rychtarikova, J. & Valkonen, T. (1999). Socioeconomic inequalities in mortality among women and among men: an international study. Am J Public Health, 89, 1800-1806.
Martikainen, P. & Valkonen, T. (2000). Diminishing educational differences in breast cancer mortality among Finnish women: a register-based 25-year follow-up. Am J Public Health, 90, 277-280.
Menvielle, G., Kunst, A.E., Stirbu, I., Borrell, C., Bopp, M., Regidor, E., Heine Strand, B., Deboosere, P., Lundberg, O., Leclerc, A., Costa, G., Chastang, J.F., Esnaola, S., Martikainen, P. & Mackenbach, J.P. (2007). Socioeconomic inequalities in alcohol related cancer mortality among men: to what extent do they differ between Western European populations? Int J Cancer, 121, 649-55.
Menvielle, G., Leclerc, A., Chastang, J.F., Luce, D. & Edisc group. (2006). Social inequalities in breast cancer mortality among French women: disappearing educational disparities from 1968 to 1996. Br J Cancer, 94, 152-5.
Menvielle, G., Luce, D., Geoffroy-Perez, B., Chastang, J.F., Leclerc, A. & Edisc group. (2005). Social inequalities and cancer mortality in France. 1975-1990. Cancer Causes Control, 16, 501-513.
Michelozzi, P., Perucci, C.A., Forastiere, F., Fusco, D., Ancona, C. & Dell'Orco, V. (1999). Inequality in health: socioeconomic differentials in mortality in Rome, 1990-95. J Epidemiol Community Health, 53, 687-693.
Pamuk, E. (1985). Social class inequality in mortality from 1921 to 1972 in England and Wales. Popul Stud, 39, 17-31.
Singh, G.K., Miller, B.A. & Hankey, B.F. (2002). Changing area socioeconomic patterns in U.S. cancer mortality, 1950-1998: Part II--Lung and colorectal cancers. J Natl Cancer Inst, 94, 916-925.
Steenland, K., Henley, J. & Thun, M. (2002). All-cause and cause-specific death rates by educational status for two million people in two American Cancer Society cohorts, 1959-1996. Am J Epidemiol, 156, 11-21.
Steenland, K., Hu, S. & Walker, J. (2004). All-cause and cause-specific mortality by socioeconomic status among employed persons in 27 US states, 1984-1997. Am J Public Health, 94, 1037-1042.
Strand, B.H., Kunst, A., Huisman, M., Menvielle, G., Glickman, M., Bopp, M., Borell, C., Borgan, J.K., Costa, G., Deboosere, P., Regidor, E., Valkonen, T. & Mackenbach, J.P. (2007). The reversed social gradient: higher breast cancer mortality in the higher educated compared to lower educated. A comparison of 11 European populations during the 1990s. Eur J Cancer, 43, 1200-7.
Strand, B.H., Tverdal, A., Claussen, B. & Zahl, P.H. (2005). Is birth history the key to highly educated women's higher breast cancer mortality? A follow-up study of 500,000 women aged 35-54. Int J Cancer, 117, 1002-6.
van Loon, A.J., Brug, J., Goldbohm, R.A., van den Brandt, P.A. & Burg, J. (1995). Differences in cancer incidence and mortality among socio-economic groups. Scand J