Bioelectrical Strategies for Image-Guided Therapies
by Maya E. Barley
B.S. Electrical Engineering
Rice University, 2001
M.S. Electrical Engineering
Massachusetts Institute of Technology, 2003
SUBMITTED TO THE HARVARD-MIT DIVISION OF HEALTH SCIENCES AND
TECHNOLOGY IN PARTIAL FULFILLMENT OF THE REQURIEMENTS FOR THE
DEGREE OF
DOCTOR OF PHILOSOPHY IN MEDICAL ENGINEERING
AT THE
MASSACHUSETTS INSTITUTE OF TECHNOLOGY
MAY 2007
C 2007 Maya E Barley. All rights reserved.
The author hereby grants to MIT permission to reproduce and to distribute publicly paper and
electronic copies of this thesis document in whole or in part.
Signature of Author:
Certified by:
Accepted by:
MASSACHUSETTS INSTI1fITE OF TECHNOLOGYJUL 13 2007
-4arvard-MflT
Divisiel of
Iidfh Sciences a4 Technology
,[.ay 1 7th, 2007Dr. Richard J. Cohen, MD, Ph.D.
Whitaker Professor in Biomedical Engineering
Harvard-MIT Division of Health Sciences and Technology
, .'.Thesis Supervisor
Martha L. Gray, Ph.D.
Edward Hood Taplin Prof ssor of Medical and Electrical Engineering
Co-Director, Harvard-MIT Division of Health Sciences and Technology
Contents
Abstract
Acknowledgements
1. INTRODUCTION
...
6
1.1 Cardiac Arrhythmias... 7
1.2 Current Treatments for Ventricular Tachycardia... 8
1.3 The Radio-Frequency Ablation Procedure... 10
1.4 Current Mapping Technologies...10
1.5 The Need for a New Technology ... 16
2. A NEW MAPPING TECHNOLOGY...18
2.1 The Inverse Solution Guidance Algorithm ... 18
2.2 The Bioelectrical Image Guidance (BIG) Method... 22
2.3 Thesis Overview ... 26
3. DEVELOPMENT OF THE INVERSE SOLUTION GUIDANCE ALGORITHM 28
3.1 Enhancement of Algorithm Performance ... 283.2 The Effect of Dipole Orientation... 29
3.3 A Method to Compensate for the Effect of Dipole Orientation... 34
4. DEMONSTRATION OF THE INVERSE SOLUTION GUIDANCE
ALGORITHM IN A PHANTOM MODEL
...
50
4.1 Introduction... 50
4.2 M ethods... 51
4.3 R esults ... 56
4.4. Discussion... 61
5. SOFTWARE AND USER INTERFACE FOR THE IN-VIVO
IMPLEMENTATION OF ISGA
...
63
5.2 The Pace Mapping Method ... 63
5.3 In-vivo Experimental Procedure ... 64
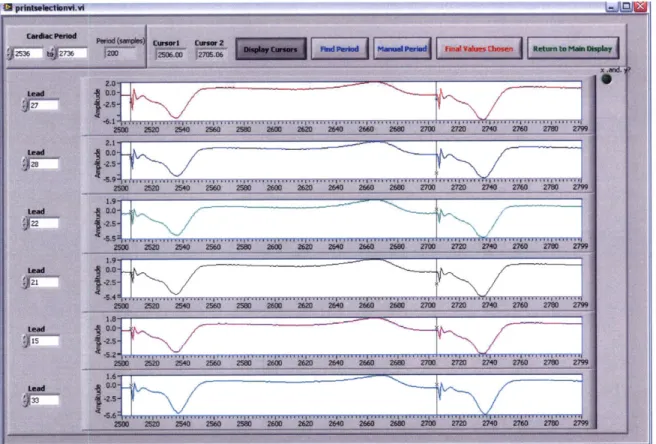
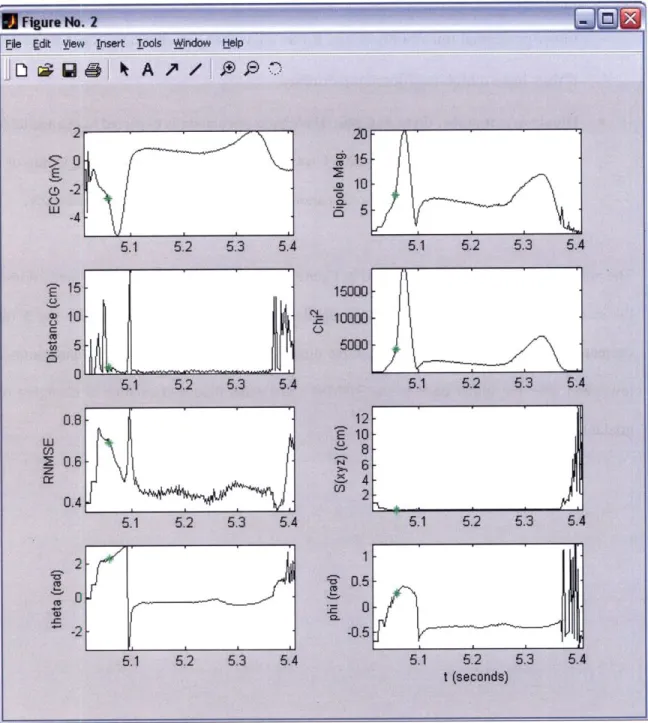
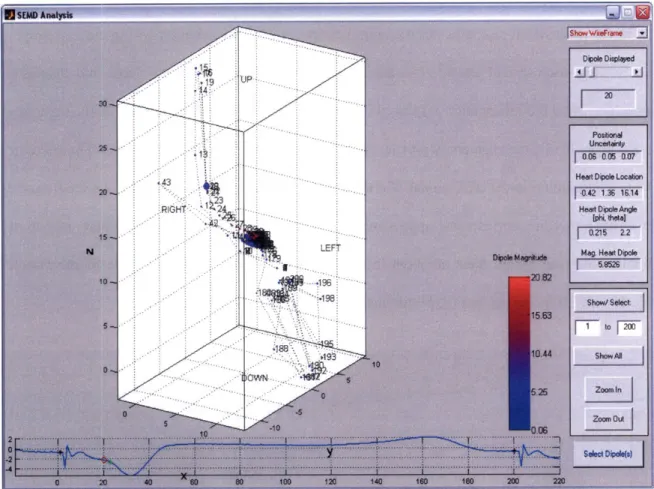
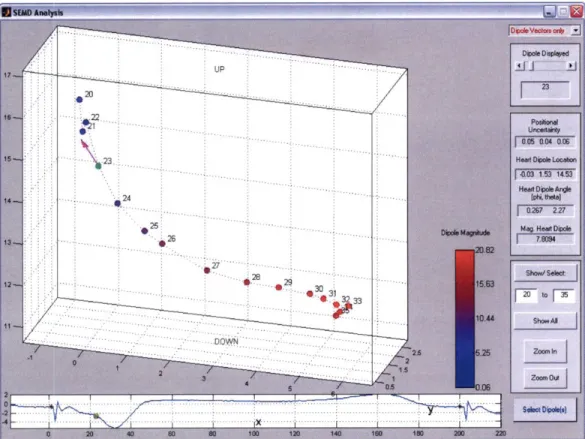
5.4 Software Use Case... 66
5.5 Software Implementation ... 69
5.6 Program Flow Diagram... 100
5.7 Summary... 104
6. DEVELOPMENT OF THE BIO-ELECTRICAL IMAGE GUIDANCE (BIG)
M ETHO D ...
105
6.1 Implementation of the BIG Method ... 105
6.2 Assessment of Current Flow Model Accuracy... 110
6.3 Assessment of the Significance of Tissue Anisotropy... 113
6.4 In-silico Assessment of the BIG Method ... 118
6.5 Conclusion... 128
7. APPLICATION OF THE BIG METHOD TO BREAST BIOPSY GUIDANCE 129
7.1 Background... 1297.2 Methods... 130
7.3 Results ... 136
7.4 Discussion... 141
7.5 Conclusion... 143
8. SUM MARY AND FUTURE DIRECTION
...
145
8.1 Thesis Summary... 145
8.2 Future Direction... 146
8.3 The Future of the BIG Method and ISGA... 150
Abstract
There is a pressing need in minimally-invasive surgery for novel imaging methods that can rapidly and accurately localize the surgical instrument and its target. We have developed two novel localization methods for the guidance of cardiac ablation and other minimally-invasive therapies. The first method, the Inverse Solution Guidance Algorithm (ISGA), is for the non-invasive and rapid localization of the site of origin of an arrhythmia and an ablation catheter tip from body-surface ECG signals. We have substantially developed ISGA to provide accurate catheter guidance even in the presence of significant electrical inhomogeneities, and we have evaluated the method in numerical simulations and phantom studies. Due to the rapidity of arrhythmic origin localization, ISGA may prove a highly effective means of guiding the ablative therapy of hemodynamically-unstable VT.
The second method, the Bioelectrical Image Guidance (BIG) Method, is a novel algorithm for the accurate and inexpensive guidance of a wide-range of minimally-invasive surgeries, from cardiac ablation to breast cancer biopsy. The surgical instrument is localized within a detailed 3-D MRI or CT image by applying currents to the body surface and comparing the potentials measured at the instrument tip with potential distributions simulated prior to the surgery. We have developed and evaluated this method in numerical simulations. We have also built an experimental guidance system and tested it in a phantom model. Our results indicate that the BIG Method may one day provide an accurate and convenient means by which to guide minimally-invasive surgery within a highly detailed anatomical image.
Acknowledgments
This PhD has been a tremendous journey; it is incredible to look back on six years of my life and to see how much it has changed. I wish to thank Dr. Richard Cohen for his support as my advisor, for the way he has shaped my way of thinking, for pushing me, and for teaching me how to bring a device concept from "bench to bedside". I also wish to thank my thesis committee members, Dr. Roger Mark, Dr. Jagmeet Singh and Dr. George Verghese, who have advised and guided me for the last year and a half.
I have had the opportunity to work with Dr. Gordon Hirschman, Dr. Anna Galea, and
Kristen Choppy of Infoscitex Corporation for almost two years now, and have delighted in the teamwork and camaraderie. We have been through the trenches together, and I shall not forget the experience!
I also wish to thank members of the Cohen Lab, past and present. Dr. Antonis
Armoundas, Dr. Grace Xiao, and Dr. Tamara Rosbury, have guided me and I have followed gladly in their steps. I will always treasure the memory of Dr. Yuri Chernyak, whose rigorous style and feedback have led to the presentation skills I have today. Amy Donovan has been a bastion of strength and spirit for me in the last six years. And last but not least, the current members of the Cohen Lab, Tatsuya Arai, Dr. Kichang Lee, Wener Lv, Danilo Scepanovic, Dr. Evgeny Terovanesyan, and Candance Weaver, have motivated me with their intelligence and character.
My nearest and dearest friends, Brinda, Megan, Adam, and Cherif have supported me
through the toughest times. My parents-in-law, Ellen and Michel, and brother-in-law, Simon, have given me unconditional love and advice, and have inspired me with their openness, enthusiasm and love of life. I have delighted in getting closer to my sister, Shanta, over the last few years, and am amazed by the unstoppable young woman she has become. As I near the end of my formal education, I think back to everything my parents have given me and continue to give me. They have put nothing ahead of giving their daughters the best, and without their encouragement and love I would not be where I am now.
I dedicate this thesis to my husband, Adrien, who I met upon entering the HST program and has truly been the best part of the last six years. Adrien has such integrity, patience, understanding, and energy, and such a beautiful view of life. His love, support and friendship have made me what I am today as we finish this stage of our lives and move on to the next.
1. Introduction
Minimally-invasive diagnosis and surgery has been the dream of physicians since the age of Hippocrates. Reflected light was used to visualize the cervix by the end of the first millennium A.D., and a method to focus and project sunlight into body cavities was invented by Tulio Aranzi in 1585. However, the field of minimally-invasive treatment as we consider it today was born in 1804, with the invention of the first light-guiding instrument by Philipp Bozzini. Physicians could now look inside the living body in ways never before possible [I]. The last century has seen the invention of revolutionary imaging technologies such as x-ray [2], sonar [3] and tomography [4, 5], exposing areas of the body that would otherwise be impossible to see without a scalpel. In the 2 1 "
century, minimally-invasive surgery allows diagnosis and treatment with a minimum of the pain, disability and morbidity that were once more frequently due to the surgical procedure than the treatment itself [6]. Minimally-invasive techniques are now used in many specialities including general, thoracic and cardiac surgery.
Satisfactory visualization of surgical instruments in relation to their target has often been the rate-limiting step in the development of minimally-invasive treatments. Imaging is especially important for intracardiac procedures: valve replacement, leaflet repair and arrhythmia treatment require precise guidance of surgical instruments in a critical organ concealed beneath layers of rib and muscle. Currently, many intracardiac procedures are done under x-ray, ultrasound or MRI guidance. However, x-ray and fluoroscopy expose the patient and surgeon to significant radiation
[7]. Furthermore, the surgeon must capture "snap-shots" of the surgical site since the
carcinogenic potential of ionizing radiation does not allow for real-time monitoring of the instrument location,. While sonographic imaging can be done continuously, and excellent 3-D ultrasound images of cardiac structures and breast tumors have been demonstrated, image reconstruction cannot be done in real-time, and therefore this is not yet a viable guidance technology [8]. While MRI guidance can be done in real-time, these procedures are highly
expensive and are limited to hospitals and clinics with the necessary resources. MRI imaging equipment is also bulky and unwieldy, and special surgical instruments must be used due to the large magnetic fields [9].
A surgical guidance system with 3-D imaging capability, high accuracy, real-time
monitoring potential, safety, and low cost therefore remains unrealized for many surgical procedures. This thesis concerns the development of two promising technologies for the guidance of surgical instruments, principally in the field of cardiac arrhythmia treatment. Through these imaging technologies, we hope to bring life-saving minimally-invasive treatment to a much wider patient population and with a greater accuracy than previously possible.
1.1 Cardiac Arrhythmias
Cardiovascular disease is the most prominent cause of morbidity in the developed world. In the US alone, approximately 465,000 people die each year from heart disease [10]. Many of these deaths are sudden - specific estimates range from 36% to as high as 65% [10, 11] - and are presumed to be caused by ventricular tachycardia (VT) and/or fibrillation. Non-ischemic dilated cardiomyopathy, hypertrophic cardiomyopathy, valvular disease, regional autonomic dysfunction [12], congenital heart disease and primary electrophysiological abnormalities (such as Wolff-Parkinson-White Syndrome) are all contexts for ventricular tachyarrhythmias. However, the majority of patients in the U.S. experiencing VT have underlying coronary artery disease [13]. The most common etiology of VT in the presence of infarcted tissue is the formation of a re-entrant circuit, in which electrical activity circulates rapidly through and around a zone of infarction, creating a self-sustaining cycle of abnormal impulse conduction [14].
Figure 1.1 shows a theoretic reentrant circuit originating from a chronic infarct. A normal sinus rhythm beat, sweeping through the myocardium to depolarize the entire ventricle, encounters the entrance site of the reentrant circuit. If the circuit 'captures' during this QRS complex, the entrance to the scar region is also activated and a wavefront propagates slowly through the scar tissue. At the exit point, it emerges from the infarct region into normal tissue. If the conduction time from entrance to exit within the scar exceeds the refractory period of the functioning myocardium, this will cause the onset of a second QRS complex. To complete the circuit, the wave of depolarization propagates either along the border of the scar or through the scar itself, until it once again reaches the exit site. If the speed of conduction is very fast, a rapidly circulating wavefront or 'circus rhythm' is initiated and ventricular tachycardia results.
CP OUM
Outer Loop ORS
onet
Figure 1.1: Reentrant Circuit around an infarct scar [27]
1.2 Current Treatments for Ventricular Tachycardia
There are several options currently available for the treatment of VT. Antiarrhythmic drugs alter the electrophysiological properties of the re-entrant circuit, suppressing potential triggers for the development of VT [15]. However, as demonstrated by the Cardiac Arrhythmia
Suppression Trial (CAST), antiarrhythmic drug use may actually predispose a patient to lethal ventricular arrhythmias if a transient risk event such as ischemia occurs [16]. Only Amiodarone and beta-blockers have been shown to generally decrease the risk of sudden death in the post-MI patient.
Implantable cardioverter defibrillators (ICDs) are currently used to administer anti-tachycardia pacing that will terminate most monomorphic VTs, and electrical cardioversion if necessary. During cardioversion, a single high-energy pulse of current is administered to the heart, 'resetting' the cycle of electrical activity; it is hoped that once the tissue is uniformly de-polarized, normal sinus rhythm will resume. The Multicenter Automatic Defibrillator Implantation Trial (MADIT) studies demonstrated that prophylactic ICD therapy leads to significantly improved survival in patients at a high risk for sudden cardiac death [17]. However,
ICD implantation and maintenance is expensive; the MADIT study found the average cost to be $27,000 per patient [18]. Lastly, although ICDs extend survival, they only treat arrhythmias when
they occur and do not prevent recurrences [19]. A form of preventive treatment is highly desirable for cases in which the VT is persistent.
The most recently developed procedure for the treatment of arrhythmias is radio-frequency ablation (RFA) [20, 21]. It involves the guidance of an ablation catheter to the site of the reentrant circuit, and the administration of high-intensity radio-frequency current to the tissue to 'break' the circuit. If the site has been accurately identified and ablated, the necrotic tissue that remains will transect the isthmus of the circuit. The arrhythmia will then be non-inducible. In stable ventricular tachycardia patients without structural disease, this treatment is often used to lessen the number of ICD therapies that are administered to patients. In one study [22], the total number of ICD therapies in 21 patients with any VT decreased from 59.3 ± 79.7 per month before ablation, to 0.6 ± 1.1 per month after successful ablation; this represents a 99.8% reduction in defibrillator therapies. These patients reported a significant improvement in quality-of-life.
1.3 The Radio-Frequency Ablation Procedure
At the beginning of the procedure, ablation and electrode catheters are inserted into either a femoral artery or vein, depending on the location of the arrhythmic site suggested by the morphology of the VT, and advanced into the heart. The catheter positions are monitored with biplanar fluoroscopy (a 2-D imaging technique allowing 'real-time' x-ray), with 300 right anterior oblique and 60* left anterior oblique projections. To remove positional changes due to heart motion, the fluoroscopic images are usually R-wave gated. Throughout the procedure, the patient is administered 1000 units/hour of intravenous heparin to prevent coagulation and thrombus formation around the catheters.
The re-entrant circuit is located using one of the endocardial mapping techniques described in Section 1.4. The ablation catheter is guided to the location and ablative energy is delivered. While the diameter of ablation lesions may vary from approximately 5 mm to over 8 mm [23], only the lesion's central core is necrotic and will not heal after the procedure [24]. Therefore, the catheter should ideally be guided within 2-3 millimeters of the exit site for long-term success of the procedure.
1.4 Current Mapping Technologies
1.4.1 Conventional Single-Lead Mapping.
The initial sequence of mapping and ablation for hemodynamically- stable and unstable VT is similar. VT is first induced by rapid pacing to determine its surface QRS morphology, and is then terminated using cardioversion or burst pacing. Next, the electrical characteristics of the endocardial surface of the heart are mapped during sinus rhythm. This is done by consecutively stimulating the endocardium at over 500 sites using an intracardiac electrode and recording the local bipolar electrograms. Observations of animal MI models suggest that reentry circuit
isthmuses can be best defined by delineating infarcted areas of dense, fibrous scar, since these are potentially arrhythmogenic [25]. The sinus mapping procedure identifies scar tissue by subthreshold stimulation of the endocardium while sinus rhythm is ongoing. The resulting local electrograms are measured a few millimeters from the pacing electrode. Scar regions are characterized by low-voltage (< 1.5 mV) multiphasic electrograms. Suprathreshold pacing to mimic the VT (pace mapping) is then performed at locations in or near the scar tissue. This technique is based on the principle that pacing within the reentrant circuit will result in an
identical surface ECG morphology to that of the clinical VT [26].
Currently, the gold-standard for guidance of a catheter to the optimal site for ablation is
entrainment mapping, yielding success rates of between 56% and 80% (success is defined here as no recurrence of the VT within 10 months of ablation) [27, 28]. Entrainment mapping is performed after the reentrant circuit region has been localized, and is used to identify the optimal site for ablation. It ascertains whether the current location of the ablation catheter tip is within the reentrant circuit by comparing the VT cycle length with the post-pacing interval (the period between administration of a pacing stimulus and return of the stimulus to the pacing site) [29]. If they are equal, the position of the ablation catheter tip is within the reentrant circuit. Entrainment mapping is generally only suitable for patients with hemodynamically-stable VT as it requires the patient to be in tachycardia for prolonged periods. Patients with hemodynamically-unstable VT, who account for the larger percentage of the patient population, are frequently unable to tolerate sustained or repeated entrainment mapping [30]. RF ablation procedures in this population are instead guided using substrate and pace mapping during sinus rhythm, and sometimes limited entrainment mapping [31]. As a result, ablation in patients with unstable VT is generally unsuccessful and is therefore rarely attempted.
1.4.2 CARTO
CARTO is now the most widely used guidance technology for RFA procedures. A device external to the patient's body emits a very low magnetic field that induces currents in coils at the tip of the ablation catheter. The magnitudes of the induced currents indicate the catheter tip location and orientation. The catheter tip simultaneously delivers subthreshold stimuli to the cardiac tissue and records the resulting local electrocardiograms. The amplitude of the local electrograms during sinus mapping, and the site at which they were recorded, are displayed in a
3-D electro-anatomical map (as shown in Figure 1.2) that clearly delineates scar tissue. Sites of
successful pace and entrainment mapping are marked on the map. The catheter tip position is also displayed, and movement due to heart motion is minimized using R-wave gating.
CARTO has several drawbacks. Entrainment mapping is still required to accurately localize the exit site, therefore hemodynamically unstable patients are still generally untreatable. Also, the resolution of the electroanatomic map is limited by the time available to acquire data points (upwards of 550 electrograms may be required during ventricular mapping). Therefore CARTO cannot replicate the detail of a computed tomography (CT) or magnetic resonance (MRI) image. Moreover, mapping must be performed with care, ensuring that contact with the endocardium is adequate and that fibrous, low-voltage structures such as the mitral valve annulus are appropriately delineated. Otherwise, scar-regions can be falsely exaggerated [26]. Furthermore, new maps must be generated to fully-visualize multiple VTs.
Lastly, electroanatomic maps provide information only about the electrical substrate and not about the re-entrant electrical activity itself. Therefore, the cardiologist is not directed towards the optimal site for ablation but instead must deduce its location based on the morphology of the scar tissue. It is desirable to limit the number of ablation sites to the minimum required for success, to reduce the risk of damage to functioning myocardium and the creation of potentially thrombogenic endocardial lesions [30]. However, since the cardiologist is guided only by
information on the electrical substrate, treatment may create upwards of thirty lesions and achieve only limited success.
Mitral Annulus
Healthy
Endocardium Ablation site
1.39 cm
Figure 1.2: CARTO electroanatomic map. Colors reflect local electrogram amplitude, with lowest-amplitude areas indicated in red, increasing to yellow, green and blue. Healthy endocardium is shown in purple [15].
1.4.3 CartoMerge
CartoMerge aligns a pre-procedural cardiac CT or MRI image with a CARTO-generated electroanatomic map and real-time data [32]. This technology facilitates complex clinical ablation procedures in which guidance based on anatomical features is most appropriate. It is able to track and display the real-time catheter tip location and orientation within the true cardiac anatomy, with a reported accuracy of less than 3 mm [33]. While this accuracy is highly satisfactory, the technology suffers from a number of its own drawbacks in addition to many of those described for the CARTO system alone. The accuracy with which CARTO data may be mapped to the MRI image is highly dependent on the location of the landmarks used in image registration and on the number of endocardial mapping points collected [34]. Furthermore, small errors in the
acquisition of registration points may introduce significant mapping errors, especially at locations far from the registration landmarks.
1.4.4 Ensite 3000
Although not widely used, the Ensite 3000 balloon catheter is undoubtedly the best available mapping technique for complex or hemodynamically unstable arrhythmias [35]. This system uses a single, non-contact intracavity multielectrode array to sense the voltage field produced by endocardial activation. The 64-electrode braid array computes virtual electrograms simultaneously from more than 3000 ventricular sites using a boundary element inverse solution. This information is then used to reconstruct the entire chamber's endocardial activity, which is displayed as a dynamic 3-D isopotential color map. However, the overall accuracy of reconstructed electrograms decreases with distance from the electrode array, affecting the validity of the map [36]. Also, the endocardial geometry used in the boundary element inverse solution is acquired during baseline rhythm; the assumption that the geometry does not change during VT is an important limitation if the heart is vigorously contracting. Furthermore, the presence of the balloon catheter may interfere with placement of the ablation catheter. Aggressive anticoagulation measures must also be taken which can lead to serious bleeding complications.
1.4.5 RealTime Position Management (RTM) System
The RTM system from Cardiac Pathways uses ultrasound to monitor the absolute position of the ablation catheter. Similar to CartoMerge, an electroanatomic map of the cardiac tissue is overlaid with highly detailed ultrasound images generated using multi-order interpolation. The system also indicates catheter position and allows recall of previous catheter positions, therefore the catheter may be guided without fluoroscopy to a precise point on the electroanatomic map [37]. Drawbacks to this technology include the need to map crucial "snap" points to prevent the ultrasound images of some cardiac structures from being obscured or
obliterated. This requirement introduces a steep learning curve [38]. Furthermore, special catheters fitted with ultrasound transducers are needed. Lastly, the technology requires entrainment mapping to accurately localize the reentrant circuit, generally limiting its use to
patients with hemodynamically stable VT.
1.4.6 LocaLisa
The LocaLisa positioning system is a non-fluoroscopic catheter positioning system that allows a conventional catheter to be located in three dimensions. Three orthogonal electric fields are generated across the body by sets of body-surface current electrodes, and the resulting voltages are measured by the catheter in the cardiac chamber of interest. The electrical field strength at the catheter tip due to each applied current is calculated from the voltage difference
between two electrodes at the catheter tip for three different spatial orientations of the catheter
[39]. Each electric field is assumed to be unform throughout the body. The voltages at the
catheter tip are then measured relative to a surface reference electrode. The position of the catheter tip relative to the reference electrode is calculated by dividing the three measured voltages by their corresponding electrical field strengths.
Within a few centimeters of the calibration position, LocaLisa has an accuracy on the order of 2 mm. This technology also has the significant advantage that it requires no special catheters [40]. However, stability of the surface reference electrode is vital to the accuracy of the system. Furthermore, this method falsely assumes a uniform 3D electrical field within the entire body cavity. Consequently, errors further from the location of calibration may be on the order of
8mm.
1.4.7 Stereotaxis
Sterotaxis is a novel magnetic navigation system that can assist the cardiologist in the ablation of hard-to-reach arrhythmic foci requiring complex movements of the catheter tip [41].
Two magnets are positioned on either side of the patient, inducing a magnetic field of approximately 0.08 Tesla. The ablation catheter tip contains a small permanent magnet that aligns with the externally-applied magnetic field. By changing the position and orientation of the external magnets, the tip of the catheter may be deflected precisely. A computer-controlled catheter advancement system (Cardiodrive, Sterotaxis Inc.) allows the catheter to be guided remotely, significantly reducing exposure of the cardiologist to radiation [42]. Furthermore, Stereotaxis catheter navigation has recently been integrated with CARTO mapping technology for closed-loop ventricular mapping. Complex ablation procedures, such as those within the left ventricular outflow tract, may now be performed with higher success, reduced risk to delicate cardiac structures, and less patient exposure to radiation [43]. While this technology has the potential to revolutionize the way in which ablation procedures are conducted, significant drawbacks include the size, bulk and cost of the Stereotaxis technology.
1.5 The Need for a New Technology
In summary, while multiple technologies now exist that can image the electrical substrate of the heart or the position of an ablation catheter tip, none of these technologies provides information on the arrhythmic electrical activity itself, leaving the cardiologist to deduce the optimal site for ablation. A technology that could direct the cardiologist towards the optimal site for ablation based on the re-entrant activity would be invaluable.
Therefore, the aim of this thesis is to develop two mutually-beneficial methods for guiding ablative therapy and other minimally-invasive surgeries or diagnostic tools. The first method, the Inverse Solution Guidance Algorithm, is the substantial development of an algorithm based on a single equivalent moving dipole model of cardiac activity. This technology allows guidance of an RF ablation catheter to the site of origin of a cardiac arrhythmia, by imaging the tip of the ablation catheter relative to the optimal site for ablation. The second method, the
volume method to a conductivity distribution derived from MRI or CT images. This technology determines the absolute location of the ablation catheter so that it may be displayed within the anatomically-detailed MRI or CT image of the heart. These two guidance algorithms may eventually be combined to produce a powerful tool for the ablative therapy of cardiac arrhythmias.
2. A New Mapping Technology
2.1 The Inverse Solution Guidance Algorithm
2.1.1 Background
The inverse problem in electrocardiography maps instantaneous 2-D body-surface
potentials to the 3-D summated cardiac excitation wavefront that created them. To image the isthmus or the exit site of the re-entrant circuit, numerous models have been developed that reconstruct electrical activity in the epicardium or myocardium from surface electrocardiographic potentials [44-48]. Although the reconstruction is ill-posed, deterministic methods (such as Tikhonov or Wiener regularization) or statistical inversion are applied to obtain physiologically-meaningful results [48-51]. Several models exist that represent instantaneous cardiac activity by an equivalent source of single or multiple dipoles, which may be fixed or moving [52, 53]. The central limitation of many of these models is that they cannot provide real-time imaging of the electrical activity, are subject to systematic errors, and cannot be used to image and guide the catheter tip to the ablation site.
A guidance method, the Inverse Solution Guidance Algorithm (ISGA), that utilizes a
single equivalent moving dipole (SEMD) model of electrical activity to localize both the exit site of the re-entrant circuit and the tip of a specially-designed ablation catheter for accurate delivery of ablative energy has been described [54-56]. The SEMD solution for a single time instant in the cardiac cycle is the dipole whose forward-modeled potentials best reproduce the instantaneous measured potentials at the body-surface electrodes [54]. Although the SEMD model is a highly simplified representation of cardiac electrical activity, it is accurate and realistic when the heart's electrical activity is spatially well localized, for example as depolarizing energy emerges from the exit site of a re-entrant circuit [55]. In the application of ISGA, dipole parameters (comprising the three-dimensional location and moment) are estimated for every time sample of a beat of VT to
find the trajectory of the single equivalent dipole over the cardiac cycle. The dipole corresponding to the exit site of the re-entrant circuit is selected from analysis of this trajectory.
We shall term this dipole the arrhythmogenic dipole.
However, RFA requires both the localization of the exit site or the isthmus of the re-entrant circuit and the guidance of an ablation catheter to this site. Our approach tackles both of these problems, by using ISGA to also determine the location of the catheter-tip. Specifically, surface potentials generated by a current dipole between electrodes at the tip of a specially-designed ablation catheter are used to estimate the catheter-tip dipole location and orientation. In this way, the ablation catheter-tip may be guided to the exit site of the re-entrant circuit for the accurate delivery of ablative energy.
2.1.2 Mathematical Basis for the Inverse Solution Guidance Algorithm
In the Inverse Solution Guidance Algorithm, for a given dipole location, magnitude and orientation, the estimated forward potential at the ith body-surface electrode, qf , due to a single dipole is estimated using an infinite volume conductor model [55]:
f p -(r - r,') (Eqn 2.1)
4yrglr - r,'|'
where ri' represents the ith electrode location, r the dipole location, p the dipole moment, and g the conductivity of the volume conductor. An objective function,
/,
describes how well the dipole reproduces the measured voltages:g2 '"__M (Eqn 2.2)
where (m' is the measured potential at the ith electrode, 0"m' is the standard deviation of the measurement noise in lead i, and I is the number of electrodes.
In the application of ISGA, voltages are measured at 64 electrodes on the volume conductor surface and a bruteforce search method is used to find the SEMD parameters that best fit a single time sample of the measured data [57]. The brute force search process commences with discretization of the volume into cubic volumes 1.5 cm on a side. A dipole is simulated to lie at the center of each cube and its moment is optimized, using the relationship defined by Eqns. 2.1 and 2.2, to most closely reproduce the measured potentials (this optimization strategy has previously been termed three-plus-three parameter optimization as the three locations are optimized independently from the three moment parameters [54]). The dipole whose location and moment minimize the X2 function at a resolution of 1.5 cm is then selected. The cube containing this dipole and its neighboring cubes are discretized into smaller cubes and the X2-minimization procedure is repeated to find the optimal dipole at this resolution and in this volume. The process is iterated until the cube dimension is less than 1 mm. At this resolution, the dipole whose forward-modeled body surface potentials best reproduce the measured potentials is selected as the single equivalent dipole model for that time sample.
2.1.3 Previous Development of ISGA
Initial investigations into the Inverse Solution Guidance Algorithm were conducted by Armoundas et al [58]. First, the effect of noise and dipole orientation on the accuracy of ISGA was examined in computer simulations [55]. The model torso consisted of a bounded sphere of radius R = 12.5 cm with 60 electrodes arranged randomly on its surface. The potential at each
electrode due to a set point source within the sphere was calculated. Zero-mean Gaussian noise with a standard deviation a was added to each of the forward-modeled potentials to yield a set of 'measured' potentials. Trials were conducted with values of a that varied from I pV to 1 mV, to test the ability of the algorithm to withstand a wide range of noise levels (the magnitude of an
microvolts). For each set of 'measured' potentials, ISGA was used to estimate the dipole location and moment. At a realistic level of noise (a = 0.01 mV), the standard deviation of the error (the
distance between the actual and estimated dipole positions) was found to be less than 0.5 mm. Since ablation only requires an accuracy of 2 to 3 mm, this error is insignificant. Measurement noise was found to have no significant effect until its magnitude became comparable to that of the measured potentials. Next, for each noise level, 100 simulations were performed using a dipole with fixed position and magnitude, and random dipole orientation. The error was calculated for each simulation. The effect of a randomized dipole orientation was found to be significant, causing localization errors of greater than 5 mm in the bounded volume conductor.
The effect of electrode position, measurement noise and dipole orientation and position on the dipole estimate have also been investigated in numerical simulations of a realistic torso model [59]. While measurement noise was found to have a minimal effect on localization error, the accuracy of the dipole estimate was greatly improved by using an electrode arrangement consisting of pads placed over the front, back, and left and right sides of the torso at the height of the heart (rather than a random electrode configuration). Furthermore, results suggested that dipole orientation caused significant variation in the estimated position of the dipole; this indicated the need for further work to characterize the effect of dipole orientation and assess its significance.
In-vivo studies were also conducted using epicardial pacing in a swine model [56]. A
high correlation was found between measured and forward-modeled potentials over the majority of electrodes, indicating that the SEMD model of electrical activity accurately represented the electrical source even during the T-wave. In addition, the spatial uncertainty of the dipole model due to realistic levels of Gaussian noise was found to be low when the dipole was most localized at the beginning of the QRS. The distance and direction between adjacent pacing sites could also be accurately estimated, suggesting that a pacing stimulus from the tip of an ablation catheter could be used to direct the catheter to the site of origin of the arrhythmia [56].
Further development of ISGA was conducted by Rosbury et al. [57]. A brute-force dipole search algorithm was implemented that proved more robust than the previously-used simplex search method. A ventricular model was also developed to simulate electrical activity from a reentrant circuit, and to demonstrate that with slight modifications, ISGA could be used in the context of fast VT (see Chapter 5).
2.2 The Bioelectrical Imaae Guidance (BIG) Method
2.2.1 Background
A. Simulation
Repeat for three orthogonal electrode setups
Generate look-up table:
V
1 B. MeasurementInsert Catheter
,(i,j,k) V2,(ij,k) V3,(ij,k)
Stimulate each electrode "N Find entry in look-up
pair in turn. Record the table 'most similar' to t
_+ potentials at the catheter -11 V'1, '2, V'3 -> +
1iV ,(i',j',k') V ,i,'k)
Figure 2.1: An overview of the Bioelectrical Image Guidance (BIG) method
The Bioelectrical Image Guidance (BIG) Method calculates the absolute position of the
ablation catheter tip so that it may be displayed in an anatomically-detailed 3-D image of the
i', j', k' is
he location of the catheter
surgical area. Such a display is especially appropriate for ablation procedures guided by anatomical landmarks. In addition, the risk of damage to delicate cardiac structures is diminished if the catheter's position can be accurately visualized.
A flow diagram of the BIG Method is shown in Figure 2.1. The method begins with the
acquisition of a 3-D MRI or CT image encompassing the surgical area of interest and providing full cross-sectional views of the torso. This image is processed to obtain an electrical conductivity for each voxel in the pixilated image (see section 2.2.2). The conductivity distribution of the torso section is thus determined. Next, the current flow between two electrodes at pre-defined locations on the torso surface is simulated, and the potential distribution in the torso due to the applied currents is modeled (see section 2.2.3). This is repeated for three different sets of surface electrodes. Thus, each image voxel is characterized by three voltages that result at that location due to the three current stimuli. These voltage triplets are stored in a look-up table. At the start of the surgical procedure, electrodes of the same dimensions as the image voxels are placed at the pre-defined locations on the torso surface, and the surgical instrument is inserted subcutaneously. Voltages due to the three current stimuli are measured at the instrument tip. By comparing the measured voltages to the entries in the look-up table, the instrument tip location is identified in real-time.
2.2.2 Conductivity Map Generation
An accurate conductivity value must be assigned to each voxel in the anatomical image. We envisage two possible methods by which this may be done. Firstly, a voxel's conductivity is chiefly determined by the tissue in which it is located. Therefore, conductivities may be estimated
by segmenting the anatomical image into tissue types and assigning the voxels in each tissue a
standard conductivity value from published data [60]. A simple example of manual tissue
segmentation is shown in Figure 2.2, and tissue conductivities from the literature are shown in Table 2.1. Currently available segmentation software is either semi- or full-automatic [61]. While
this method is fairly straight-forward, it does not account for conductivity variation between individuals or within the same tissue [62]. Furthermore, partial-volume effects (that occur when multiple tissue types contribute to the same voxel) may lead to ambiguities in conductivity assignment. Finally, as seen in Table 2.1, some tissue types have a wide range of published conductivities. These conductivity variations may be due to measurement inaccuracy or differences in physiological state (e.g. hydration level, phase of the respiratory cycle, etc.). Significant errors in the modeled potential distribution may result if the wrong conductivity values are applied.
Alternatively, the MRI image may be converted directly into a conductivity map. Tissue conductivity is dependent on its water content [63], which in turn is related to its T1 weighting, the spin-lattice relaxation time. Therefore, if the contribution of T1 to the signal intensity of a pixel is isolated [64], the conductivity of the voxel may be determined. Two exceptions are fat and cortical bone, which generate significant contrast despite their low water permittivity values. Therefore, these tissues must be segmented from the MRI image and assigned appropriate values from published data [65]. The direct conversion of Ti weighting into electrical conductivity may be further complicated by 'intensity inhomogeneities', which result from limitations in scanner equipment and cause a shading effect to appear over an image. However, conductivities assigned using this method have been found to be in reasonable agreement with published values [64].
A third technique may be to combine the tissue segmentation and intensity conversion
methods, using margins around published values to constrain the tissue conductivities we estimate from the MRI image.
Skin
Figure 2.2: Exampl
Tissue Resistivity (am)
e of manual segmentation of an MRI image
Conditions Source
Table 2.1: Published values for tissue conductivities
2.2.3 Current Flow Model
The torso potential distribution is determined by modeling the current flow across the boundaries of each voxel. Injected current is assumed to flow from the surface electrode into the voxel beneath it; current flow out of this voxel is calculated using an adapted Kirchoff's law. At all other voxel locations, current flow is modeled using the differential form of Ohm's Law which relates the current density within an enclosed surface, the electrical conductivity of the medium, and the potential gradient across its surface. Section 6.1.1 describes the implementation of the current flow model in greater detail.
2.3 Thesis Overview
The aim of this thesis was to develop ISGA and the BIG Method from theoretical guidance methods to experimental guidance systems. Initial results obtained by Armoundas et al. and Rosbury et al. demonstrated the promise of ISGA as a method for localizing a stationary electrical source [54-58]. However, several challenges remained to be overcome if the algorithm was to be used to guide an ablation catheter. Initial findings implied that dipole orientation might have a significant effect on the accuracy of catheter tip guidance. Therefore, the first aim of this thesis was to carry out an in-depth analysis of the effect of dipole orientation on the algorithm's accuracy. A significant effect was indeed found, necessitating the development of a method to overcome the effect of dipole orientation. To assess ISGA's potential to guide a catheter, guidance experiments were conducted in an inhomogeneous phantom model. In addition, software and guidance algorithms were developed for the in-vivo testing of a full prototype guidance system.
The second part of this thesis developed and explored the Bioelectrical Image Guidance Method. Numerical simulations were used to assess the accuracy of current flows in the finite volume model. Next, instrument localization accuracies were assessed in homogeneous, inhomogeneous and anisotropic computer models. To conclude this thesis, the potential of the
BIG Method as a tool for real-time, 3-D image-guided surgery was demonstrated in phantom studies.
3. Development of the Inverse Solution Guidance
Algorithm
The Inverse Solution Guidance Algorithm has previously been used in numerical simulations and in-vivo experiments for stationary electrical source localization [54-58]. Application of ISGA to catheter guidance necessitated three significant improvements to the method, which are detailed in this chapter. Firstly, a more thorough brute-force search process was implemented so that the dipole solution could be found with greater accuracy in complex volume conductors. Secondly, its speed was improved to allow the trajectory of the moving dipole to be imaged over many time samples of the VT without significant delay to the experimental procedure. Thirdly, a method to overcome the effect of dipole orientation was developed, after orientation was found to have a significant effect on the algorithm's accuracy. With these changes, ISGA may be used to guide an ablation catheter to the reentrant circuit exit site more rapidly and more accurately than previously possible.
3.1 Enhancement of Algorithm Performance
The brute-force search algorithm finds the single equivalent dipole model of instantaneous electrical activity by minimizing the objective function at progressively finer resolutions [57]. The proposed advantage of this method over the original simplex search algorithm is the avoidance of local objective function minima. However, in an animal or human torso, intricate distortions in the electric field caused by inhomogeneities and anisotropies lead to a highly-complex objective function space. As a result, the volume element with the objective function minimum at a low resolution in the brute-force search might not contain the volume element with the absolute minimum at the highest resolution. If this is the case, the dipole solution will be incorrect. To prevent such errors, we have implemented a branched search method that searches the volume elements with the ten smallest objective function values at each
resolution in the brute-force search. The elements are searched in parallel, resulting in less than
0.5 seconds added computation time.
ISGA has also been modified to estimate the dipole parameters from multiple time
samples of data simultaneously. Using a highly vectorized approach, twenty dipoles are now calculated in parallel; computation time for a single dipole has thus been reduced from 2 seconds to 0.5 seconds. This significant reduction in computation time allows the dipole trajectory over an entire cardiac cycle to be calculated four times faster than previously possible.
3.2 The Effect of Dipole Orientation
By using a simplified forward-model of the torso, ISGA's solution may be estimated in
real-time, a necessity during an ablation procedure. However, since all inhomogeneities, anisotropies and boundary effects are ignored, the forward-modeled potentials may be substantially different from the measured potentials even for the dipole that minimizes the
Z
objective function [66]. If the forward model were an accurate representation of the real torso, we would expect an objective function minimum of approximately 1, since the modeled and measured potentials would differ only by the level of random noise:f2 '" ~ if ,, = (P' + 1(0,+O-,',)
However, due to the simplicity of the forward model, the objective function minimum may be much larger than 1. Furthermore, the position of the estimated dipole will be displaced from the
true position of the equivalent dipole by a systematic error, even if the electrical activity is
well-localized. The estimated dipole positions and moments will be referred to from hereon as the
dipole images to distinguish them from the real equivalent dipole locations and moments.
arrhythmogenic dipole? Clearly, if the two dipoles are in reality matched in both location and orientation, a purely systematic error distorts the estimation of their locations equally and their images appear perfectly superposed. Simulations conducted by Armoundas et al. [55] have shown that in a bounded torso model and in the presence of 0.01 mV Gaussian measurement noise, two superposed and co-oriented dipoles are estimated to lie within 0.4 mm of each other; although noise prevents exact alignment in image space, two co-oriented dipoles still appear essentially superposed. However, will the images of two dipoles whose moments are not aligned also appear superposed?
The purpose of this study was to analyze ISGA's ability to co-localize superposed but differently-oriented dipoles in the presence of sources of systematic error. Two sources of systematic error were considered: boundary effects and inaccurate electrode positioning. It was found that the Inverse Solution Guidance Algorithm does not guarantee accurate superposition of two dipoles whose moments are not aligned.
3.2.1 Methods
A. Forward Model
Simulations were conducted in a homogenous spherical torso model of radius 12.5 cm. A total of 60 electrodes were distributed on the sphere surface in a 12.5 cm by 12.5 cm square grid of 25 electrodes (inter-electrode separation = 3.125 cm), with the other 35 electrodes distributed randomly over the spherical surface. The electrode grid was centered at the point on the torso surface closest to the stationary dipole simulating the arrhythmogenic dipole. This layout takes into consideration the eventual application of this work in RFA procedures. The spherical model is shown in Fig 3.1.
The equation derived by Frank [67] was used to estimate the potentials on the surface of the bounded spherical torso due to a dipole (ps, py, p.) located along the z axis at z =fR (Off5 1;
V
p,1
-f
24ngfR
2(1+
f22fp'
2
p., cos
yI'
+ p,, sin
yi'
3f -
3f
2
i+
f'
-4ngIR2sin0' (1_f2-2fp
(Eqn. 3.1)
where p' = cos(O') and 6' and V/ are the azimuth and latitude angles of the i4 surface electrode, respectively, and g is the conductivity of the spherical medium.
io I
-10 / . 0 0 * * * I. a -10 -110 1( 4 5-55 10 x (CM) y (cm)Figure 3.1 Spherical torso model, centered at the origin. A sample electrode grid is shown; the electrodes are distributed in a square 5 by 5 electrode grid (indicated by black asterisks) centered at the point on the sphere surface closest to the bioelectric dipole (inter-electrode separation = 3.125
cm). The other 35 electrodes (not shown) are distributed randomly over the model surface.
Inaccurate electrode positions were generated by adding errors drawn from a Gaussian distribution (, = 0, a, = 0.5 cm) to each of the x-y-z co-ordinates of each correct electrode
location (this error is large compared to the accuracy of technology currently used to acquire electrode positions; for example, the Polhemus 3-D tracker system (Polhemus, Colchester, VT) is able to assign 3-D co-ordinates to electrodes with 1 mm RMS resolution [68]). The forward problem utilized the real electrode locations and the bounded torso model defined by Eqn 3.1 to simulate measured surface potentials for a given dipole. The Inverse Solution Guidance Algorithm, on the other hand, used the assumed electrode locations and the infinite volume conductor estimation defined by Eqn 2.1 to estimate the dipole parameters. Finally, we added
Gaussian white noise (p4 = 0, u;, = 0.01 mV) to the measured surface potentials to account for a
realistic level of measurement noise.
B. Computer Simulations to assess the Significance of Dipole Orientation
The distance between dipole images whose real dipole locations are superposed but whose real dipole moments are not aligned reflects the ability of the algorithm to detect the final superposition of the ablation catheter-tip with the arrhythmogenic dipole. Simulations were performed in the model described above to investigate the effect of dipole orientation on the consistency of the dipole image solution. A dipole of constant magnitude (sufficient to generate maximum surface potentials on the order of 0.1 mV) was placed at consecutive locations along the z-axis. At each dipole location 100 simulations were conducted using random dipole orientations, and the 100 dipole image positions estimated by the Inverse Solution Guidance Algorithm were recorded. The mean location of the dipole images was calculated for each set of
100 dipole image positions. The dipole image bias (the absolute distance of the mean dipole
image location to the real dipole location), and the dipole image dispersion (the standard deviation of the absolute distance of each dipole image location from the mean dipole image location) were then computed. The dipole image bias reflects the displacement between real and image space. Dipole image dispersion, on the other hand, quantifies how widely the dipole images are scattered in three dimensional image space and reflects how accurately ISGA will
detect the superposition of dipoles whose real locations are superposed but whose orientations are different. Since an ablation accuracy of 2-3 mm is ideal, an algorithm to overcome the effect of dipole orientation must be developed if the magnitude of the dispersion implies that this accuracy is not consistently achievable.
3.2.2 Results
The results displayed in Fig 3.2 show that the dipole image bias (the absolute distance between the actual location of the dipole and the mean location of the 100 estimated dipole images) is less than 1 cm at all locations along the z-axis of the spherical torso. This indicates that there is excellent correspondence between the position of the dipole in real and image space in spite of the simplicity of the forward model.
1-C 0 Z0
0.8-a.
0.6- -E 0.4- 0.2-0 2 4 6 8 10 12Distance of real dipole location from center of sphere (cm)
Figure 3.2 The effect of dipole orientation on the uncertainty of the estimated dipole location, in a bounded spherical torso model with inaccurate electrode positioning. The dipole image bias is shown as a solid line, while error-bars indicate the magnitude of the dipole image dispersion.
However, the dipole image dispersion (the standard deviation of the absolute distance between each dipole image and the mean dipole image), is greater than 2 mm even at dipole locations close to the torso center. The magnitude of the dispersion indicates that the images of two perfectly superposed yet differently-oriented dipoles may be more than 5mm apart in the presence of sources of systematic error. This error is greater than the 2-3 mm accuracy optimal for catheter ablation. Therefore, the need for an improved algorithm that will overcome the effect of dipole orientation is apparent.
3.3 A Method to Compensate for the Effect of Dipole Orientation
The original Inverse Solution Guidance Algorithm does not guarantee accurate superposition of two dipoles whose moments are not aligned. We present a method to compensate for the effect of orientation in the presence of sources of systematic error. This method utilizes a special catheter-tip design on which four electrodes are placed in a configuration that is able to produce three orthogonal dipoles. If stimulation of these dipoles is time-or frequency-modulated, three sets of torso surface potentials are produced for a single location of the catheter tip. The method weights and sums these surface potentials to produce a set of potentials identical, to within the level of measurement noise, to the set of body-surface potentials due to the arrhythmogenic dipole, provided that the catheter-tip is superposed with the arrhythmogenic dipole. Three methods to guide the ablation catheter towards the arrhythmogenic dipole to achieve such superposition were evaluated.
Numerical simulations were used to test each method's ability to guide a moving catheter-tip towards a fixed arrhythmogenic dipole, and also to evaluate their superposition accuracy in the presence of significant sources of systematic error. This study provided an assessment of ISGA's potential to guide ablation therapy.
3.3.1 Method Development
A. Catheter Design with Multiple Tip Dipoles
Figure 3.3. Catheter design with a single positive
electrode at its tip and three negative electrodes arrayed further down the shaft
We propose a special catheter with a single positive electrode at its tip and three negative electrodes arrayed a few millimeters down the shaft, such that three independent dipoles of equal magnitude can be generated separately from the same focus on the catheter-tip. This design is illustrated in Fig 3.3. The three potentials at each body-surface electrode i, p' = [(0', 92', 93
J
where iE {l, 2, ... , I}, may be weighted and summed using a weighting vector, X=
[A,
A2, A31 toproduce a voltage (p',:
(Eqn 3.2)
Due to the linear relationship between dipole moment and body-surface potentials, (p/' is the set of potentials that would result if a dipole of orientation p. A-P (where P is a 3-by-3 matrix whose rows represent the dipole moments of the three catheter-tip dipoles) were generated at the catheter-tip. By recording the body-surface potentials generated by the three dipoles, and then choosing a single ) for all I surface electrodes, we can reproduce the potentials that would result from a dipole of orientation pA placed at the catheter-tip. Thus, the surface potentials of a catheter-tip dipole of any moment may be simulated, regardless of physical tip orientation.
Let pa be the moment vector of the arrhythmogenic dipole image and a= [ Pa1, Pa2. Pa'] the resultant instantaneous surface potentials due to the arrhythmogenic dipole. If the catheter-tip is perfectly superposed with the arrhythmogenic dipole, a unique weight 2 can be
found
to create aeq,
i = [(oX
', P 2 . (o I] that is indistinguishable from 9a (to within the levelof measurement noise). If a brute-force search is applied to
ep,
the SEMD solution will be equivalent to that for (a, correctly indicating dipole superposition regardless of catheter-tiporientation.
B. Estimation ofX
We define the error, Ex, as the sum over all body-surface electrodes of the squared normalized difference between the body-surface potentials due to the arrhythmogenic dipole, qpa', and a weighted sum, p' = - P', of the body-surface potentials due to the dipoles at the ablation
catheter-tip:
E; = j u " P), (Eqn 3.3)
For the three sets of body-surface potentials due to the dipoles at the catheter-tip (expressed in the matrix 0 =[P], 92, (3]' where (,=[Oil (d/]' and ],2,...,
j
1, 2, 3}), we find theX that minimizes EA. X is the value of k that minimizes E,. pX is then defined as:
(Eqn 3.4)
If the catheter-tip is superposed with the real location of the arrhythmogenic dipole, P
will be equivalent to (a, the body-surface potentials due to the arrhythmogenic dipole. If the catheter-tip and arrhythmogenic dipole are not superposed, it will be impossible to find a X for which
epX
is equivalent to (a. Instead, (p X will be the closest possible approximation to (a given the three sets of body-surface potentials, i. Since this method compares the measured surfacepotentials from the cardiac and catheter-tip dipoles, we shall term it the Cardiac Signal
Comparison (CSC) Method.
C. Achieving Superposition with the Arrhythmogenic Dipole
We explored two brute-force search methods to find the best-fit SEMD approximation to
<p 1: Method I, in which both the location and the moment of the SEMD were optimized [54]; and
Method II in which the dipole location was optimized but the dipole moment was restricted to Pa regardless of catheter-tip position.
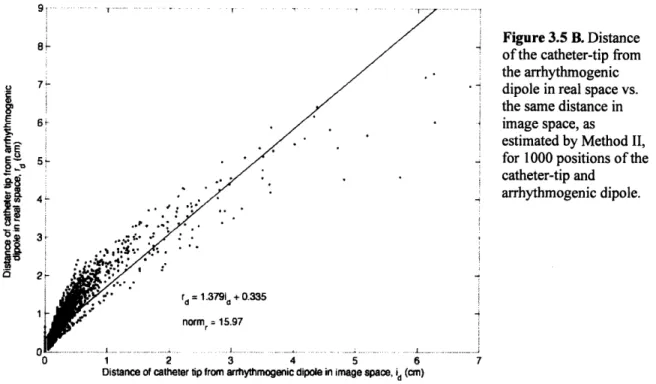
The distance between two dipoles in image space may not always accurately represent the distance between them in real space, due to different degrees of systematic error. Furthermore, at catheter-tip positions close to the arrhythmogenic dipole, Method I may falsely
indicate superposition of the catheter-tip with the arrhythmogenic dipole. This occurs when two
sets of surface potentials (produced by sources at slightly different locations in the torso) are fitted with dipoles at the same location. The greater the systematic error at the arrhythmogenic dipole location, the more likely this is to happen. The magnitude of the systematic error at this location is reflected by the parameter Xa2
:
2 (oLf (a I 2 (Eqn 3.5)
i=1 ( 7m
since its magnitude is proportional to the dissimilarity between the forward-modeled and measured potentials of the arrhythmogenic dipole. The higher the value of Xa , the less accurate the SEMD estimation and the greater the possibility that Method I will falsely indicate superposition. The closer the catheter-tip is to the arrhythmogenic dipole, the more likely it is that this will happen, also.
This is not a concern if the dipole moment is fixed during the brute-force search (Method