HAL Id: hal-00329414
https://hal.archives-ouvertes.fr/hal-00329414
Submitted on 22 Dec 2004
HAL is a multi-disciplinary open access
archive for the deposit and dissemination of
sci-entific research documents, whether they are
pub-lished or not. The documents may come from
teaching and research institutions in France or
abroad, or from public or private research centers.
L’archive ouverte pluridisciplinaire HAL, est
destinée au dépôt et à la diffusion de documents
scientifiques de niveau recherche, publiés ou non,
émanant des établissements d’enseignement et de
recherche français ou étrangers, des laboratoires
publics ou privés.
A joint Cluster and ground-based instruments study of
two magnetospheric substorm events on 1 September
2002
N. C. Draper, M. Lester, J. A. Wild, S. E. Milan, G. Provan, A. Grocott, S.
W. H. Cowley, Y. Bogdanova, J. P. Dewhurst, A. N. Fazakerley, et al.
To cite this version:
N. C. Draper, M. Lester, J. A. Wild, S. E. Milan, G. Provan, et al.. A joint Cluster and ground-based
instruments study of two magnetospheric substorm events on 1 September 2002. Annales Geophysicae,
European Geosciences Union, 2004, 22 (12), pp.4217-4228. �hal-00329414�
Annales Geophysicae (2004) 22: 4217–4228 SRef-ID: 1432-0576/ag/2004-22-4217 © European Geosciences Union 2004
Annales
Geophysicae
A joint Cluster and ground-based instruments study of two
magnetospheric substorm events on 1 September 2002
N. C. Draper1, M. Lester1, J. A. Wild1, S. E. Milan1, G. Provan1, A. Grocott1, S. W. H. Cowley1, Y. Bogdanova2, J. P. Dewhurst2, A. N. Fazakerley2, J. A. Davies3, and J.-M. Bosqued4
1Radio and Space Plasma Physics Group, Department of Physics and Astronomy, University of Leicester, Leicester LE1 7RH, UK
2Mullard Space Science Laboratory, Holmbury St Mary, Dorking, Surrey RH5 6NT, UK
3Space Science and Technology Department, Rutherford Appleton Laboratory, Chilton, Didcot, Oxon OX11 0QX, UK 4CESR/CNRS, BP 4346 9, Avenue Colonel Roche, 31028 Toulouse CEDEX 4, France
Received: 19 March 2004 – Revised: 27 July 2004 – Accepted: 15 September 2004 – Published: 22 December 2004
Abstract. We present a coordinated ground- and space-based multi-instrument study of two magnetospheric sub-storm events that occurred on 1 September 2002, during the interval from 18:00 UT to 24:00 UT. Data from the Clus-ter and Polar spacecraft are considered in combination with ground-based magnetometer and HF radar data. During the first substorm event the Cluster spacecraft, which were in the Northern Hemisphere lobe, are to the west of the main region affected by the expansion phase. Nevertheless, substorm sig-natures are seen by Cluster at 18:25 UT (just after the ex-pansion phase onset as seen on the ground at 18:23 UT), de-spite the ∼5 RE distance of the spacecraft from the plasma
sheet. The Cluster spacecraft then encounter an earthward-moving diamagnetic cavity at 19:10 UT, having just entered the plasma sheet boundary layer. The second substorm ex-pansion phase is preceded by pseudobreakups at 22:40 and 22:56 UT, at which time thinning of the near-Earth, L=6.6, plasma sheet occurs. The expansion phase onset at 23:05 UT is seen simultaneously in the ground magnetic field, in the magnetotail and at Polar’s near-Earth position. The response in the ionospheric flows occurs one minute later. The sec-ond substorm better fits the near-Earth neutral line model for substorm onset than the cross-field current instability model.
Key words. Magnetospheric physics (Magnetosphere-ionosphere interactions; Magnetic reconnection; Auroral phenomenon)
1 Introduction
Substorm onset models have broadly developed into two cat-egories, the near-Earth neutral line (NENL) model and the Correspondence to: N. C. Draper
cross-field current instability (CCI) model. Each consists of three phases; the growth phase (McPherron, 1970), the ex-pansion phase and the recovery phase (Akasofu, 1964).
The NENL model (Baker et al., 1996 and references therein) considers the magnetotail loading that occurs during the growth phase to be a process that cannot be indefinitely continued; if it were, either the plasma sheet would thin until its scale was that of an ion gyroradius, or the dayside magne-topause would be completely eroded through reconnection. As neither of these occur, a NENL forms due to spontaneous reconnection in the central plasma sheet at a distance down-tail of around 20 to 30 RE from Earth (as suggested by the
magnetic reconnection study by Nagai et al., 1998). Initially, the closed magnetic field lines threading the nightside plasma sheet are reconnected, followed by reconnection of the open field lines which form the lobes of the tail. Magnetic field lines closed during this time are subsequently returned to the dayside. The NENL formation decreases the current in that region of the central plasma sheet. This disturbs the current flow, which must be diverted away from this area, either earthward, enhancing the inner current sheet, or tail-ward, leading to plasmoid formation, or it is redirected along magnetic fields that are connected to the ionosphere, creating the substorm current wedge (SCW; McPherron et al., 1973). Therefore, in the NENL model, substorms are initiated by the spontaneous formation of a magnetic reconnection line in the near-Earth tail, with current disruption in the inner current sheet occurring as a result.
A modified NENL model has also been proposed by Sh-iokawa et al. (1998), in which high-speed earthward ion flow in the current sheet (earthward of the near-Earth neutral line, which is formed first) is braked in the region where a tail-like field becomes dipolar, resulting in a dawnward inertia current at the boundary between the two types of fields. This bound-ary gradually moves tailward after expansion phase onset as a result of flux pile-up in the region.
4218 N. C. Draper et al.: A joint Cluster and ground-based instruments study
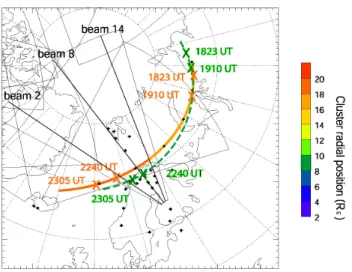
Fig. 1. Cluster 1 (Rumba) footprint (solid orange line) and Polar
footprint (dashed green line) mapped on to SuperDARN fields-of-view, with IMAGE magnetometer stations (black crosses). Times of interest are marked with orange crosses for the Cluster footprint and green crosses for the Polar footprint.
In this picture the substorm current wedge is formed at this braking point. The CCI model (Lui (1996) and refer-ences therein) considers the high level of magnetic field fluc-tuations in the near-Earth current sheet at the start of the ex-pansion phase (substorm onset). These are attributed, in this model, to the current disruption and turbulence in the mag-netic field. Current disruption causes the formation of the SCW, diverting current flow to the ionosphere. The NENL is formed as a result, allowing reconnection and plasmoid formation further downtail from the SCW region. The near-Earth current sheet disruption can initiate a rarefaction wave which is propagated downtail (Chao et al., 1977). This leads to the thinning of the plasma sheet and tail reconnection. Therefore, in the CCI model, the substorm onset is initiated at the inner edge of the current sheet and subsequently prop-agates both earthward via the SCW and downtail to form the NENL.
In this paper we present observations in the tail and iono-sphere from an interval in which two substorm expansion phases occur. From these observations we discuss the rel-ative merits of the two substorm onset models described above.
2 Instruments
Figure 1 presents the position of the footprints of the Clus-ter 1 (Rumba, solid orange line) and Polar spacecraft (dashed green line) in a geographic coordinate system on 1 Septem-ber 2002 between 18:00 and 24:00 UT. Also indicated are the fields of view of some of the Northern Hemisphere Su-perDARN radars (Greenwald et al., 1995) with beams 2, 8 and 14 marked for the Hankasalmi (Finland) radar. The lo-cations of IMAGE ground magnetometer network stations
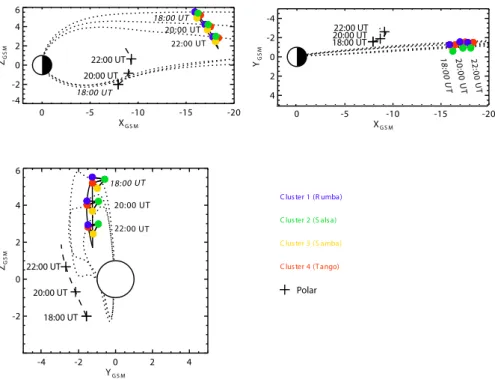
(Viljanen and H¨akkinen, 1997) are also indicated in Fig. 1 as small black crosses. The fields of view of two of the SuperDARN radars, located at Hankasalmi in Finland and Pykkvibær in Iceland, partly overlap the IMAGE magne-tometer network. The location of the Tixie station of the 210 MM (210 deg magnetic meridian) magnetometer net-work, whose data is also employed, is out of the view of the plot, at 65.67 deg geomagnetic latitude and 196.88 deg geo-magnetic longitude. The times labelled with orange crosses on the Cluster footprint and green crosses on the Polar foot-print correspond to events discussed in this paper. The Clus-ter footprint comes into conjunction with the fields of view of the radars from around 19:00 UT onwards, starting with the Pykkvibær (Iceland East) radar, while the Polar footprint comes into conjunction from 20:00 UT. Figure 2 shows the position of the four Cluster spacecraft (true separations) and the Polar spacecraft during this interval in the GSM xz, xy and yz planes. The dotted lines show the model magnetic field lines using the Tsyganenko 1996 model (Tsyganenko and Stern, 1996) while the solid lines show the Cluster space-craft paths, and the dashed lines show the Polar spacespace-craft’s path. The Cluster spacecraft are all above the centre of the plasma sheet and in the post-midnight sector, and at −16 REdowntail at 18:00 UT (having later moved to −18 RE at
24:00 UT). Cluster 3 (Samba, shown in yellow) is closest to the current sheet, Cluster 4 (Tango, red) is furthest down the magnetotail, and Cluster 2 (Salsa, green) is closest to mid-night (the y=0 axis). The instruments used from the Cluster spacecraft in this study include the Fluxgate Magnetometer (FGM; Balogh et al., 1997), the Plasma Electron and Cur-rent Experiment (PEACE; Johnstone et al., 1997), the Clus-ter Ion Experiment (CIS; R`eme et al., 1997), and the Re-search with Adaptive Particle Imaging Detectors instrument (RAPID; Wilken et al., 1997). The Polar spacecraft (denoted by a black cross) was in the magnetotail close to the equato-rial plane, in the post-midnight sector at a distance of −8 RE
downtail at 18:00 UT (and later −9 RE at 24:00 UT).
Parti-cle data from the Comprehensive Energetic PartiParti-cle and Pitch Angle Distribution (CEPPAD; Blake et al., 1995) instrument on Polar are used here.
3 Data description
3.1 IMAGE and 210 MM magnetometer arrays
In order to provide a context for the Cluster observations and determine timings for the relevant events occurring during the interval, IMAGE ground magnetometer data are shown in Fig. 3. Plots of the x (north-south) component of the mag-netic field at selected IMAGE stations and the correspond-ing filtered data at one station, Tartu (tar), are shown for the 18:00 to 24:00 UT interval. The latter provides information on the presence of Pi2 wave activity. Substorm expansion phase onset is accompanied by Pi2 pulsations in the ground magnetometer data, which are irregular, damped ULF waves with a period of approximately 20 to 200 s.
N. C. Draper et al.: A joint Cluster and ground-based instruments study 4219 0 -5 -10 -15 -20 XG S M -4 -2 0 2 4 6 ZG S M 18:00 UT 20:00 UT 22:00 UT -4 -2 0 2 4 YG S M -2 0 2 4 6 ZG S M C luster 1 (R umba) C luster 2 (S alsa) C luster 3 (S amba) C luster 4 (T ango) 0 -5 -10 -15 -20 XG S M 4 2 0 -2 -4 YG S M Polar 18:00 UT 18:00 UT 18:00 UT 18:00 UT 1 8 :00 U T 20:00 UT 2 0 :00 U T 22:00 UT 2 2 :00 U T 20:00 UT 20:00 UT 20:00 UT 22:00 UT 22:00 UT 22:00 UT
Fig. 2. Orientation of the four Cluster spacecraft and the Polar spacecraft during the 1 September 2002 interval (18:00 to 24:00 UT) in
geocentric solar magnetospheric (GSM) coordinates in the xz, xy and yz planes. Blue represents Cluster 1 (Rumba), green Cluster 2 (Salsa), yellow Cluster 3 (Samba) red Cluster 4 (Tango) and a black cross represents the Polar spacecraft. Solid lines show the Cluster spacecraft paths and dashed lines show the Polar spacecraft’s path. Dotted lines depict the model magnetic field.
The Pi2 pulsations are related to the SCW that forms dur-ing a magnetospheric substorm (e.g. Lester et al., 1983), and thus the onset of Pi2 pulsations may be taken as a proxy for substorm onset (e.g. Rostoker at al., 1980).
The first time of note is 18:23 UT, when Pi2 pulsation on-set occurs at all stations, although only one station, tar, is shown. This is accompanied by a slight increase in the x-component of up to a few tens of nanotesla (nT) at higher latitudes. This indicates either a pseudobreakup or a full sub-storm occurring to the east of the stations. Magnetometer data from the Tixie station of the 210 MM magnetometer network are shown in Fig. 4. At 18:23 UT the Tixie station detects a decrease in the H (north–south) component of the magnetic field from ∼−150 nT to ∼−250 nT. There is also a decrease in the D (east-west) component from ∼510 nT to ∼460 nT. This indicates that a substorm expansion phase on-set occurred at 18:23 UT located in this region, rather than a pseudobreakup.
At 22:40 UT and 22:56 UT the IMAGE data (Fig. 3) in-dicate pseudobreakups at the lower latitude stations, as ev-idenced by Pi2 pulsations in all components but no major electrojet signature at the higher latitudes. At 23:05 UT the full substorm expansion phase onset occurs at the So-dankyl¨a (sod) and Pello (pel) stations, shortly followed by the Kilpisj¨arvi (kil) and Ivalo (iva) stations which are at a slightly higher latitude (and close to the Polar spacecraft’s orbit footprint). Pi2 pulsations are detected at all latitudes in all components. -400 0 -400 0 -500 0 -500 0 -500 0 -500 0 -400 0 -400 0 -150 0 -40 0 -20 0 0 X ( n T ) -2 0 1 fi lt e re d X ( n T ) 1800 1900 2000 2100 2200 2300 0000 UT
1823UT 2240UT 2305UT
IMAGE Magnetometer Array
1st September 2002 tro kev kil lek iva muo sod pel ouj han nur tar tar (Pi2)
Fig. 3. Top panels: x-component of magnetic fields at selected
IM-AGE magnetometer stations; bottom panel: x-component filtered magnetometer data from one example station in the period band 20–200 s.
4220 N. C. Draper et al.: A joint Cluster and ground-based instruments study 18 20 22 24 0 100 200 300 300 400 500 600 700 -300 -200 -100 0 1823U T UT H ( n T ) D ( n T ) Z ( n T )
Fig. 4. 210 MM magnetometer data from the Tixie station in H , Dand Z-components, from 18:00 to 24:00 UT. Substorm onset at 18:23 UT indicated by a vertical dashed line.
-2 0 2 4 6 IM F BXG S M (n T) -6 -4 -2 0 2 4 IM F BYGSM (n T) -6 -4 -2 0 2 IM F BZG S M (n T) 1700 1800 1900 2000 2100 2200 2300 0000 UT 0 2 4 6 8 IM F BTota l (n T)
AC E data lagged by 75 min. 1 September 2002
Advanced Composition Explorer (ACE)
MAG DATA
1823 UT 2240 UT 2305 UT
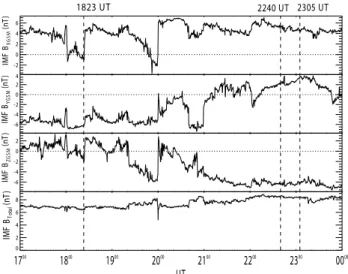
Fig. 5. ACE MAG data lagged by 75 min (in GSM coordinates).
Expansion phase onsets at 18:23 UT and 23:05 UT and a pseudo-breakup at 22:40 UT are indicated by vertical dashed lines.
The magnetograms at higher latitudes show a decrease in the x-component while the lower latitude stations show an increase at substorm onset, which are signatures of the sub-storm onset westward electrojet and the SCW, respectively.
3.2 ACE
The interplanetary magnetic field (IMF) data during this in-terval, measured by the magnetometer (MAG) instrument
SUPERDARN PARAMETER PLOT
Hankasalmi: vel 1 Sep 2002
(244) stereo normal (ccw) scan mode (152)
-800 -600 -400 -200 0 200 400 600 800 V e lo cit y (m s -1 ) G round S catter 66 68 70 72 74 66 68 70 72 74 Beam 2 1800 (244) to 0000 (245) 66 68 70 72 74 M a g n e tic L a tit u d e 66 68 70 72 74 Beam 8 1800 (244) to 0000 (245) 1800 1900 2000 2100 2200 2300 0000 UT 66 68 70 72 74 1800 1900 2000 2100 2200 2300 0000 UT 68 70 72 74 Beam 14 1800 (244) to 0000 (245)
1823UT 2240UT 2305UT
Fig. 6. Range, time and intensity plots for the velocity at three
dif-ferent beams (2, 8 and 14) of the Hankasalmi (Finland) radar dur-ing the 18:00 to 24:00 UT interval. Vertical dashed lines represent times of pseudobreakup at 22:40 UT and expansion phase onsets at 18:23 UT and 23:05 UT.
(Smith et al., 1998) on the Advanced Composition Explorer (ACE) spacecraft (Stone et al., 1998), are presented in Fig. 5 (GSM coordinates). These data have been lagged in order to take into account the time taken by the solar wind to reach the Earth’s magnetopause from where it is measured at the ACE spacecraft. The lag time for this interval was calcu-lated as 75 min, using both magnetic field data from the Mag-netic Fields Measurement (MGF) instrument on the Geotail spacecraft (data not shown) and the technique of Khan and Cowley (1999), from solar wind velocity and density data from the Solar Wind Electron, Proton and Alpha Monitor (SWEPAM) instrument (McComas et al., 1998) on ACE.
In the discussions of the ACE data we quote all times in terms of the lagged time.
Around the first interval at 18:23 UT the (lagged) Bx
com-ponent of the IMF turns positive. Byis negative and
approxi-mately constant at −6 nT, and Bzturns northwards. Btotal re-mained steady near 7 nT during this interval. The Bz
compo-nent of the IMF is southward at around −6 nT for at least two hours prior to substorm onset at 23:05 UT and remains south-ward until after 24:00 UT. From 22:15 UT until 23:45 UT the Bxand Bycomponents of the magnetic field remain
approxi-mately constant and do not change sign, with Bxaround 5 nT
and By around 4 nT. Btotal remains steady near 8 nT during this interval.
3.3 Hankasalmi and Pykkvibær radars
Range-time-velocity plots for three beams (2, 8, 14) of the Hankasalmi radar (Finland) are shown in Fig. 6 for the 18:00 to 24:00 UT interval. The colour scale is such that reds and yellows denote flow away from the radar, and blues and greens flow towards the radar; grey is ground scatter.
N. C. Draper et al.: A joint Cluster and ground-based instruments study 4221
60°
70° 80°
-9 -9 -9
3
SUPERDARN PARAMETER PLOT
1822UT, 1824UT, 1826UT (pre-midnight sector) 1 Sep 2002
(244)
21 MLT 1824UT 1826UT
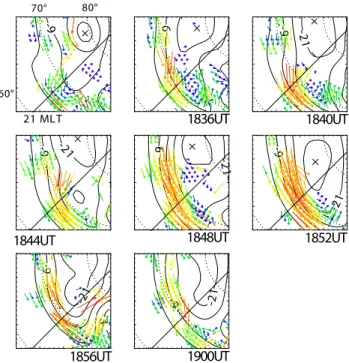
Fig. 7. SuperDARN map potential plots at two-minute intervals
with the true vectors superposed at 18:22, 18:24 and 18:26 UT on 1 September 2002.
In the Hankasalmi data, the western beams (e.g. beam 2) show a series of intensifications of Doppler line-of-sight ve-locity (−400 m/s−1 to −800 m/s−1) away from the radar soon after 18:23 UT, beginning at 18:33 UT, while east-ern beams (e.g. beam 14) show intensification of velocity towards the radar from 18:30 UT (velocities 400 m/s−1 to 600 m/s−1). These are seen in all beams and are similar to the signatures seen by Sandholt et al. (2002), who related them to poleward boundary intensifications (Lyons et al., 1999). The directions of these line-of-sight velocities are consistent with westward ion flow. The direction of flow observed by the radar is subsequently reversed at later times; the change in direction occurs at 19:30 UT in the central beams and from 20:10 UT in the western and eastern beams, indicating that the flows here now become eastward. This is due to the ro-tation of the Earth, and hence the radars are under the flows rather than an actual change in the flow pattern. The outer beams also show velocity intensifications after 20:10 UT that move equatorward over time; they are highly variable and maintained until 22:40 UT. These are signatures of bursty bulk flows (BBFs) in the ionosphere (see Nakamura et al., 2004). After 22:40 UT there is a significant reduction in scat-ter, and from 22:50 UT scatter is lost completely, first from the eastern beams from 22:40 UT and then from the western beams.
The Pykkvibær radar (Iceland east) data (not shown) have intensifications towards the central beams of the radar from 18:45 UT onwards. Exceptionally strong flows toward the radar (600 m/s−1 to 800 m/s−1) are seen in beams 6 to 12 from 19:30 UT onwards. At 22:40 UT there is some inten-sification of flow toward the radar on the northern beams 0 to 7 (velocities 400 m/s−1to 600 m/s−1). This intensification persists until 23:14 UT when it is abruptly lost. After this time much of the scatter is lost such that only ground scatter and some low-velocity scatter remains.
3.4 SuperDARN
The map potential analysis technique (Ruohoniemi and Baker, 1998) for the SuperDARN data was used to map line-of-sight velocity measurements from the Northern Hemisphere radars (Kodiak, Prince George, King Salmon, Pykkvibær, Hankasalmi, Goose Bay, Saskatoon, Kapuskas-ing and Stokkseyri) onto a global grid to provide large-scale
60° 70° 80° -9 -9 -2 1 -9 -21 -9 -21 -9 -21 -9 -21 -9 3 -2 1 -9
SUPERDARN PARAMETER PLOT
1832UT to 1900UT (4-minute intervals; pre-midnight sector)
1 Sep 2002 (244)
21 MLT 1836UT 1840UT
1844UT 1848UT 1852UT
1856UT 1900UT
Fig. 8. SuperDARN map potential plots at four-minute intervals
with the true vectors superposed from 18:32 until 19:00 UT on 1 September 2002. 60° 70° 80° -33 -21 -9 3 15 2 0:0 0 U T 2 1: 00 U T 2 2: 00 U T 2 3: 00 U T -21 -9 3 1 5 2 0:0 0 U T 2 1: 00 U T 2 2: 00 U T 2 3: 00 U T -33 -21 -9 3 1 527 2 0:0 0 U T 2 1: 00 U T 2 2: 00 U T 2 3: 00 U T -21 -9 3 15 2 0:0 0 U T 2 1: 00 U T 2 2: 00 U T 2 3: 00 U T -33 -21 -9 3 15 2 0:0 0 U T 2 1: 00 U T 2 2: 00 U T 2 3: 00 U T -33 -21 -9 3 15 2 0:0 0 U T 2 1: 00 U T 2 2: 00 U T 2 3: 00 U T -21 -9 3 15 2 0:0 0 U T 2 1: 00 U T 2 2: 00 U T 2 3: 00 U T -21 -9 3 15 15 2 0:0 0 U T 2 1: 00 U T 2 2: 00 U T 2 3: 00 U T -9 3 15 2 0:0 0 U T 2 1: 00 U T 2 2: 00 U T 2 3: 00 U T
SUPERDARN PARAMETER PLOT
2240UT to 2256UT (2-minute intervals; midnight sector)1 Sep 2002 (244)
0 MLT 18 MLT
2242UT 2244UT
2246UT 2248UT 2250UT
2252UT 2254UT 2256UT
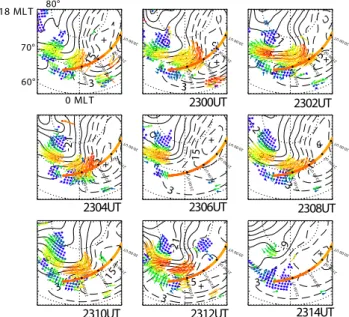
Fig. 9. SuperDARN map potential plots at two-minute intervals
with the true vectors superposed from 22:40 until 22:56 UT on 1 September 2002 and with Cluster 1 footprint also superposed.
global convection maps for the interval of interest. Super-DARN map potential plots presented here show pre-midnight (Figs. 7 and 8) and post-midnight (Figs. 9 and 10) sector sec-tions of large-scale convection maps and so-called true vec-tors (see Ruohoniemi and Baker, 1998), derived from line-of-sight data from the SuperDARN radars for times of interest near each of the substorm expansion phase onsets.
4222 N. C. Draper et al.: A joint Cluster and ground-based instruments study 60° 70° 80° -9 3 15 2 0:0 0 U T 2 1: 00 U T 2 2: 00 U T 2 3: 00 U T -9 3 15 2 0:0 0 U T 2 1: 00 U T 2 2: 00 U T 2 3: 00 U T -21 -9 3 15 2 0:0 0 U T 2 1: 00 U T 2 2: 00 U T 2 3: 00 U T -21 -9 3 15 2 0:0 0 U T 2 1: 00 U T 2 2: 00 U T 2 3: 00 U T -9 3 15 2 0:0 0 U T 2 1: 00 U T 2 2: 00 U T 2 3: 00 U T -21 -9 3 15 2 0:0 0 U T 2 1: 00 U T 2 2: 00 U T 2 3: 00 U T -9 3 15 2 0:0 0 U T 2 1: 00 U T 2 2: 00 U T 2 3: 00 U T -21 -9 3 15 2 0:0 0 U T 2 1: 00 U T 2 2: 00 U T 2 3: 00 U T -9 3 2 0:0 0 U T 2 1: 00 U T 2 2: 00 U T 2 3: 00 U T
SUPERDARN PARAMETER PLOT
2258UT to 2314UT (2-minute intervals; midnight sector) 1 Sep 2002
(244)
18 MLT
0 MLT 2300UT 2302UT
2304UT 2306UT 2308UT
2310UT 2312UT 2314UT
Fig. 10. SuperDARN map potential plots at two-minute intervals
with the true vectors superposed from 22:58 until 23:14 UT on 1 September 2002 and with Cluster 1 footprint also superposed.
C LUS T E R 1 (R umba) -10 0 10 20 30 40 50 BXG S M (n T ) -10 0 10 20 30 40 50 BXG S M (n T ) -20 -10 0 10 20 BY G S M (n T ) -20 -10 0 10 20 BY G S M (n T ) -10 0 10 20 BZ G S M (n T ) -10 0 10 20 BZ G S M (n T ) 1800 1830 1900 1930 2000 2030 2100 2130 2200 2230 2300 2330 0000 UT -10 0 10 20 30 40 50 BT o ta l (n T ) 1800 1830 1900 1930 2000 2030 2100 2130 2200 2230 2300 2330 0000 UT -10 0 10 20 30 40 50 BT o ta l (n T )
1823UT 1910UT 2240UT 2305UT
CLUSTER
Fluxgate Magnetometer (FGM)
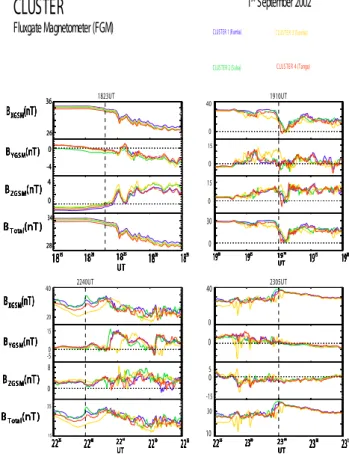
Fig. 11. Cluster FGM data for 1 September 2002 (18:00 to
24:00 UT interval). The Bx, By, Bz-components and Btotalin GSM
coordinates are shown for the Cluster 1 spacecraft (Rumba).
The Cluster footprint is shown where it is within the map limits (Figs. 9 and 10 only).
Dotted black lines depict constant latitude and MLT, while dashed and solid black lines depict contours of potential. The true vectors shown are colour-coded by magnitude such that slower velocities are blue and faster velocities are red.
The map potential plots in Fig. 7 show that at 18:24 UT (21 MLT, 60◦ to 80◦ section of plot shown) there is an in-tensification of the velocity in the 20 MLT, 65◦ to 70◦ lati-tude region, to a velocity of 800 m/s−1. From 18:32 UT until 19:00 UT (Fig. 8) there are strong westward flows in the pre-midnight sector (21 MLT, 60◦to 80◦section of plot shown). Figure 9 (00 MLT, 60◦to 80◦section of plot shown) shows enhancements in flows from 22:40 UT until 22:56 UT in the midnight sector (00 MLT), just equatorward of the estimated footprint of the Cluster spacecraft at that same time. In par-ticular there are intensifications of the velocity at 22:42 and 22:52 UT. These intensifications occur at 65◦to 75◦latitude,
and reach values of 1000 m/s−1. From 22:58 UT strong, anti-sunward flows continue in the 00 MLT region, as can be seen in Fig. 10, centred around 65◦ to 75◦latitude, to a velocity of around 1000 m/s−1 (00 MLT, 60◦ to 80◦ section of plot shown). This is maintained until 23:12 UT to a velocity of 800 m/s−1, after which the scatter is lost. Particularly strong flows occur at 23:04 UT.
3.5 Cluster FGM
Figure 11 presents the Cluster FGM data for the 18:00 to 24:00 UT interval for the GSM Bx, By, Bzcomponents and
Btotalat Cluster 1 (Rumba). In the ∼20 min prior to the first substorm expansion phase at 18:23 UT, the field is dominated by the x-component, with both y and z components small, with values ∼1 nT, although we note that the z-component is negative. The x-component and hence total field both in-crease up to the time of expansion phase onset. Following the substorm expansion phase onset at 18:23 UT, there is a small reduction in Bx and Btotal, and Bz changes sign from
negative to positive.
The field magnitude reduces from ∼34 nT to ∼28 nT over an interval of ∼15 min, and is then steady until ∼19:10 UT. There is then a major reduction in the field, almost to zero magnetic field, which lasts for a few minutes before recover-ing to a value of 25 nT. After this the magnetic field is highly variable, indicative of the spacecraft being in the plasma sheet at this time. From 22:00 UT the magnetic field gener-ally increases mainly due to an increase in Bx. At 22:40 UT,
the time of the first pseudobreakup in the second growth phase, there is a small increase in Btotal. At 23:05 UT there begins a reduction in the field magnitude by a factor of two over the next hour. After 23:45 UT, the Bx and Bz
com-ponents become comparable in magnitude, ∼10 nT. There is also a second brief interval when total field approaches 0 nT, at 23:53 UT.
N. C. Draper et al.: A joint Cluster and ground-based instruments study 4223 Figure 12 shows the Cluster FGM data for four 20-min
in-tervals which encompass the times of interest: the expansion phase onsets at 18:23 and 23:05 UT, the pseudobreakup at 22:40 UT and a new time of interest, 19:10 UT.
Again, data are plotted in GSM for the Bx, By, Bz
compo-nents and Btotal, and data from the four Cluster spacecraft are colour coded, as indicated on Fig. 12. In the first panel (upper left), the field is approximately constant until 18:21 UT after which it starts to decrease. From 18:25 UT this decrease is quicker and occurs at all spacecraft simultaneously, indicat-ing a temporal, rather than a spatial, change in the magnetic field at the Cluster spacecraft at that time. There is also evi-dence of wave activity initiated at the onset, as Pi2 waves are present from this time.
At 19:10 UT (upper right panel) the FGM data show a sudden and brief excursion whereby all components briefly approach 0 nT, then return to approximately their previous values. This occurs in the order Cluster 4, then Cluster 1 and Cluster 2, then finally Cluster 3, and so indicates that the spacecraft are encountering a structure in the magnetic field, rather than there being some temporal change in the mag-netic fields at that time. The spacecraft exit the structure in the same order as they enter. This indicates that the structure moves completely over the four spacecraft. As the magnetic field is very close to zero, this would indicate that the space-craft are in a diamagnetic cavity. The order in which the spacecraft encounter and leave this structure indicates that it is coming in from the tail towards the Earth. It is also mov-ing down on to the spacecraft, in the negative z-direction, as the Cluster 3 spacecraft has the smallest GSM z-value. This feature is the subject of further work (see Draper et al., 2004) and will not be discussed in detail in this paper.
At 22:40 UT (lower left panel) the FGM data show a peak in Bxwhich decreases from ∼34 nT at 22:44 UT to ∼24 nT
at 22:50 UT, simultaneously at Cluster 1, Cluster 2 and Clus-ter 4, with ClusClus-ter 3 exhibiting broadly similar behaviour during this interval, but not following the other spacecraft as exactly. This is perhaps due to Cluster 3 being closer to the current sheet than the other three spacecraft. The By
com-ponent also decreases from ∼15 nT at 22:44 UT to ∼0 nT at 22:50 UT.
However, at Cluster 3 the decrease in the By component
lags that at the other spacecraft by a few minutes.
At 23:05 UT (lower right panel) the Bxcomponent of the
magnetic field reaches a peak at around 38 nT then decreases at all spacecraft simultaneously. Again, Cluster 3 shows slightly different variations but in general the agreement be-tween the other spacecraft is very close. The Bycomponent
begins a gradual decrease from ∼0 nT at this time, while the Bz component begins a gradual increase in ∼−4 nT. Btotal begins to decrease from ∼38 nT, following the dominant Bx
-component, and decreases by a factor of two over the next hour. This reduction is seen at all spacecraft and so is a fea-ture that occurs over the scale size of the spacecraft separa-tion. In all components there are fewer high-frequency os-cillations during this time, indicating that the spacecraft may have exited the plasma sheet and re-entered the lobe. This
36 BXGSM(nT) 36 BXGSM(nT) BXGSM(nT) BXGSM(nT) BXGSM(nT) 26 BXGSM(nT) 26 BXGSM(nT) BXGSM(nT) BYGS M(nT) BYGS M(nT) BYGS M(nT) BYGS M(nT) BYGS M(nT) BYGS M(nT) -4 0 BYGS M(nT) -4 0 BYGS M(nT) BZGS M(nT) BZGS M(nT) BZGS M(nT) BZGS M(nT) BZGS M(nT) BZGS M(nT) 0 4 BZGS M(nT) 0 4 BZGS M(nT) 1815 1820 1825 1830 1835 UT BTotal(nT) 1815 1820 1825 1830 1835 UT BTotal(nT) 1815 1820 1825 1830 1835 UT BTotal(nT) 1815 1820 1825 1830 1835 UT BTotal(nT) 1815 1820 1825 1830 1835 UT BTotal(nT) 1815 1820 1825 1830 1835 UT BTotal(nT) 1815 1820 1825 1830 1835 UT 28 34 BTotal(nT) 1815 1820 1825 1830 1835 UT 28 34 BTotal(nT) 1823UT CLUSTER 1 (Rumba) CLUSTER 2 (Salsa) CLUSTER 3 (Samba) CLUSTER 4 (Tango) 0 40 0 15 0 15 1900 1905 1910 1915 1920 UT 1900 1905 1910 1915 1920 UT 1900 1905 1910 1915 1920 UT 1900 1905 1910 1915 1920 UT 1900 1905 1910 1915 1920 UT 1900 1905 1910 1915 1920 UT 1900 1905 1910 1915 1920 UT 1900 1905 1910 1915 1920 UT 0 30 1910UT 20 40 -50 15 0 8 2235 2240 2245 2250 2255 UT 2235 2240 2245 2250 2255 UT 2235 2240 2245 2250 2255 UT 2235 2240 2245 2250 2255 UT 2235 2240 2245 2250 2255 UT 2235 2240 2245 2250 2255 UT 2235 2240 2245 2250 2255 UT 2235 2240 2245 2250 2255 UT 15 35 2240UT 0 40 0 -15 0 5 2255 2300 2305 2310 2315 UT 2255 2300 2305 2310 2315 UT 2255 2300 2305 2310 2315 UT 2255 2300 2305 2310 2315 UT 2255 2300 2305 2310 2315 UT 2255 2300 2305 2310 2315 UT 2255 2300 2305 2310 2315 UT 2255 2300 2305 2310 2315 UT 10 30 2305UT
CLUSTER
Fluxgate Magnetometer (FGM) 1 September 2002st BXGSM(nT) BXGSM(nT) BXGSM(nT) BXGSM(nT) BXGSM(nT) BXGSM(nT) BXGSM(nT) BXGSM(nT) BYGS M(nT) BYGS M(nT) BYGS M(nT) BYGS M(nT) BYGS M(nT) BYGS M(nT) BYGS M(nT) BYGS M(nT) BZGS M(nT) BZGS M(nT) BZGS M(nT) BZGS M(nT) BZGS M(nT) BZGS M(nT) BZGS M(nT) BZGS M(nT) BTotal(nT) BTotal(nT) BTotal(nT) BTotal(nT) BTotal(nT) BTotal(nT) BTotal(nT) BTotal(nT)Fig. 12. Cluster FGM data for 1 September 2002 in the Bx, By, Bz
and BtotalGSM coordinates for intervals centred on 18:23, 19:10,
22:40 and 23:05 UT. Cluster 1 (Rumba) is shown in blue, Cluster 2 (Salsa) in green, Cluster 3 (Samba) in yellow and Cluster 4 (Tango) in red.
is now corroborated in the Cluster plasma data from CIS, PEACE and RAPID.
3.6 Cluster plasma data
The top six panels of Fig. 13 show the CIS ion density and velocity data from three spacecraft, Cluster 1, Cluster 3 and Cluster 4 for this interval. Note that the CIS instrument on Cluster 2 was not operational at the time. Prior to 19:03 UT (indicated by the second vertical dashed black line on plot) all three spacecraft measure low ion densities of ∼0.01 cm−3. At 19:03 UT there is an increase in the low-energy ion den-sities at all spacecraft to ∼0.1 cm−3 at Cluster 1 and Clus-ter 3, and to ∼1.0 cm−3 at Cluster 4. This is accompa-nied by a sharp increase in the vxcomponent of the velocity
from ∼0 km/s−1to ∼1000 km/s−1, with some fluctuations. This indicates bursty flow towards Earth which continues un-til 19:15 UT. At 23:05 UT there is a sharp decrease in the density at all spacecraft, returning to ∼0.01 cm−3. These data indicate that the spacecraft are in the plasma sheet from 19:03 UT until the second substorm onset at 23:05 UT, con-sistent with the FGM data, and in the lobe before 19:03 UT and after 23:05 UT.
4224 N. C. Draper et al.: A joint Cluster and ground-based instruments study C LUS T E R 1 (R umba) 0.01 0.10 1.00 10.00 Ni (cm-3) C LUS T E R 1 (R umba) -5000 1000 VX GS E(km s-1) 500 C LUS T E R 3 (S amba) C LUS T E R 3 (S amba) C LUS T E R 4 (T ango) C LUS T E R 4 (T ango) 1800 1900 2000 2100 2200 2300 0000 UT
1823UT 1903UT 2240UT 2305UT
Cluster CIS and PEACE
1st September 2002 -5000 1000 VY GS E(km s-1) 500 -5000 1000 VZ GS E(km s-1) 500 0.01 0.10 1.00 10.00 Ni (cm-3) -5000 1000 VX GS E(km s -1) 500 -5000 1000 VY GS E(km s-1) 500 -5000 1000 VZ GS E(km s-1) 500 0.01 0.10 1.00 10.00 Ni (cm-3) -5000 1000 VX GS E(km s -1) 500 -5000 1000 VY GS E(km s-1) 500 -5000 1000 VZ GS E(km s -1) 500 1800 1900 2000 2100 2200 2300 0000 UT Ne (cm -3) P E AC E : C LUS T E R 4 (T ango) 0.01 0.10 1.00
Fig. 13. Top six panels: Cluster CIS density and velocity data from
the three spacecraft for 1 September 2002 (18:00 to 24:00 UT inter-val). Bottom panel: Cluster PEACE density data from Cluster 4 for the same interval.
The bottom panel of Fig. 13 shows the PEACE electron density data from Cluster 4 for this interval. Data from this spacecraft are shown as the ASPOC (Riedler et al., 1997) spacecraft potential control device is switched on in order to avoid interference by photoelectrons, thereby making the density data more reliable. At around 19:03 UT the low-energy electron density at Cluster 4 begins to increase from ∼0.01 cm−3to ∼0.1 cm−3at 19:10 UT. This higher density is maintained until 23:05 UT when there is a sudden decrease back to ∼0.01 cm−3. This is also consistent with Cluster be-ing located in the plasma sheet durbe-ing this interval. Analysis of the plasma sheet boundary layer (PSBL) crossings using PEACE data indicates that at 19:03 UT the unit normal of the boundary was (0.01, −0.56, 0.83) in GSE coordinates, with
Fig. 14. First four panels: Cluster RAPID IES data for 1 September
2002 (18:00 to 24:00 UT interval). Bottom panel: Polar CEPPAD IES data for the same interval.
a velocity along the normal of 30 km/s−1. This was for a crossing from the lobe into the plasma sheet which occurred in the direction expected given the orientation of the space-craft. At 23:05 UT the spacecraft re-entered the lobe from the plasma sheet, with a corresponding unit normal of (0.02, −0.34, −0.94) and normal velocity component 38 km/s−1.
The RAPID-IES omni-directional electron flux data are shown in Fig. 14 (first four panels). The IES shows that the flux of electrons in the 40–400 keV range increases by sev-eral orders of magnitude in the interval 19:03 UT to 23:05 UT (with fluctuations). The IIMS data (not shown) indicate that the flux of protons in the 30–100 keV range increases during the same interval. This is also consistent with Cluster being in the plasma sheet from 19:03 UT until 23:05 UT.
From 22:40 UT there is a reduced electron flux, suggesting growth phase effects are now present at the Cluster space-craft. At 23:05 UT there is a sharp decrease at all energy levels at all four spacecraft as they exit the plasma sheet into the lobe.
3.7 Polar CEPPAD
To have an idea of the particle populations closer to Earth for this interval, data from the Polar CEPPAD-IES, which is virtually identical to the RAPID-IES on Cluster, were used. The data are shown in the bottom panel of Fig. 14.
N. C. Draper et al.: A joint Cluster and ground-based instruments study 4225 Polar at this time is located at 9 RE downtail, in the
post-midnight sector. The CEPPAD-IES data show a decrease in the electron count rate in the same energy range as the RAPID data from 22:40 UT. This drop-out is indicative of the plasma sheet thinning and growth phase. This is followed by a sudden plasma injection at 23:05 UT, indicating expansion phase onset.
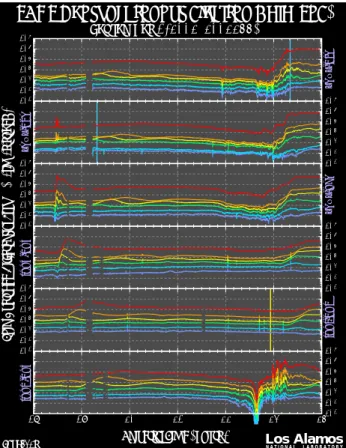
3.8 LANL geosynchronous energetic particle data
The low energy electron data from the LANL geosyn-chronous spacecraft (Fig. 15) indicate that a dispersion-less injection of plasma occurs at geosynchronous orbit (∼6.6 RE) at ∼18:27 UT. This is detected by two of the
LANL spacecraft, which at this time are located in the post-midnight sector, close to the geographic equator.
This plasma injection into the magnetotail is consis-tent with a substorm expansion phase onset occurring at 18:23 UT. There is also a plasma injection in the midnight sector at geosynchronous orbit around the time of the second substorm at 23:05 UT, also detected by the LANL spacecraft.
4 Discussion
A number of events were observed during this interval which are seen by many different instruments, both ground-based and space-based, which helps to build an accurate picture of what is happening in both the magnetosphere and ionosphere simultaneously during the two substorm expansion phases described above.
The first substorm expansion onset occurred at 18:23 UT, at which time the Cluster plasma instruments demonstrate that the spacecraft are in the tail lobe. There is a dispersion-less plasma injection at 18:27 UT in the post-midnight sec-tor of the magnetotail at geosynchronous orbit, detected by two of the LANL spacecraft, consistent with substorm on-set. The magnitude of the onset signature is weak due to the displacement of the stations from the onset location. This is consistent with the few minutes delay between the ground magnetometer signature and the plasma injection at geosyn-chronous orbit.
Also, a substorm signature is seen at Cluster in the FGM data at 18:25 UT, with a simultaneous reduction in both the total magnetic field and in Bx at all spacecraft, indicating
a temporal change in the magnetic field. The onset region is located to the east of the IMAGE ground magnetometer stations, at the location of the Tixie magnetometer station, where a clear substorm onset signature is detected. We thus define this as a substorm expansion phase rather than pseu-dobreakup. The Cluster spacecraft at this time are located at (−16, −1, 5) REin GSM coordinates. FGM Bzalso changes
sign from negative to positive at expansion phase onset and since no plasma sheet signature is seen in the plasma data, this is interpreted as a major re-orientation of the lobe field. Although the Cluster spacecraft are not in the optimum posi-tion for the measurement of a substorm onset, the detecposi-tion
Los AlamosN A T I O N A L L A B O R A T O R Y
LANL Geosynchronous Electron Data (LoE)
September 1, 2002 (2002244)
Tavg: 10s
Spin-Averaged Differential Flux ( #/cm²/s/sr/keV )
LANL-01A 101 102 103 104 105 106 107 LANL-02A 101 102 103 104 105 106 107 LANL-97A 101 102 103 104 105 106 107 1994-084 101 102 103 104 105 106 107 1991-080 101 102 103 104 105 106 107 18 19 20 21 22 23 24
Universal Time ( hours )
1990-095 101 102 103 104 105 106 107
Fig. 15. LANL low energy electron data from the SOPA instrument
are shown for 1 September 2002 (18:00 to 24:00 UT interval).
of these signatures at onset indicates that this event is a large-scale feature. The IMF Bx, Byand Bzcomponents fluctuate
during this time; in particular, both Bzand Bxturn positive at
18:23 UT. The northward turning of IMF Bzwill decrease the
rate of dayside reconnection, but wider implications cannot be drawn from this single data set. Due to the substorm ex-pansion phase onset, the magnetic field in the tail decreases from 18:23 UT. Hence, the reconnection at the dayside is less than in the magnetotail.
A brief enhancement of the ionospheric sunward flow near 70◦magnetic latitude and 20 MLT accompanies expansion phase onset at ∼18:23 UT but a more significant enhance-ment of the sunward flow is seen some 5 to 10 min after ex-pansion phase onset. A series of enhancements at the pole-ward edge of the scatter at the Hankasalmi radar are seen over the next 60 min or so. Such enhancements have been discussed by Sandholt et al. (2002), who observed 6 dis-crete poleward boundary intensifications (PBIs) of the au-roral oval during a substorm event occurring on the 12 De-cember 1999. These were identified by an equatorward ex-pansion of equatorward flow in the late exex-pansion phase us-ing the Hankasalmi (Finland) SuperDARN radar, as is also seen in the late expansion phase of the first substorm after 18:23 UT. Sandholt and co-workers concluded that bursty bulk flows (BBFs) from the magnetic reconnection site may be a phenomena of late substorm expansion phase, resulting
4226 N. C. Draper et al.: A joint Cluster and ground-based instruments study in the auroral and convection events seen at that time, and
which may perhaps account for the flow enhancements seen in this particular event.
We see no evidence for BBFs in the Cluster data at this time, which is probably due to the Cluster spacecraft being in the northern tail lobe. Therefore we are unable to con-firm the interpretation by Sandholt et al. the radar signatures from this event. We note, however, that the flow enhance-ments observed by the radars do not have coincident mag-netic signatures which are characteristic of poleward bound-ary intensifications (Lyons et al., 1999). This suggests that either these flow enhancements are not related to PBIs or the magnetic signature is too weak and/or too localized to be de-tected by the IMAGE magnetometers in this case. We also note the lack of lobe signatures associated with the radar flow enhancements, unlike the signature in the lobe at expansion phase onset.
At 19:03 UT the CIS data show that the low-energy ions increase their x-component of velocity (flow towards Earth), which is maintained until 19:15 UT. This is a signature of ion beams in the PSBL (Eastman et al., 1984), indicating that the Cluster spacecraft cross the PSBL. The low-energy ion density also increases at 19:03 UT, and is maintained until 23:05 UT. The PEACE data similarly show an increase in the density of low-energy electrons from 19:03 UT. The density reaches its maximum value at 19:10 UT, and remains there until 23:05 UT when there is a sudden decrease in density. Moreover, the RAPID data show an increase in the number of high-energy electrons and ions from 19:03 UT, until a sudden decrease at 23:05 UT. RAPID and PEACE data are both con-sistent with the Cluster spacecraft entering the plasma sheet after crossing the PSBL and remaining there until 23:05 UT when they suddenly re-enter the lobe. The unit normal at which the spacecraft cross the PSBL into the plasma sheet at 19:03 UT indicates that it is inclined mainly in the y − z plane, with a negative y-component. The boundary is trav-elling at 30 km/s−1which is slower than typical values (De-whurst et al., 2004).
Pseudobreakups are seen by the IMAGE ground magne-tometers at 22:40 and 22:56 UT prior to the second expansion phase onset. The IMF as seen at ACE (lagged by 75 min) has been southward from around 20:55 UT (and remains south-wards until after 24:00 UT), and all components have been approximately constant from 22:15 UT (and remain so until around 23:45 UT). Scatter from the Hankasalmi radar be-gins to be lost following the first pseudobreakup, first from the eastern beams and finally from the western beams by 23:00 UT, after which no further scatter is seen in the Han-kasalmi radar data. The Pykkvibær radar shows an inten-sification of westward flow (toward the radar) at 22:40 UT, maintained until 23:14 UT after which scatter is also lost. At 22:42 UT and 22:52 UT the SuperDARN data show in-tensifications in the flow in the midnight sector at 65◦ to 75◦ latitude and these enhanced flows are associated with the pseudobreakups. The Cluster FGM data show a peak in the Bx component of the magnetic field at Cluster 1, 2
and 4 at 22:40 UT, which decreases simultaneously at all
spacecraft from 22:44 UT until 22:50 UT. The Bycomponent
also decreases from 22:44 UT, until 22:50 UT. This feature shows some variability in its velocity as it moves towards the 01 MLT region. Furthermore, Polar CEPPAD data shows a dropout in the near-Earth particle populations at ∼22:40 UT, the time of the first pseudobreakup.
A full substorm onset occurs at 23:05 UT, as seen at the IMAGE magnetometer stations. At this time, Pi2 pulsations commence at all latitudes, in all components of the mag-netic field. The higher latitude stations show a decrease in the Bx component as expected at substorm onset, while the
lower latitude stations show an increase in the Bx
compo-nent, indicative of the SCW. Onset is detected at stations equatorward of the ionospheric projection of the Polar space-craft’s path first, followed by stations in its path. This im-plies that the onset location in the tail was earthward of the Polar spacecraft. The Hankasalmi radar has lost much of the ionospheric scatter at this time, but the SuperDARN map potential data indicate that there are intensified flows from 22:58 UT in the 00 MLT, 65◦to 75◦latitude region. This is maintained, with some further intensification, until 23:12 UT after which the ionospheric scatter is completely lost in the midnight sector. The strongest flows during this time are now poleward of the location of the flows during pseudo-breakups. The x-component of the magnetic field at all Clus-ter spacecraft reaches a peak at 23:05 UT, then decreases at all spacecraft simultaneously such that over the next hour it decreases by a factor of two. The Bycomponent also begins
to decrease at this time, while the Bz component increases.
Also, there are fewer fluctuations in the magnetic field from 23:05 UT. This is indicative of the dipolarization of the mag-netotail and reduction in field magnitude at the expansion phase onset, consistent with the indication from the Cluster particle data that the spacecraft re-enter the lobe at 23:05 UT. However, the plasma data show no signature for the PSBL at 23:05 UT, indicating that either the exit to the lobe oc-curred more rapidly than the entry or there were no flows in the PSBL at this time. The near-Earth Polar CEPPAD data also show a plasma injection at 23:05 UT, consistent with substorm onset. The LANL geosynchronous spacecraft also show a plasma injection at this time. The unit normal at which the Cluster spacecraft cross the PSBL to return to the lobe indicates that it is inclined mainly in the y-z plane, with both y and z-components negative. The boundary is travel-ling at 38 km/s−1which is faster than the previous entry but again slower than typical values previously found (Dewhurst et al., 2004).
It is interesting to note that the magnetic field in the mag-netotail lobe decreases from 23:05 UT despite that the IMF as seen at ACE remains steady and southward. This implies that magnetic flux is being lost from the magnetotail due to tail reconnection faster than it is being replaced by reconnec-tion at the dayside magnetopause, as in the earlier substorm.
N. C. Draper et al.: A joint Cluster and ground-based instruments study 4227
5 Summary and conclusions
The first substorm event at 18:23 UT on the ground indicates that the ground-based magnetometers see the substorm event first, followed by the Cluster spacecraft, two of the geosyn-chronous LANL spacecraft and ionospheric radars, respec-tively. The Cluster spacecraft at this time are not ideally placed to observe substorm signatures in the tail, being in the lobe, and well away from the plasma sheet. Nevertheless, the Cluster spacecraft detect a substorm signature in the lobe as demonstrated by the FGM data presented above. The loss of flux in the lobe occurs at the substorm expansion phase onset, indicating that reconnection either began at expansion phase onset or had begun somewhat earlier. Reconnection at the dayside is reduced. Furthermore, we estimate that recon-nection lasted only for the first 15 min or so of the expansion phase, corresponding to the time during which magnetic flux in the magnetotail was decreasing. This indicates that the ef-fects of the substorm at the location of the Cluster spacecraft, in the post-midnight sector of the lobe region of the magne-totail, were of relatively short duration.
The second substorm onset at 23:05 UT is seen simulta-neously on the ground, in the magnetotail and at the Polar spacecraft’s near-Earth position. The response in the iono-sphere takes one minute longer to develop than at the space-craft. The implication that reconnection takes place within the Polar orbit at 9 RE downtail needs further study, as this
value is much closer to Earth than the accepted location of the NENL at 20 to 30 RE downtail. The Cluster spacecraft
cross the PSBL very rapidly, such that the signature in the particle data shows only their exit to the lobe. While in the lobe, magnetic flux is again lost, which implies that recon-nection is taking place but over a much longer time scale. Dipolarization takes place at 23:05 UT, which indicates that reconnection must be taking place at the NENL at this time. This means that information propagation must be from the NENL towards Earth, as there would not be sufficient time for information to be propagated from the inner current sheet to the NENL and back again, given the timings presented here. Thus, this event would appear to better fit the NENL model for substorm onset than the CCI model.
In both events enhanced ionospheric flows occur follow-ing the expansion phase and in the case of the second event in association with the pseudobreakup. There is a major dif-ference between the location of the flows stimulated by the pseudobreakup and expansion phase in terms of their loca-tion, the former located equatorward of the latter. This re-quires further study to see if this is repeatable.
Acknowledgements. The authors would like to thank the PIs of
the SuperDARN radars from which data have been presented; the Cluster Principal Investigators for the FGM (A. Balogh), CIS (H. R`eme), PEACE (A. Fazakerley) and RAPID (P. Daly) instruments; the institutes who maintain the IMAGE magnetometer array and also the Principal Investigator institute for IMAGE, the Finnish Meteorological Institute; the Solar-Terrestrial Environment Labo-ratory, Nagoya University for construction of 210 MM database and CPMN project of Kyushu University for providing the Tixie
data; the ACE MAG instrument team, N. Ness at the Bartol Re-search Institute and CDAWeb for providing the ACE MAG data; and M. G. Henderson for providing LANL data. During this study J. A. Wild, G. Provan and A. Grocott were supported by PPARC grant PPA/G/O/2001/00014. S. E. Milan was supported by PPARC grant number PPA/N/2000/00197. S. W. H. Cowley was supported by PPARC Senior Fellowship grant PPA/N/S/2000/00197. N. C. Draper was funded by a University of Leicester postgraduate stu-dentship. M. Lester was partly supported by the Institute of Ad-vanced Study, La Trobe University during the preparation of this manuscript.
Topical Editor T. Pulkkinen thanks T. S. Hsu and another referee for their help in evaluating this paper.
References
Akasofu, S.-I.: The development of the auroral substorm, Planet. Space Sci., 12, 273–282, 1964.
Baker, D. N., Pulkkinen, T. I., Angelopoulos, V., Baumjohann, W., and McPherron, R. L.: Neutral line model of substorms: Past results and present viewJ. Geophys. Res., 101, 12 975–13 010, 1996.
Balogh, A., Dunlop, M. W., Cowley, S. W. H., Southwood, D. J., Thomlinson, J. G., Glassmeier, K.-H., Musmann, G., L¨uhr, H., Buchert, S., Acu˜na, M. H., Fairfield, D. H., Slavin, J. A., Riedler, W., Shwingenschuh, K., and Kivelson, M. G.: The Cluster mag-netic fields investigation Space Sci. Rev., 79, 65–91, 1997. Blake, J. B., Fennell, J. F., Friesen, L. M., Johnson, B. M.,
Kolasin-ski, W. A., Mabry, D. J., Osborn, J. V., Penzin, S. H., Schnauss, E. R., Spence, H. E., Baker, D. N., Belian, R., Fritz, T. A., Ford, W., Laubscher, B., Stiglich, R., Baraze, R. A., Hilsenrath, M. F., Imhof, W. L., Kilner, J. R., Mobilia, J., Voss, H. D., Korth, A., Gull, M., Fischer, K., Grande, M., and Hall, D., CEPPAD: Comprehensive Energetic Particle and Pitch Angle Distribution Experiment on POLAR Space Sci. Rev., 71, 531, 1995. Chao, J. K., Kan, J. R., Lui, A. T. Y., and Akasofu, S. I.: A model
for thinning of the plasma sheet, Planet. Space Sci., 25 (8), 703– 710, 1977.
Dewhurst, J. P., Owen, C. J., Fazakerley, A. N., and Balogh, A.: Thinning and Expansion of the Substorm Plasma Sheet: Cluster PEACE Timing Analysis, Ann. Geophys., in press, 2004. Draper, N. C., Lester, M., Cowley, S. W. H., Bosqued, J.-M.,
Gro-cott, A., Wild, J. A., Bogdanova, Y., Fazakerley, A. N., and Davies, J. A.: Cluster observations of a magnetic field cavity in the plasma sheet, Adv. Space Res., in press, 2004.
Eastman, T. E., Frank, L. A., Peterson, W. K., and Lennartsson, W.: The plasma sheet boundary layer, J. Geophys. Res., 89, 1553– 1572, 1984.
Escoubet, C. P., Russel, C. T., and Schmidt, R.: The Cluster and Phoenix Missions. Space Science Reviews, 79, 1997.
Greenwald, R. A., Baker, K. B., Dudeny, J. R., Pinnock, M., Jones, T. B., Thomas, E. C., Villain, J.-P., Cerisier, J.-C., Senior, C., Hanuise, C., Hunsucker, R. D., Sofko, G., Koehler, J., Nielsen, E., Pellinen, R., Walker, A. D. M., Sato, N., and Yamagishi, H.: Darn/SuperDARN: a global view of the dynamics of high-latitude convectionSpace Sci. Rev., 71, 761–796, 1995. Johnstone, A. D., Alsop, C., Burge, S., Carter, P. J., Coates, A.
J., Coker, A. J., Fazakerley, A. N., Grande, M., Gowen, R. A., Gurgiolo, C., Hancock, B. K., Narheim, B., Preece, A., Sheather, P. H., Winningham, J. D., and Woodliffe, R. D.: Peace: A Plasma
4228 N. C. Draper et al.: A joint Cluster and ground-based instruments study
Electron and Current ExperimentSpace Sci. Rev. 79, 351–398, 1997.
Khan, H. and Cowley, S. W. H.: Observations of the response time of high-latitude ionospheric convection to variations in the in-terplanetary magnetic field using EISCAT and IMP-8 data Ann. Geophys., 17, 1306, 1999.
Lester, M., Hughes, W. J., and Singer, H. J.: Polarization patterns of Pi2 magnetic pulsations and the substorm current wedge J. Geophys. Res., 88, 7958–7966, 1983.
Lui, A. T. Y.: Current disruption in the Earth’s magnetosphere: Observations and models J. Geophys. Res., 101, 13 067–13 088, 1996.
Lyons, L. R., Nagai, T., Blanchard, G. T., Samson, J. C., Yamamoto, T., Mukai, T., Nishida, A., and Kokubun, S.: Association be-tween geotail plasma flows and auroral poleward boundary in-tensifications observed by CANOPUS photometers, J. Geophys. Res., 104, 4485, 1999.
McComas, D. J., Bame, S. J., Barker, P., Feldman, W. C., Phillips, J. L., Riley, P., and Griffee, J. W.: Solar wind electron proton alpha monitor (SWEPAM) for the Advanced Composition Ex-plorer Space Sci. Rev., 86, 563, 1998.
McPherron, R. L.: Growth phase of magnetospheric substorms, J. Geophys. Res., 75, 5592, 1970.
McPherron, R. L., Russell, C. T., and Aubry, M. P.: Satellite studies of magnetospheric substorms on 15 August 1968, 9, Phenomeno-logical model for substorms J. Geophys. Res., 78, 3131–3149, 1973.
Nagai, T., Fujimoto, M., Saito, Y., Machida, S., Terasawa, T., Naka-mura, R., Yamamoto, T., Mukai, T., Nishida, A., and Kokubun, S.: Structure and dynamics of magnetic reconnection for sub-storm onsets with Geotail observations, J. Geophys. Res., 103, 4419-4440, 1998.
Nakamura, R., Amm, O., Laakso, H., Draper, N., Lester, M., Gro-cott, A., Klecker, B., McCrea, I. W., Balogh, A., R`eme, H., and Andr´e, M.: Localized fast flow disturbance observed in the plasma sheet and in the ionosphere, Ann. Geophys., accepted, 2004.
R`eme, H., Bosqued, J. M., Sauvaud, J. A., Cros, A., Dandouras, J., Aoustin, C., Bouyssou, J., Camus, Th., Cuvilo, J., Martz, C., M´edale, J. L., Perrier, H., Romefort, D., Rouzaud, J., d’Uston, D., M¨obius, E., Crocker, K., Granoff, M., Kistler, L. M., Popecki, M., Hovestadt, D., Klecker, B., Paschmann, G., Scholer, M., Carlson, C. W., Curtis, D. W., Lin, R. P., McFadden, J. P., Formisano, V., Amata, E., Bavassano- Cattaneo, M. B., Baldetti, P., Belluci, G., Bruno, R., Chionchio, G., di Lellis, A., Shelley, E. G., Ghielmetti, A. G., Lennartsson, W., Korth, A., Rosenbauer, U., Lundin, R., Olsen, S., Parks, G. K., McCarthy, M., and Bal-siger, H.: The Cluster Ion Spectrometry (CIS) Experiment Space Sci. Rev. 79, 303–350, 1997.
Riedler, W., Torkar, K., R¨udenauer, F., Fehringer, M., Pedersen, A., Schmidt, R., Grard, R. J. L., Arends, H., Narheim, B. T., Troim, J., Torbert, R., Olsen, R. C., Whipple, E., Goldstein, R., Valavanoglou, N., Zhao, H.: Active Spacecraft Potential Control. Sp. Sc. Rev., 79, 271–302, 1997.
Rostoker, G., Akasofu, S.-I., Foster, J., Greenwald, R. A., Lui, A. T. Y., Kamide, Y., Kawasaki, K., McPherron, R. L., and Russell, C. T.: Magnetospheric substorms – Definition and signatures, J. Geophys. Res., 85, 1663–1668, 1980.
Ruohoniemi, J. M. and Baker, K. B.: Large-scale imaging of high-latitude convection with Super Dual Auroral Radar Network HF radar observations, J. Geophys. Res., 103, 20 797, 1998. Sandholt, P. E., Farrugia, C. J., Lester, M., Cowley, S., Milan,
S., Denig, W. F., Lybekk, B., Trondsen, E., and Vorobjev, V.: Multistage substorm expansion: Auroral dynamics in relation to plasma sheet particle injection, precipitation, and plasma convec-tion, J. Geophys. Res., 107, 1342, doi:10.1029/2001JA900116, 2002.
Shiokawa, K., Baumjohann, W., Haerendel, G., Paschmann, G., Fennel, J. F., Friis-Christensen, E., Luhr, H., Reeves, G. D., Rus-sell, C. T., Sutcliffe, P. R., and Takahashi, K.: High-speed ion flow, substorm current wedge, and multiple Pi2 pulsations, J. Geophys. Res., 103, 4491–4507, 1998.
Smith, C. W., Acu˜na, M. H., Burlaga, M. F., L’Heureux, J., Ness, N. F., and Scheifele, J.: The ACE Magnetic Fields Experiment Space Science Review, 86, 613–632, 1998.
Stone, E. C., Frandsen, A. M., Mewaldt, R. A., Christian, E. R., Margolies, D., Ormes, J. F., and Snow, F.: The Advanced Com-position Explorer Space Sci. Rev., 86, 1–22, 1998.
Tsyganenko, N. A. and Stern, D. P.: Modeling the global magnetic field of the large-scale Birkeland current systems, J. Geophys. Res., 101, 27 187–27 198, 1996.
Viljanen, A. and H¨akkinen, L.: IMAGE magnetometer network. In: Satellite-Ground Based Coordination Sourcebook (eds. M. Lockwood, M. N. Wild and H. J. Opgenoorth) ESA publications SP–1198, 111–117, 1997.
Wilken, B., Axford, W. I., Daglis, I., Daly, P., G¨uttler, W., Ip, W. H., Korth, A., Kremser, G., Livi, S., Vasyliunas, V. M., Woch, J., Baker, D., Belian, R. D., Blake, J. B., Fennell, J. F., Lyons, L. R., Borg, H., Fritz, T. A., Gliem, F., Rathje, R., Grande, M., Hall, D., Kecsuem´ety, K., McKenna-Lawlor, S., Mursula, K., Tanska-nen, P., Pu, Z., Sandahl, I., Sarris, E. T., Scholer, M., Schulz, M., Sørass, F., and Ullaland, S.: RAPID. The Imaging Energetic Par-ticle Spectrometer on ClusterSpace Sci. Rev. 79, 399–473, 1997.