Comparing the Fears of Children With and Without
Significant Disabilities
Comparaison des peurs chez les enfants lourdement
handicapés et chez les enfants non handicapés
Joy J. Burnham
Kagendo Mutua
Desireé A. Tallent
Olivia P. Robinson
Kenya G. Bledsoe
Amy P. Davis
University of Alabama abstractAlthough research on children’s fears is available, there is a gap in the literature concern-ing the fears of children with disabilities. We used the Fear Survey Schedule for Children (FSSC-AM; Burnham, 2005) to examine age, racial, and gender differences of 404 chil-dren (ages 7–20), including 50% with disabilities and 50% without disabilities. Signifi-cant fear differences were reported across gender, age, race, and disability. For example, children with intellectual disabilities had more fears related to safety. Both younger and older children with moderate to profound disabilities had significantly more fear than their peers without disabilities. This study broadened the examination of fears in children with moderate, severe, and profound disabilities.
résumé
Malgré la disponibilité d’études sur les peurs chez les enfants, on constate une lacune dans la littérature en ce qui concerne les peurs chez les enfants handicapés. Nous avons utilisé le sondage Fear Survey Schedule for Children (FSSC-AM; Burnham, 2005) pour examiner les différences d’âge, de race et de genre de 404 enfants (entre 7 et 20 ans), dont 50 % sont handicapés (à la fois intellectuellement et, dans certains cas, physiquement aussi) et 50 % ne le sont pas. On constata des différences significatives des peurs en fonction du genre, de l’âge, de la race et du handicap. Par exemple, des enfants ayant un handicap intellectuel vivaient plus de peurs en lien avec la sécurité. Indépendamment de leur âge, les enfants ayant un handicap de moyen à lourd vivaient considérablement plus de peurs que leurs homologues non handicapés. Cette étude a permis d’élargir l’examen des peurs chez les enfants atteints d’un handicap moyen, d’une incapacité grave et d’un handicap lourd. Fears of children have been studied since Hall (1897). Nonetheless, most stud-ies over this 120-year span have focused on children without disabilitstud-ies. Most fear researchers (Gullone, 2000) have examined the differences across gender, age, and fear intensity. Researchers have also looked at how children rank fears (i.e., the highest ranked fears are often referred to as the most common fears). While
Revue canadienne de counseling et de psychothérapie ISSN 0826-3893 Vol. 52 No. 3 © 2018 Pages 250–269
all children can be significantly impacted by their fears, this impact intensifies for children with disabilities (Li & Morris, 2006).
In this study, fear variables will be introduced and specific consideration of children with Individual Education Plans (IEPs), documenting moderate to pro-found disabilities, will be provided. With a better understanding of fears, improved school mental health services for all children can be provided.
literature review
Before Scherer and Nakamura’s (1968) introduction of the Fear Survey Schedule (FSSC), comparing fears across studies was difficult. The FSSC resulted in a steady examination of children’s fears and has become the instrument of choice for meas-uring children’s fears (Gullone, 2000). The FSSC has been revised several times since its inception (e.g., American Fear Survey Schedule [FSSC-AM; Burnham, 2005]; Fear Survey Schedule for Children-II [FSSC-II; Gullone & King, 1992]; Fear Survey Schedule for Children-Revised [FSSC-R; Ollendick, 1983]). Since then, the assessments of children’s fears have been well-documented.
For six decades, one of the most prevalent fear variables has been gender (Burnham & Gullone, 1997; Gullone & King, 1993; Lapouse & Monk, 1959; Ollendick, King, & Frary, 1989). Often, gender differences are explained as gender role expectations—the view that girls are more likely to be honest about their fears than boys (Bauer, 1976; Burnham, 2005).
Through the years, fears have been viewed as a normal part of development (Morris & Kratochwill, 1985). Consequently, certain fears are predictable and typically change quantitatively as children grow older (Campbell, 1986). While young children’s fears often involve imaginary things and the supernatural, older children more often report fears related to social situations or school (Burnham, Hooper, & Ogorchock, 2012; Gullone, 2000; Ollendick, Matson, & Helsel, 1985). Age-related fear differences have also been documented in the literature (Campbell, 1986; Gullone, 2000; Gullone & King, 1992, 1993), with research indicating that the number and intensity of fears diminishes with age (Burnham & Gullone, 1997; Burnham et al., 2012; Davidson, White, Smith, & Poppen, 1989; Gullone & King, 1992).
A limited number of fear studies have looked at differences across racial back-ground. Nalven (1970) noted that African American children were more fearful of animals than were White children. While Lapouse and Monk (1959) found more fears among African American children than among White children, Last and Perrin (1993) postulated that African American children had higher fear intensity scores. Some years later, Burnham and Lomax (2009) offered updates, comparing the fears of children from three racial backgrounds (White, African American, and Hispanic). The researchers reported three unique conclusions:
1. White children in elementary schools had more school and family-related fears than their African American counterparts.
2. White elementary children had lower fears of scary things than did African American and Hispanic children.
3. African American middle and high school students had higher death and danger fears than did White middle and high school students.
Most common fears or top-ranked fears have also been discussed in children’s fear literature (Burnham & Gullone, 1997; Burnham et al., 2012; Elbedour, Shul-man, & Kedem, 1997; Ollendick & King, 1991). The top-ranked fears include “not being able to breathe,” “myself dying,” and “someone in my family dying.” Although differences have been found across studies, many times the similarities are more prevalent than the differences among the most common fears.
Over the past 40 years, fear research among special populations has been incon-sistent. During this time, there have been a number of fear studies with specific disabilities (Li & Morris, 2006), intellectual disabilities (Duff et al., 1981; Guar-naccia & Weiss, 1974; Gullone, King, & Cummins, 1995, 1996), developmental disabilities (Knapp, Barrett, Groden, & Groden, 1992), and vision impairments (Ollendick et al., 1985). Researchers have surmised that children with disabilities may be “more fearful than nondisabled children” and that “children with dis-abilities may experience fears that are somewhat unique, reflective of functional limitations imposed by their disability” (King, Josephs, Gullone, Madden, & Ollendick, 1994, p. 378).
A few studies have examined children with visual and hearing impairments and chronic illnesses. According to Ollendick et al. (1985), visually-impaired children were more fearful of certain situations (i.e., “physically dangerous and harmful situations”) while the general population had more fears that related to “psycho-logically harmful situations,” such as being embarrassed (p. 377). Conversely, another study did not find significant differences in the visually impaired and the general populations (King, Gullone, & Stafford, 1990).
While examining fears, King and Ollendick (1989) compared the fears of hearing-impaired children to a general population and found that more fears related to “failure and criticism” were endorsed by the general population, while the hearing-impaired children endorsed more fears related to “unknown, injury, and small animals” (p. 580). Children with prolonged medical issues have also been compared in King, Gullone, and Ollendick (1990), indicating that children with illnesses have significantly more fears.
The body of literature related to the fears of children with disabilities remains small (Gullone et al., 1996; King, Gullone, & Ollendick, 1990; King, Gullone, & Stafford, 1990; King et al., 1994). In light of this, researchers stated that children with intellectual disabilities “have been a noticeably neglected group” (Gullone et al., 1996, p. 270). This inattention in the fear literature exists even though sig-nificant differences have been found across such variables as gender, age, intensity of fears, and racial background.
Similar to the general population, girls with disabilities have been found to be more fearful than boys with disabilities (Gullone et al., 1996; King et al., 1994; Li & Morris, 2007; Vandenberg, 1993). Also, as with the general population,
younger children have been found to be more fearful than older children (Gullone et al., 1996; King et al., 1994; Li & Morris, 2007). However, there have been more unique findings when studying children with intellectual disabilities. For example, Vandenberg (1993) found that children with intellectual disabilities have less fear maturity for a given developmental age. Similarly, Gullone et al. (1996) reported that girls with intellectual disabilities between the ages of 7 and 10 and ages 11 to 14 had decreases in fears, while those ages 15 to 18 had increases in fears. While fears change as children mature, children with intellectual disabilities have more fears compared to younger children with typical intellectual ability (King et al., 1994).
In an early study, Derevensky (1979) compared the fears of children with and without intellectual disabilities and found that children with intellectual disabilities reported more fears. Other researchers found similar patterns of more fears among special populations (Gullone et al., 1995; King et al., 1994; Knapp et al., 1992; Li & Morris, 2006). One study compared visually-impaired, hearing-impaired, and intellectually-impaired children to a general population of children the same age (King et al., 1994). The children with intellectual disabilities were the most fearful group. For example, fears related to the “unknown” (e.g., “spooky things, thunderstorms, and dark places”) and “animals” (“ants, beetles, bats, birds”) were more pronounced in the children with intellectual disabilities when compared to the other groups (p. 383). Overall, the children with intellectual disabilities had “heightened levels of fear, as well as fairly unique fears” (King et al., 1994, p. 384).
As mentioned, a few studies have compared fears across racial background (Burnham & Lomax, 2009; Last & Perrin, 1993). Li and Prevatt (2007) expanded the research in this area by exploring the connection between racial background and disabilities. Their research focused on fears of Hispanic children and White children with various levels of intellectual disabilities. In this study, the White adolescent boys (ages 14–18) had the lowest fear intensity scores of all participants, while the highest fear intensity scores were attained by the Hispanic American girls (ages 7–10, 11–13) and the older White girls (ages 14–18).
The most prevalent fears are often referred to as the most common fears (MCFs) in fear research. MCFs have been reported in many fear studies of children sampled from a general population of children (Burnham & Gullone, 1997; Elbedour et al., 1997; Ollendick & King, 1991).
Knapp et al. (1992) reported top-ranked fears for children with and without intellectual disabilities and found more commonalities than differences. Addi-tionally, both groups of children shared common fears such as “not being able to breathe,” “being hit by a car or truck,” and “falling from high places” (Knapp et al., 1992, p. 200). Nonetheless, Knapp et al. postulated that looking at the dif-ferences in the most common fears was important when comparing children with and without disabilities. Although the children with intellectual disabilities had more fears related to “physical safety and animals,” the children without disabilities had “more abstract concerns such as fear of failure and criticism” (p. 201). These differences highlighted potential developmental differences between the groups.
The most common fears were also compared across racial backgrounds (i.e., White and Hispanic). The findings were similar, with the racial groups sharing such items as “car accidents,” “bombing attacks,” “burglars,” and “not being able to breathe” (Li & Prevatt, 2007, p. 396).
A few studies have looked at fear factors and disability. Li and Morris (2007) reported that the fear factors “Death and Danger” and the “Unknown” were the most common fears for children with intellectual disabilities. Guarnaccia and Weiss (1974) described the four fears of school-aged children (mean IQ of 43) through parental reports as “Separation (e.g., closed or crowded places), Natural Events (e.g., thunder, loud noises), Physical Injury (e.g., included bodily injury and being criticized), and Animals (e.g., snakes, rats)” (p. 542).
Li and Morris (2007) offered several unique perspectives from their research. Against the typical gender pattern, boys with intellectual disabilities (ages 14–18) had significantly higher fear scores and higher fears related to the “Failure and Criticism” factor. Equally unique was that older boys endorsed higher fears and failure/criticism fears. The authors explained this finding as potentially being exposed to “more derision from peers with or without disability and less protec-tion from adults due to their male status … they may also be able to sense others’ opinion of themselves” (p. 453).
present study
This cross-sectional research study set out to broaden the current research on children’s fears by further exploring fears according to race, gender, age, and disabil-ity. The study had two aims: (a) to examine the fears of children with disabilities, a population that has been underrepresented in past and recent fear literature, and (b) to compare the fear findings of children with disabilities to a general popula-tion of children without disabilities. The three research quespopula-tions were as follows:
Research Question 1: Will the most common fears (i.e., top 20 fears) of children with significant disabilities differ from the most common fears of the general population?
Research Question 2: Will the fear intensity scores significantly differ across age, gender, or race between children with and without disabilities?
Research Question 3: Will the fear factor scores significantly differ across age, gender, or race between children with and without disabilities?
method Participants
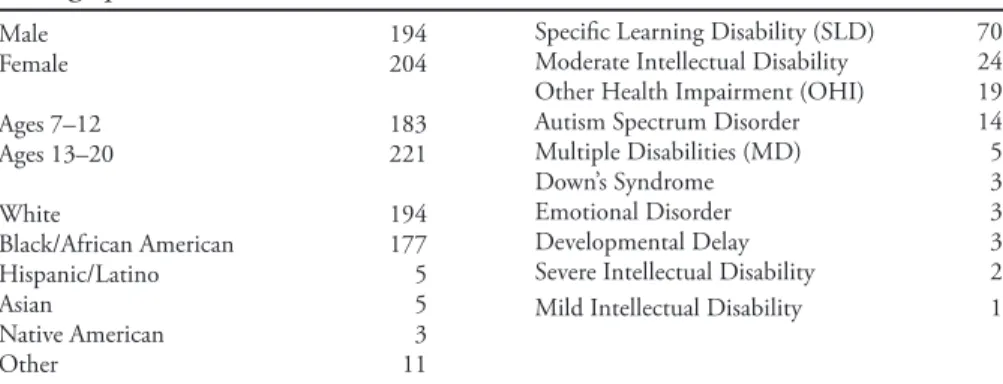
Participants comprised children attending public school districts in southern states in the United States from low- to high-income families in both rural and urban areas. Data used in this study were selected from a pool of 404 students who received parental consent to participate in this study. Of the 404 participants, 50%
(n = 202) were children with significant disabilities who had Individualized Educa-tion Plans (IEPs) and 50% (n = 202) were children without reported disabilities who received instruction from the general education classroom curriculum. See Table 1 for demographic data.
Table 1 Demographics Male 194 Female 204 Ages 7–12 183 Ages 13–20 221 White 194 Black/African American 177 Hispanic/Latino 5 Asian 5 Native American 3 Other 11
Specific Learning Disability (SLD) 70 Moderate Intellectual Disability 24 Other Health Impairment (OHI) 19 Autism Spectrum Disorder 14 Multiple Disabilities (MD) 5
Down’s Syndrome 3
Emotional Disorder 3
Developmental Delay 3
Severe Intellectual Disability 2 Mild Intellectual Disability 1
The participants with disabilities were in special education settings serving stu-dents with moderate, severe, and profound disabilities. For this study, therefore, we refer to them as students with significant disabilities. More specifically, according to the United States’ Individuals with Disabilities Education Improvement Act ([IDEA], 2004), the students in this study were identified with moderate to pro-found intellectual disabilities (IQ range: 40–70), serious emotional disturbance, autism spectrum disorder, Down syndrome, specific learning disabilities, multi-ple disabilities, developmental delays, speech-language impairment, orthopedic impairments, and other health impairments. The disability category, as well as the severity of disability, was reported in each student’s IEP for special education services. To receive services under IDEA (2004), a student’s disability must sig-nificantly impact the student’s educational performance. Therefore, our use of the term significant disabilities as an overarching category is a reflection of the severity of the disability, qualifications for special education services, and the intensity of the services they received in placements that ranged from separate schools and classrooms designed specifically to serve only those with disabilities. Only 36% (n = 72) of the participants with disabilities received instruction in inclusive settings with additional assistance.
Demographic frequencies indicated that 45.3% (n = 183) participants were younger children between the ages of 7 and 12, while 54.7% (n = 221) were older children between the ages of 13 and 20. Regarding gender, 50.5% (n = 204) were girls and 48% (n = 194) were boys. A total of 6 participants were missing gender-identification data. White students accounted for 48% (n = 194) of the partici-pants, while 52% (n = 201) were non-White. Of the non-White participartici-pants, 89% (n = 177) were Black or African American, 2.38% (n = 5) were Hispanic, 2.35% (n
= 5) were Asian, 1.43% (n = 3) were Native American, and 5.24% (n = 11) identi-fied as Other. A total of 9 participants were missing ethnic-identification data.
The number of participants who were surveyed and identified within the catego-ry referred to as significant disabilities represented 11 of the 13 IDEA -recognized categories of disabilities (2004). Of these 202 participants, 144 reported a specific disability, and of t hose 144 children, 17.3% (n = 70) were identified with specific learning disabilities, 5.9% (n = 24) were identified with moderate intellectual disabilities, 4.7% (n = 19) were identified with other health impairments, 3.5% (n = 14) were identified with autism, 1.2% (n = 5) were identified with multiple disabilities, 0.7% (n = 3) were identified with Down syndrome, 0.7% (n = 3) were identified with serious emotional disturbance, .07% (n = 3) were identified with developmental delays, 0.5% (n = 2) were identified with severe intellectual disabilities, and 0.2% (n = 1) were identified with mild intellectual disabilities. Instrument
This study used the American Fear Survey Schedule for Children (FSSC-AM; Burnham, 2005). Burnham adapted the Australian Fear Survey Schedule for Children-II (FSSC-II; Gullone & King, 1992, 1993), adding 20 contemporary items to the survey. The FSSC-AM is an ipsative survey containing 95 fear items, such as “someone in my family dying,” “drive-by shootings,” “flying in a plane,” and “having to fight in a war.” The FSSC-AM also includes an open-ended question: “What else makes you or people your age afraid, scared, or fearful?” In past studies, the FSSC-AM and the FSSC-II have been shown to have sound score validity, good reliability, and a Cronbach alpha reliability estimate of 0.97 (Burnham & Gullone, 1997; Gullone & King, 1992). Gullone and King (1992) reported good convergent, divergent, and construct validity.
Procedures
The researchers acquired institutional review board approval and school district approval before school contact was made. Before survey administration, signed parental consent forms and verbal student assent were necessary and obtained from each student. Two professors and two graduate assistants collected the data for this study during normal school hours within the school that the children attended. Similar to another adaptation of the FSSC for children with disabilities (Gullone et al., 1996), the FSSC used in this research was a modified version that included illustrations of each fear item. The standard survey instructions were used, includ-ing readinclud-ing the directions on the FSSC-AM aloud. The children were directed to mark 1 of 3 Likert-style options (i.e., not scared, scared, or very scared). The survey was read aloud in small groups where administrators could assist when necessary. During the administration of the survey, the professor or graduate students walked around the room to ensure that all students were attending to the assessment and that all questions were answered.
Analyses
Several analyses were completed in this study. For the first research question, the most common fears were decided by summing the frequency means for “scared” and “very scared” on the fear items of the FSSC-AM. The highest means (i.e., top 20 fears) were put forth for each population (i.e., those with disabilities and the general population). This comparison of most common fears was conducted to determine if there were idiosyncratic fears across the populations (the general population and those with intellectual disabilities). For the second research ques-tion, the fear intensity scores (FIS) were calculated. The FIS is calculated by using analyses of variance (ANOVAs) to look at significant differences across gender, age, race, and disability. For the third research question, a multivariate analysis of variance (MANOVA) and follow-up comparisons were conducted to determine main and interaction effects between populations (the general population and those with intellectual disabilities), gender, age, and race on each of the five fear factors for younger (ages 7–12) and older (ages 13–20) children.
Before analysis, the Bonferroni correction was used to address family-wise error rate. This allowed for a more conservative alpha level to account for Type I error. Therefore, our results reported a significance level of p 0.0125. Further, effect sizes were reported as partial eta squared () to interpret the relative magnitude of the effects (Keppel, 1991). The relative magnitude of the effect size was further analyzed as suggested by Cohen (1988), as = 0.01 is considered small, = 0.09 is considered medium, and = 0.14 is considered large.
Fear Factor Analysis
Factor analysis results for elementary, middle, and high school children were examined in this current study. These analyzed factors were previously derived from the items listed on the FSSC-AM (Burnham & Giesen, 2005) and further supported by a larger study (Burnham, 2005). For elementary school students, five factors—“Death and Danger,” “School/Family,” “Scary Things,” Animals,” and “Unknown”—were extracted, with Cronbach alpha reliability estimates ranging from .60 to .97. Five factors—“Death and Danger,” “Animals,” “School-Related Fears,” “Unknown,” and “Medical” (Burnham & Giesen, 2005)—were also extracted for middle school and high school students, with Cronbach alpha reliability estimates ranging from .70 to .96.
Results of Most Common Fears
In determining the top 20 fears, the percentages of “scared” and “very scared” for each item was calculated and ranked according to highest percentage. When multiple items had the same percentage of “scared” and “not scared” responses, the percentage of “very scared” responses were used to determine rank. For this study, the most common fears are shown in Table 2.
Table 2
Most Common Fears
Rank Children with significant disabilities % Children without disabilities % 1 Someone in my family dying (a) 84.7 Not being able to breath (a) 93 2 Being hit by a car or truck (a) 84.6 Someone in my family having an
accident (a) 90.5
3 Car wreck/Car accident (a) 83.1 Being threatened with a gun (a) 89.1 4 Not being able to breath (a) 82.6 Nuclear war (a) 87.5 5 Someone in my family having an
accident (a) 81.7 Someone in my family dying (a) 86.6
6 Myself dying (a) 81.0 Murderers (a) 86.1
7 Falling from high places (a) 80.6 AIDS (a) 85.6
8 Tornadoes/Hurricanes (a) 80.2 Being hit by a car or truck (a) 85.5 9 Being kidnapped (a) 79.5 Getting a serious illness (a) 84.9
10 AIDS (a) 78.6 Car wreck/Car accident (a) 84.1
11 Getting a serious illness (a) 78.1 Having to fight in a war (c) Myself
dying (a) 82.6
12 Earthquakes (b) Drowning/
Swimming in deep water (b) 77.7 Our country being invaded by enemies (a) 82.1
13 Crime (b) 77.1 Terrorist attacks (a) 81.1
14 Being threatened with a gun (a) 77.0 Being kidnapped (a) 80.7 15 Drive-by shootings (a) 76.8 Shootings (c) Drive-by shootings (a) 80.6 16 Terrorist attacks (a) 76.1 Taking dangerous/bad drugs (a) 80.2 17 Taking dangerous/bad drugs (a) 75.7 Falling from high places (a)
A burglar breaking into our home (c) 80.1 18 Our country being invaded by
enemies (a) 75.6 Tornadoes/Hurricanes (a) 76.7
19 Nuclear war (a) 75.3 Going to jail (c) 76.1
20 Murderers (a) 75.2 Getting bad grades at school (c) 75.0 Note: a = shared by both groups, b = uniquely endorsed by children with disabilities, and c = uniquely endorsed by children without disabilities
Fear Intensity Scores
For the FIS, data from the 396 of 404 participants who had complete profiles (8 were missing gender and race values) were analyzed using a univariate analysis of variance (ANOVA; see Table 3). This analysis was used to compare the FIS across participants’ gender, race, age, and disability category. Specifically, 204 girls (51.51%) and 192 boys (48.49%) were included in this study. Gender differences in FIS indicated a higher FIS reported by girls (M = 185.3; SD = 33.5) than by boys (M = 156.9; SD = 36.5), F(1,388) = 68.01, p < .001. The corresponding effect size was =.15. This is a large effect size that showed about 15% of the
vari-ance in FIS was related to gender differences. Considering race, 193 participants reported being White (48.74%) and 203 reported being non-White (51.26%). Non-White participants (M = 176.2; SD = 36.5) reported higher FIS than their White counterparts (M = 166.6; SD = 38.1), F(1,388) = 9.86, p = .002. The cor-responding effect size, = .03, showed a small-medium effect, or 3% in the variance of FIS, was related to race. Of the participants, 181 (45.71%) were categorized as younger children (ages 7–12) and 215 (54.29%) older children (ages 13–20). The younger children reported significantly higher scores (M = 180.6; SD = 33.7) than the older children (M = 163.9; SD = 39.4), F(1,388) = 18.20, p < .001. The corresponding effect size was small-medium with = .05 or 5% of the variance was accounted for.
Another analysis of variance (ANOVA) was used to calculate the FIS among participants based on the disability category (see Table 3). For this category, a total of 402 participants from the total number of participants were analyzed, with 50% (n = 201) reporting a disability and 50% (n = 201) reporting no disability. Results indicated statistically different FIS scores reported by participants with a disability (M = 175.2; SD = 40.3) when compared to those without a disability (M = 166.9; SD = 34.5). Specifically, those with a disability reported significantly higher FIS than those without a disability, F(1,400) = 5.09, p = .025. Partial was .013 or 1.3% of the variance was accounted for. This was a large correlation. Table 3
Fear Intensity Scores
Gender *Girls (n = 204) and Boy (n = 192) F(1,388) = 68.01, p = .000 Race White (n = 193) and *Non-White (n = 203) F(1,388) = 9.86, p = .002 Age *Ages 7–12 (n = 181) and Ages 13–20 (n = 215) F(1,388) = 18.20, p = .000 Disability *With Disability (n = 201) and Without Disability (n = 201) F(1,400) = 5.09, p = .025 Significance level - * = .0125
Fear Factor Scores for Younger Students (Ages 7–12)
A MANOVA was used to consider differences in the multiple fear factor scores among the younger children in this study. The application of a MANOVA allowed each fear factor to be analyzed as a dependent variable concerning each demo-graphic variable that served as an independent variable. For the 183 participants in the younger group (ages 7–12), a total of five fear factors were identified by Burnham and Giesen (2005): “Death/Danger,” “School/Family,” “Animals,” “Scary Things,” and “Unknown” (see Table 4). Differences were assessed across gender, race, and disability category. For gender, 53% (n = 97) were girls while 45.9% (n = 84) were boys. A total of 2 participants were missing gender-identification information. For race, 45.4% (n = 83) identified as White while 52.4% (n = 96) identified as non-White. Of those who identified as non-White, 88.54% (n = 85)
identified as African American/Black, 1.04% (n = 1) identified as Asian, 2.08% (n = 2) identified as Native American, and 8.33% (n = 8) identified as Other. A total of 4 participants failed to report ethnic-identification information. Additionally, 43.7% of participants (n = 80) within this age group had IEPs and were placed in the group with significant disabilities while 56.3% (n = 103) of participants did not have IEPs and were placed in the group without disabilities.
Table 4
MANOVA Results (Younger Children, Ages 7–12) Disability
Death/Danger Without disabilities *With disabilities n/a
School/Family Without disabilities *With disabilities F(1,168) = 7.51, p = .007 Animals Without disabilities *With disabilities F(1,168) = 16.99, p = .000 Scary Things Without disabilities *With disabilities F(1,168) = 20.18, p = .000 Unknown Without disabilities *With disabilities F(1,168) = 15.12, p = .000 Gender
Death/Danger *Girls Boys F(1,168) = 31.35, p = .000
School/Family *Girls Boys F(1,168) = 14.49, p = .007
Animals *Girls Boys F(1,168) = 44.19, p = .000
Scary Things *Girls Boys F(1,168) = 16.04, p = .000
Unknown *Girls Boys F(1,168) = 12.77, p = .000
Racial x Disability Interaction (Significantly Higher Fears)
Animals * White with disability Non-White with disability F(1,168) = 3.99, p = .047 Unknown * White with disability Non-White with disability F(1,168) = 4.45, p = .036
Racial x Disability Interaction (Significantly Lower Fears) Animals * White without
disability Non-White without disability F(1, 168) = 3.993, p = 0.47 Unknown * White without
disability Non-White without disability F(1, 168) = 4.453, p = 0.36 Significance level – * = .0.125
Several significant findings emerged from the MANOVA assessing various fear factors across race, gender, and disability status. In all reported findings, both Wilks’ Lambda and Levene’s Test of Homogeneity were significant for all
five factors (“Death/Danger,” “School/Family,” “Animals,” “Scary Things,” and “Unknown”). The homogeneity of variance (“Testing for homogeneity,” n.d.) was investigated to ensure acceptable differences in variances. By conducting a natural log data transformation, a majority of the significant Levene values became nonsignificant. Hartley’s F was calculated for the remaining significant Levene values. Doing so resulted in nonsignificant Levene values for all factors except for the “School/Family” factor in the disability group. For this reason, differences among the disability group on the “School/Family” fear factor were not assessed. Reporting on the significant findings, the group with disabilities reported significantly higher scores among the School/Family fear factor, M = 40.8, SD = 9.7, F(1,168) = 7.51, p = .007, = .04; the Animal fear factor, M = 1.8, SD = .54, F(1,168) = 16.99, p = .000, = .09; the Scary Things fear factor, M = 1.8, SD = .49, F(1,168) = 20.18, p < .001, = .11; and the Unknown fear factor, M = 1.6, SD = .49, F(1,168) = 15.12, p < .001, = .08. Death/Danger was not significant for the group with disabilities. Regarding gender, girls reported significantly higher scores among all fear factors. Specifically, higher scores were reported by girls for the Death/Danger fear factor, M = 110.1, SD = 19.1, F(1,168) = 31.35, p < .001, = .16; the School/Family fear factor, M = 42.1, SD = 7.8, F(1,168) = 14.49, p = .007, = .07; the Animal fear factor, M = 1.9, SD = .48, F(1,168) = 44.19, p < .001,=.21; the Scary Things fear factor, M = 1.8, SD = .45, F(1,168) = 16.04, p < .001, = .09; and the Unknown fear factor, M = 1.5, SD = .46, F(1,168) = 12.77, p < .001, = .07. There were no racial differences among any of the fear factors; however, there were racial and disability category interaction effects. Specifically, White children with a disability reported higher fear factor scores than their non-White counterparts for Animals, M = 1.9, SD = .61, F(1,168) = 3.99, p = .047, = .02, and Unknown fears, M = 1.8, SD = .57, F(1,168) = 4.45, p = .036, = .03. However, White children without a disability reported lower Animal (M = 1.6, SD = .49) and Unknown (M = 1.3, SD = .39) fear factors scores than non-White children, F(1, 168) = 4.453, p = 0.36, = .02.
Fear Factor Scores for Older Students (Ages 13–20)
MANOVAs were run to assess reported differences in multiple fear factor scores (see Table 5). For ages 13 to 20 (n = 221), five fear factors identified by Burnham (2005): “Death/Danger,” “Animals,” “School/Family,” “Unknown,” and “Medical.” Differences were assessed across gender, race, and disability category. For gender, 48.4% (n = 107) were girls while 49.8% (n = 110) were boys. Four participants within this age range failed to report their gender. For race, 50.2% (n = 111) identified as White, while 47.6% (n = 105) identified as non-White. Of those considered non-White, 87.62% (n = 92) identified as African American/Black, 4.76% (n = 5) Hispanic, 3.81% (n = 4) Asian, <1% (n = 1) were Native American, and 2.86% (n = 3) identified as Other. A total of five participants failed to report ethnic-identification information. Furthermore, 55.2% (n = 122) of participants in this age group fell within the group with disabilities while 44.8% (n = 99) fell within the group without disabilities.
Table 5
MANOVA Results (Older Children, Ages 13–20) Disability
Death/Danger Without disabilities *With disabilities F(1,214) = 6.020, p = .015 Animal Without disabilities *With disabilities F(1,214) = 10.30, p = .002 School/Family Without disabilities *With disabilities F(1,214) = 7.03, p = .009 Unknown Without disabilities *With disabilities F(1,214) = 15.01, p = .000 Medical Without disabilities *With disabilities n/a
Gender
Death/Danger *Girls Boys F(1,208) = 42.43, p = .000
Animal *Girls Boys F(1,208) = 57.05, p = .000
School/Family *Girls Boys F(1,208) = 18.39, p = .000
Unknown *Girls Boys F(1,208) = 38.52, p = .000
Medical *Girls Boys F(1,208) = 6.38, p = .015
Race
Animals White *Non-White F(1,212) = 13.98, p = .000
Significance level - * = .0125
Several significant findings emerged from the MANOVA assessing race, gen-der, and disability differences among the five fear factors. In all of these reported findings, Wilks’ Lambda was significant, and Levene’s Test of Homogeneity was significant for several of the factors (School, Unknown, Medical). The homogene-ity of variance was investigated to ensure acceptable differences in variances. By conducting a natural log data transformation, a majority of the significant Levene values became nonsignificant. Hartley’s F was calculated for the remaining signifi-cant Levene values. This step resulted in nonsignifisignifi-cant Levene values for all factors except the Medical factor for the disability group. Thus, the differences among the children with intellectual disabilities (for the Medical fear factor) were not assessed. Despite the dismissal of the Medical fear factor, the group with disabilities re-ported significantly higher scores among all other factors: the Death/Danger fear factor, M = 88.2, SD = 22.8, F(1,214) = 6.020, p = .015, = .03; the Animals fear factor, M = 18, SD = 5.6, F(1,214) = 10.30, p = .002, = .05; the School/Family fear factor, M = 27, SD = 7.5, F(1,214) = 7.03, p = .009, = .03; and the Unknown fear factor, M = 20, SD = 6.1, F(1,214) = 15.01, p < .001, = .07. Regarding gender, girls reported significantly higher scores among all fear factors. Specifically, higher scores were reported by girls for the Death/Danger fear factor, M = 93.4, SD = 19.2, F(1,208) = 42.43, p < .001, = .17; the Animals fear factor, M = 19.3, SD = 5.6, F(1,208) = 57.05, p < .001, = .22; the School/Family fear factor, M = 31,
SD = 8.1, F(1,208) = 18.39, p < .001, = .08; the Unknown fear factor, M = 20.7, SD = 5.8, F(1,208) = 38.52, p < .001, = .16; and the Medical fear factor, M = 7.1, SD = 2.2, F(1,208) = 6.38, p = .015, = .03. In assessing for racial differences in reported scores among fear factors, non-Whites were found to report higher scores than Whites only on the Animals fear factor, M = 18.5, SD = 6, F(1,212) = 13.98, p < .001. The corresponding effect size was small, with = .06 or 6% of the variance. All other fear factors failed to yield significant racial differences. There were no interaction effects among gender, race, or disability categories.
discussion
This study examined the most common fears (top 20 fears) to answer research question 1, “Will the most common fears (i.e., top 20 fears) of children with significant disabilities differ from the most common fears of the general popula-tion?” There were more commonalities than differences in the most common fears between the children with and without disabilities. For example, the two comparison groups shared such top-ranked fears such as “someone in my family dying,” “being hit by car or truck,” “car wreck/car accident,” “not being able to breathe,” and “falling from high places.” Further, the most common fears in this study were quite similar to what has been found in other studies for children with and without disabilities (Burnham & Gullone, 1997; Burnham et al., 2012; Elbedour et al., 1997; Gullone & King, 1992).
However, the differences in most common fears were also noteworthy (see Table 2). In line with the suggestions of Knapp et al. (1992), we looked closely at the fear differences between children with and without disabilities. The most common fear differences offered some insight. For example, those with significant disabilities uniquely endorsed death and danger-related fears such as “earthquakes,” “drowning/swimming in deep water,” and “crime,” while those without intellec-tual disabilities uniquely endorsed “having to fight in a war,” “shootings,” “going to jail,” and “getting bad grades at school.” The children without disabilities in both this study and the Knapp et al. study had some “failure and criticism” fears, while the children with disabilities had “physical safety” fears. Similarly, Li and Morris (2006) reported that the most common fears of children with intellectual disabilities would likely relate to “death and danger fears” or the “unknown.”
This study examined fear intensity scores to answer research question 2, “Will the fear intensity scores significantly differ across age, gender, or race between children with and without disabilities?” Significant differences were found across gender, age, race, and disability. For the gender variable, girls were significantly more fearful than boys. Higher fears for girls have been reported for decades with the general population of children (Burnham & Gullone, 1997; Burnham et al., 2012; Gullone & King, 1992). To add, this pattern of girls being more fearful also corresponded with fear studies that have considered children with disabilities (Gullone et al., 1996; King et al., 1994; Li & Morris, 2006, 2007; Vandenberg, 1993).
For the age variable, younger children (ages 7–12) were significantly more fearful than older children (ages 13–20). This fear tendency also followed the age differences found in the literature for the general population (Burnham & Gullone, 1997; Campbell, 1986; Gullone, 2000; Gullone & King, 1992) and for children with disabilities (Gullone et al., 1996; King et al., 1994; Li & Morris, 2007). For the race variable, limited research exists for comparative purposes, and the avail-able studies have been conducted with a general population of children in most circumstances (Burnham & Lomax, 2009; Lapouse & Monk, 1959; Last & Perrin, 1993; Nalven, 1970). Li and Prevatt (2007) examined racial differences in children with disabilities. For the disability variable, children with moderate to profound disabilities were more fearful than children without disabilities. Past studies that have compared children with and without disabilities have found similar trends (Derevensky, 1979; Gullone et al., 1996; King et al., 1994; Knapp et al., 1992).
This study examined fear factor scores to answer research question 3, “Will the fear factor scores significantly differ across age, gender, or race between chil-dren with and without disabilities?” There were significant differences across the factor scores for the younger and older children and for those with and without significant disabilities. To shed light on these findings, two studies have offered some insight into fear factor scores and children with disabilities (Guarnaccia & Weiss, 1974; Li & Morris, 2007). However, this study uniquely broadened the factor-related analyses by comparing gender, race, and disability for children in two age groups. To our knowledge, this level of analysis has not been reported in past fear studies. Thus, limited comparisons can be made to this aspect of the study across gender, age, race, and disability, although findings are important and need further review.
Younger Children (Ages 7–12)
The fear factors from the FSSC-AM (Burnham, 2005) for younger children (ages 7–12) were “Death/Danger,” “Scary Things,” “Animals,” “School/Family,” and “Unknown” fears. The fear factor score analyses for younger children (see Table 4) offered important results.
Regarding gender, girls reported higher scores on all five of the fear factors than the boys. White children with a disability reported higher fear factors scores for “Animals” and “Unknown” fears than did their non-White counterparts, which appeared to contradict Nalven’s (1970) general fear population study comparing White and African American children’s fears. However, White children without a disability reported lower “Animals” and “Unknown” fear factors scores than non-White counterparts, which aligned more with past fear studies that looked at race (Last & Perrin, 1993; Nalven, 1970).
The children with disabilities reported significantly higher scores among four fear factors: “Scary Things,” “Animals,” “School/Family” fears, and the “Unknown.” This was an important outcome to consider, since the number of significant fear factors was greater than in past studies. The factor findings in this study did not align with Li and Morris (2007), with the exception that both studies shared the
fear factor “Unknown.” On the other hand, Guarnaccia and Weiss (1974) reported four factors for children with intellectual disabilities: “Separation (e.g., closed or crowded places), Natural Events (e.g., thunder, loud noises), Physical Injury (e.g., included bodily injury and being criticized), and Animals (e.g., snakes, rats)” (p. 542), which appeared to have some similar, but not exactly identical, factors to this study. Another important notation, with this younger group of children, was that there was no race/disability interaction.
Older Children (Ages 13–20)
The fear factors from the FSSC-AM (Burnham, 2005) for older children (ages 13–20) were “Death/Danger,” “Animals,” “School/Family,” “Unknown,” and “Medical” fear factors. The fear factor score analyses for older children (see Table 5) offered important results.
Regarding gender, similar to studies cited previously, girls reported significantly higher scores than boys on all five fear factors. This finding contradicts conclusions from Li and Morris’s (2007) fear study with intellectual disabilities which found that boys (ages 14–18) had significantly higher fear scores and higher fears related to one factor, “Failure and Criticism.”
Regarding race, non-White children were found to report higher scores than Whites only on the fear factor “Animals,” which paralleled Burnham and Lomax (2009) and Nalven (1970). For the disability variable, children with disabilities reported significantly higher scores among four factors: “Death/Danger,” “Ani-mals,” “School/Family” fears, and the “Unknown.” The older group of children in this study offered more significant fear factors, which again were more similar to Guarnaccia and Weiss (1974) than to Li and Morris (2007).
Implications for Counselling Practice
Overall, professional educators, counsellors, psychologists, and other helping professionals need to be aware of the intensified fears and the unique fear trends among children with significant disabilities. Eight of the top nine fears of school-aged children with disabilities focus on aspects of physical safety such as death and accidents, which aligns with research by Knapp et al. (1992). As a result of these high-ranking fears, when a school or community faces a crisis or trauma such as the death of a student or a natural disaster, students with significant disabilities may be in more need of support from school-based mental health practitioners, as these events may closely align with their fears.
Further, the study shows that White students with disabilities may have more fears of animals than do their non-White peers with disabilities. Awareness of this fear factor allows those within the school setting to help teachers and admin-istrators understand potential student reactions to studies containing animals. This study also underlines, similar to Li and Morris (2007), that children with disabilities may be more sensitive to what others think than has been considered in the past. To add, in the current world of widespread bullying, children with disabilities are potentially being exposed to “more derision from peers with or
without disability and less protection from adults” (Li & Morris, 2007, p. 453) than professionals have thought.
Additionally, the confirmation of prior research that girls (Burnham & Gullone, 1997; Burnham et al., 2012; Gullone & King, 1992; King & Ollendick, 1989) and younger students (Burnham, 1995; Burnham & Gullone, 1997; Gullone & King, 1992, 1993) experience their fears with a higher intensity is a reminder to school mental health providers that these students need additional support. This might include using cognitive behavioural therapy (Baggerly & Exum, 2008; O’Callaghan & Cunningham, 2015), play therapies like drawing, singing, or dancing (Baggerly & Exum, 2008), animal-assisted therapy (Cohen, Mannarino, & Deblinger, 2017), or teaching coping skills to students experiencing these fears. Overall, these data would help mental health workers in a school setting better understand the fears of school children, both those with and without significant disabilities.
conclusion
This study underlines the sparseness of fear research on children with dis-abilities and recommends focused research on the fears and worries of children with disabilities. A limitation of this study was the lack of racial diversity in the sample examined. Future studies should seek a more heterogeneous sample across demographics, including ethnicity.
Nonetheless, when gender, age, race, and disability were compared, this study put forward eight thoughts that support previous fear research or shed new light on these variables. While the fear research related to disability is dated, four thoughts in this study emerged that corroborate with previous research, includ-ing the followinclud-ing:
1. Children with significant disabilities often have more fears than children without disabilities (King, Gullone, & Ollendick, 1990; King et al., 1994). 2. Children with disabilities often have “unique fears … reflective of functional
limitations imposed by their disability” (see King et al., 1994, p. 378). 3. Children with intellectual disabilities often have fears related to their safety
that should be considered by educators and providers, similar to Knapp et al. (1992).
4. Non-White children often endorse more fears than White children (Burn-ham & Lomax, 2009).
This study also offered four new findings, while pointing to the need for more fear research related to disabilities:
1. The race variable needs more focus across gender, age, and disability.
2. Both younger and older children with moderate to profound disabilities are likely to have more fear than their peers without disabilities.
3. Younger and older White children with disabilities are likely to have higher fears than their counterparts without disabilities.
4. Non-White children with disabilities often have higher “animal-related” fears.
At the same time, appropriate interventions for special needs children are indicated and strongly encouraged to assist caretakers, educators, and helping professionals who work with school-aged youth.
References
Baggerly, J., & Exum, H. A. (2008). Counseling children after natural disasters: Guid-ance for family therapists. American Journal of Family Therapy, 36(1), 79–93. https://doi. org/10.1080/01926180601057598
Bauer, D. H. (1976). An exploratory study of developmental changes in children’s fears. Journal
of Child Psychology and Psychiatry, 17, 69–74. https://doi.org/10.1111/j.1469-7610.1976.
tb00375.x
Burnham, J. J. (1995). Validation of the Fear Survey Schedule for Children and Adolescents (FSSC-II)
in the United States (Unpublished doctoral dissertation). Auburn University, AL.
Burnham, J. J. (2005). Fears of children in the United States: An examination of the American Fear Survey Schedule with 20 new contemporary fear items. Measurement and Evaluation in
Counseling and Development, 38, 78–91. https://doi.org/10.1080/07481756.2005.11909770
Burnham, J. J., & Giesen, J. (2005). Factor analysis of fear scores for elementary and middle/high school students [Unpublished raw data].
Burnham, J. J., & Gullone, E. (1997). The fear survey schedule for children-II: A psychometric investigation with American data. Behaviour Research and Therapy, 35, 165–173. https://doi. org/10.1016/S0005-7967(96)00089-7
Burnham, J. J., Hooper, L. M., & Ogorchock, H. N. (2012). Differences in the fears of elementary school children in North and South America: A cross-cultural comparison. International Journal
for the Advancement of Counselling, 33, 235–251. https://doi.org/10.1007/s10447-011-9131-7
Burnham, J. J., & Lomax, R. G. (2009). Examining ethnicity and fears of children and adolescents in the United States: Differences between White, African American, and His-panic populations. Journal of Counselling and Development, 87, 387–393. https://doi. org/10.1002/j.1556-6678.2009.tb00122.x
Campbell, S. B. (1986). Developmental issues in childhood anxiety. In R. Gittleman (Ed.), Anxiety
disorders of children (pp. 24–57). New York, NY: Guilford Press.
Cohen, J. (1988). Statistical power analysis for the behavioral sciences. New York, NY: Routledge Academic.
Cohen, J. A., Mannarino, A. P., & Deblinger, E. (2017). Treating trauma and traumatic grief in
children and adolescents. New York, NY: Guilford Press.
Davidson, P. M., White, P. N., Smith, D. J., & Poppen, W. A. (1989). Content and intensity of fears in middle children among rural and urban boys and girls. Journal of Genetic Psychology,
150, 51–58. https://doi.org/10.1080/00221325.1989.9914574
Derevensky, J. L. (1979). Children’s fears: A developmental comparison of normal and exceptional children. Journal of Genetic Psychology, 135, 11–21. https://doi.org/10.1080/00221325.197 9.10533412
Duff, R., LaRocca, J., Lizzet, A., Martin, P., Pearce, L., Williams, M., & Peck, C. (1981). A com-parison of the fears of mildly retarded adults with children of their mental age and chronological age matched controls. Journal of Behavior Therapy and Experimental Psychiatry, 12, 121–124. https://doi.org/10.1016/0005-7916(81)90005-7
Elbedour, S., Shulman, S., & Kedem, P. (1997). Children’s fears: Cultural and developmental perspectives. Behaviour Research and Therapy, 35, 491–496. https://doi.org/10.1016/S0005-7967(97)00012-0
Guarnaccia, V. J., & Weiss, R. L. (1974). Factor structure of fears in the mentally retarded. Journal
Gullone, E. (2000). The development of normal fear: A century of research. Clinical Psychology
Review, 20, 429–451. https://doi.org/10.1016/S0272-7358(99)00034-3
Gullone, E., & King, N. J. (1992). Psychometric evaluation of a revised fear survey schedule for children and adolescents. Journal of Child Psychology and Psychiatry and Allied Disciplines, 33, 987–998. https://doi.org/10.1111/j.1469-7610.1992.tb00920.x
Gullone, E., & King, N. J. (1993). The fears of youth in the 1990s: Contemporary normative data.
Journal of Genetic Psychology, 154, 137–153. https://doi.org/10.1080/00221325.1993.9914728
Gullone, E., King, N. J., & Cummins, R. A. (1995). Adaptive behaviour in children and adoles-cents with an intellectual disability: Relationship with fear and anxiety. Behaviour Change, 12, 227–237. https://doi.org/10.1017/S0813483900004083
Gullone, E., King, N. J., & Cummins, R. A. (1996). Fears of youth with mental retardation: Psychometric evaluation of the Fear Survey Schedule for Children-II (FSSC-II). Research in
Developmental Disabilities, 17, 269–284. https://doi.org/10.1016/0891-4222(96)00008-X
Hall, G. S. (1897). A study of fears. American Journal of Psychology, 8, 147–249. https://doi. org/10.2307/1410940
Individuals with Disabilities Education Improvement Act (IDEA), 20 U.S.C. § 1400 (2004). Keppel, G. (1991). Design and analysis: A researcher’s handbook. Englewood Cliffs, NJ: Prentice Hall. King, N. J., Gullone, E., & Ollendick, T. H. (1990). Fears of children with chronic medical
conditions. Journal of Clinical Child Psychology, 19, 173–177. doi.org/10.1207/s15374424jc-cp1902_10
King, N. J., Gullone, E., & Stafford, C. (1990). Fears in visually impaired and normally sighted chil-dren and adolescents. Journal of School Psychology, 28, 225–231. https://doi.org/10.1016/0022-4405(90)90013-W
King, N. J., Josephs, A., Gullone, E., Madden, C., & Ollendick, T. H. (1994). Assessing the fears of children with disability using the Revised Fear Survey Schedule for Children: A comparative study. British Journal of Medical Psychology, 67, 377–386. https://doi.org/10.1111/ j.2044-8341.1994.tb01805.x
King, N. J., & Ollendick, T. H. (1989). Children’s anxiety and phobic disorders in school settings. Classification, assessment, and intervention issues. Review of Educational Research, 59, 431–470. https://doi.org/10.3102/00346543059004431
Knapp, L. G., Barrett, R. P., Groden, G. G., & Groden, J. (1992). The nature and prevalence of fears in developmentally disabled children and adolescents: A preliminary investigation. Journal
of Developmental and Physical Disabilities, 4, 195–203. https://doi.org/10.1007/BF01046964
Lapouse, R., & Monk, M. A. (1959). Fears and worries in a representative sample of children.
American Journal of Orthopsychiatry, 29, 803–818. https://doi.org/10.1111/j.1939-0025.1959.
tb00250.x
Last, C. J., & Perrin, S. (1993). Anxiety disorders in African American and White children. Journal
of Abnormal Child Psychology, 21, 153–164. https://doi.org/10.1007/BF00911313
Li, H., & Morris, R. J. (2006). Fears and related anxieties in children having a disability: A synthesis of research findings from 1937–2004. In R. J. Morris (Ed.), Disability research and policy:
Cur-rent perspectives (pp. 163–186). Mahwah, NJ: Lawrence Erlbaum.
Li, H., & Morris, R. J. (2007). Assessing fears and related anxieties in children and adolescents with learning disabilities or mild mental retardation. Research in Developmental Disabilities, 28, 445–457. https://doi.org/10.1016/j.ridd.2006.06.001
Li, H., & Prevatt, F. (2007). Fears and related anxieties across three age groups of Mexican American and White children with disabilities. Journal of Genetic Psychology, 168, 381–400. https://doi. org/10.3200/GNTP.168.4.381-400
Morris, R. J., & Kratochwill, T. R. (1985). Behavioral treatment of children’s fears and phobias: A review. School Psychology Review, 14, 84–93.
Nalven, F. B. (1970). Manifest fears and worries of ghetto versus middle class suburban children.
Psychological Reports, 27, 285–286. https://doi.org/10.2466/pr0.1970.27.2.285
O’Callaghan, P., & Cunningham, E. (2015). Can a targeted, group-based CBT intervention reduce depression and anxiety and improve self-concept in primary-age children? Educational Psychology
Ollendick, T. H. (1983). Reliability and validity of the Revised Fear Survey Schedule for Children (FSSC-R). Behaviour Research and Therapy, 21, 685–692. https://doi.org/10.1016/0005- 7967(83)90087-6
Ollendick, T. H., & King, N. J. (1991). Origins of childhood fears: An evaluation of Rach-man’s theory of fear acquisition. Behaviour Research and Therapy, 29, 117–123. https://doi. org/10.1016/0005-7967(91)90039-6
Ollendick, T. H., King, N. J., & Frary, R. B. (1989). Fears in children and adolescents: Reliability and generalizability across gender, age and nationality. Behaviour Research and Therapy, 27, 19–26. https://doi.org/10.1016/0005-7967(89)90115-0
Ollendick, T. H., Matson, J. L., & Helsel, W. J. (1985). Fears in visually-impaired and normally sighted youths. Behaviour Research and Therapy, 23, 375–378. https://doi.org/10.1016/0005-7967(85)90017-8
Scherer, M. W., & Nakamura, C. Y. (1968). A Fear Survey for Children (FSS-FC): A factor ana-lytic comparison with manifest anxiety (CMAS). Behaviour Research and Therapy, 6, 173–182. https://doi.org/10.1016/0005-7967(68)90004-1
Testing for homogeneity of variance with Hartley’s F test. (n.d.). Retrieved from http://www.sussex.
ac.uk/Users/grahamh/RM1web/Testing%20for%20homogeneity%20of%20variance.pdf Vandenberg, B. (1993). Fears of normal and retarded children. Psychological Reports, 72, 473–474.
https://doi.org/10.2466/pr0.1993.72.2.473
About the Authors
Joy J. Burnham is a Professor in the Department of Educational Studies in Psychology, Research Methodology, and Counseling, at the University of Alabama.
Kagendo Mutua is a Professor in the Department of Severe and Profound Disabilities and Transition, Department of Special Education and Multiple Abilities, at the University of Alabama.
Desiree A. Tallent is a school psychologist in the Gwinnett County Public Schools.
Olivia P. Robinson is a doctoral candidate, Department of Special Education and Multiple Abili-ties, at the University of Alabama.
Kenya Bledsoe is a doctoral candidate in the Department of Educational Studies in Psychology, Research Methodology, and Counseling, at the University of Alabama.
Amy Davis is a doctoral candidate in the Department of Educational Studies in Psychology, Research Methodology, and Counseling, at the University of Alabama.
Address correspondence to Joy J. Burnham. The University of Alabama, Department of Educational Studies in Psychology, Research Methodology, and Counseling, Box 870231, Tuscaloosa, AL, USA 35487-0231. Email: <jburnham@ua.edu>