HAL Id: hal-03025064
https://hal.archives-ouvertes.fr/hal-03025064
Submitted on 26 Nov 2020HAL is a multi-disciplinary open access archive for the deposit and dissemination of sci-entific research documents, whether they are pub-lished or not. The documents may come from teaching and research institutions in France or abroad, or from public or private research centers.
L’archive ouverte pluridisciplinaire HAL, est destinée au dépôt et à la diffusion de documents scientifiques de niveau recherche, publiés ou non, émanant des établissements d’enseignement et de recherche français ou étrangers, des laboratoires publics ou privés.
Mineralization of TiO2 nanoparticles for the
determination of titanium in rat tissues
Jérôme Devoy, Emilie Brun, Anne Cosnefroy, Clémence Disdier, Mathieu
Melczer, Guillaume Antoine, Monique Chalansonnet, Aloïse Mabondzo
To cite this version:
Jérôme Devoy, Emilie Brun, Anne Cosnefroy, Clémence Disdier, Mathieu Melczer, et al.. Mineral-ization of TiO2 nanoparticles for the determination of titanium in rat tissues. Journal of Analyti-cal Chemistry / Zhurnal analiticheskoi khimii, MAIK Nauka/Interperiodica, 2016, 71, pp.418 - 425. �10.1134/s1061934816040043�. �hal-03025064�
Mineralization of TiO
2Nanoparticles for the Determination
of Titanium in Rat Tissues
1Jérôme Devoy
a,*, Emilie Brun
b, Anne Cosnefroy
c, Clémence Disdier
c, Mathieu Melczer
a,
Guillaume Antoine
a, Monique Chalansonnet
a, and Aloïse Mabondzo
caDepartment of Biomonitoring and Toxicology, Institut National de Recherche et de Sécurité Rue du Morvan,
CS 60027, F-54519 Vandoeuvre-les-Nancy, France
bLaboratoire de Chimie Physique, UMR CNRS 8000, Université Paris-Sud, F-91140 Orsay, France cCEA, Direction des Sciences du Vivant, iBiTec-S, Service de Pharmacologie et d’Immunoanalyse
F-91191, Gif-sur-Yvette, France
*e-mail: jerome.devoy@inrs.fr
Received March 15, 2015; in final form, July 27, 2015
Abstract—In order to draw appropriate conclusions about the possible adverse biological effects of titanium
dioxide nanoparticles (TiO2‒NPs), the so-called “dose‒effect” relationship must be explored. This requires
proper quantification of titanium in complex matrices such as animal organs for future toxicological studies. This study presents the method development for mineralizing TiO2‒NPs for analysis of biological tissues. We compared the recovery and quantification limits of the four most commonly used mineralization methods for metal oxides. Microwave-assisted dissolution in an HNO3–HF mixture followed by H2O2 treatment pro-duced the best results for a TiO2‒NPs suspension, with 96 ± 8% recovery and a limit of quantification as low as 0.9 μg/L. This method was then used for the determination of titanium levels in tissue samples taken from rats. However, our tests revealed that even this method is not sensitive enough for quantifying titanium levels in single olfactory bulbs or hippocampus in control animals.
Keywords: titanium, nanoparticles, mineralization, toxicology, rat, ICP‒MS
DOI: 10.1134/S1061934816040043
Titanium dioxide nanoparticles are widely pro-duced today, with an estimated upper bound of 38000 tons per year manufactured in the United States alone [1]. They are found in many commercial prod-ucts, including paint, cosmetics, pharmaceutical products, plastics, paper, ceramics, and food as an anticaking or whitening agent [1, 2]. Such massive production raises the question of their human and environmental toxicity.
While TiO2 particles were used in the past as a neg-ative control in vitro and in vivo toxicological studies [3], this practice was challenged after one study reported the development of lung tumors in rats after two years of exposure to high concentrations of fine TiO2 [4]. The International Agency for Research on Cancer (IARC) has therefore classified TiO2 as a Group 2B carcinogen (possibly carcinogenic to humans) [5]. Recent studies have also highlighted the ability of TiO2‒NPs to cross biological barriers and reach several organs [6, 7]. However, some absorption routes remain controversial [8–12].
One possible explanation for the discrepancies in the literature might be the difficulties involved in properly quantifying TiO2‒NPs in tissue samples. Inductively coupled plasma-mass spectrometry (ICP‒MS) is one of the most useful techniques avail-able but the procedure is complicated. Sample prepa-ration that results in acceptable and reproducible recovery, interference caused by different Ti isotopes, and estimation of the correct quantification limit in complex matrices such as biological tissues are among the hurdles to overcome. Only a few papers have dealt with this issue [13–15]. Other analytical tools, such as electrothermal vaporization ICP‒MS, might be con-sidered good alternatives for analyzing solid samples, but these often demand substantial financial invest-ment. In this study, we developed and fully-validated a reliable, quantitative ICP‒MS method for analyzing titanium contents in rat organ tissues. Different diges-tion/dissolution techniques are traditionally used to solubilize TiO2‒NPs in organic matter, such as the use of strong acids (e.g., hydrof luoric, sulfuric and nitric acids) and/or hydrogen peroxide together with micro-waves and/or heating systems [15–20]. In this study, we compared the four most common mineralization techniques for use with a TiO2‒NP solution. The most 1The article is published in the original.
JOURNAL OF ANALYTICAL CHEMISTRY Vol. 71 No. 4 2016
MINERALIZATION OF TIO2 NANOPARTICLES FOR THE DETERMINATION 419
appropriate digestion method was then selected on the basis of its recovery rate and quantification limit. This method was validated and then applied to determina-tion of titanium in different rat organs. The results were compared to available published data. We con-sider determination of a method’s recovery and quan-tification limit to be a pre-requisite and mandatory step that must be taken before analysing tissues from exposed animals and drawing conclusions about dose-effect relationships.
EXPERIMENTAL
Apparatus. A Varian 820-MS inductively coupled plasma mass spectrometer (ICP–MS) with an exter-nal sample introduction assembly with Peltier-cooled spray chamber, glass concentric nebulizer, peristaltic pump mounted outside the torch box and SPS3 auto sampler was used. A discrete dynode electron multi-plier detector provides nine decades of dynamic range in an all-digital pulse design. The Varian 820-MS sys-tem also features a Collision Reaction Interface (CRI) providing fast, f lexible, interference-free analysis using simple collision and reaction gases.
A Varian AA280Z Atomic Absorption Spectropho-tometer (AAS), equipped with a Zeeman background corrector, was used for atomic absorption measure-ment of titanium at 364.3 nm with a slit-width of 0.5 mm. A hollow cathode lamp of Ti (photron) was operated at 20 mA. Uncoated graphite tube cuvettes were purchased from Schunk Kohlenstofftechnik (Germany).
Transmission electron microscopy (TEM) analyses were performed as follows: a 3-μL droplet of the dis-persion was cast on formvar/carbon-coated copper grid for 2 min and imaged with a JEOL 1400 instru-ment (JEOL, Tokyo, Japan) operating at 80 keV (Ima-gif platform, Gif-sur-Yvette). Images were acquired using a post-column high resolution (11 megapixels) high speed camera (SC1000 Orius, Gatan) and pro-cessed with Digital micrograph (Gatan) and ImageJ (Schneider Nat Meth 2012 9671) software. Hydrody-namic diameter was measured by dyHydrody-namic light scat-tering using a ZetaSizer ZEN3600 (Malvern, Heren-berg, Germany) equipped with a 633 nm laser. Rat samples were weighed thanks to AB204 Mettler Toledo balance.
Reagents and solutions. Certified water was used (Trace Metals 3, RTC, QC1448). All chemicals used in the study were of analytical grade or higher. Nitric acid was used to prepare 2.0% HNO3 (v/v) with ultra-pure water. All single element stock solutions (1000 mg/L) were delivered by SCP Science and certi-fied for purity and concentration. Titanium standard solutions for ICP‒MS calibration were prepared (at concentration levels of 50 to 10000 ng/L) by diluting a 10 g/L titanium standard stock solution (140.050.220, SCP Science) with 2% (v/v) HNO3. An internal
stan-dard solution containing 100 μg/L of Ge was prepared by diluting a 1000 mg/L internal standard stock solu-tion (140.051.211, SCP Science) with 2% (v/v) HNO3. The internal standard was added to all samples and standard solutions.
External quality assurance was performed by par-ticipation in the following international comparison programs and quality assessment schemes: German External Quality Assessment Scheme (G-EQUAS) from the Institute and Out-Patient Clinic for Occupa-tional, Social and Environmental Medicine at Fried-rich-Alexander-University, Erlangen-Nuremberg, Germany, and Quebec Multielement External Quality Assessment Scheme (QMEQAS) at the Canadian Institut National de Santé Publique du Québec.
Titanium dioxide nanoparticle preparation. The TiO2‒NPs used in this study were in the form of Aeroxide® P25 TiO2 (Degussa, Sigma Aldrich), which consists of an 81 : 19 mixture of anatase and rutile. A stock solution was prepared by adding the desired weight of P25 to ultrapure water (MilliQ, Mil-lipore, Germany) and sonicating for 30 min in a Bran-son 2510 bath Bran-sonicator at a frequency of 40 kHz. The morphology and size of TiO2‒NPs in stock suspen-sions were determined by TEM. The mean particle diameter as observed by TEM was 21 ± 7 nm (n = 300). From dynamic light scattering measurements, TiO2‒NPs were found to agglomerate in both water and culture medium (474 ± 96 nm in distilled water and 747 ± 142 nm in culture media). The specific sur-face area (BET) was 50 ± 15 m2/g. Various concentra-tions for the digestion evaluation were made using a serial dilution of the stock solution. First, 125 mg of TiO2‒NPs powder was dispersed in 50 mL of distilled water. The 2.5 g/L suspension was then treated by ultrasound for 20 min and mechanically vibrated for 3 min. An intermediate suspension at 2.5 mg/L was prepared in order to prepare final solutions of 2 μg/L for testing the stability/homogeneity of the solution, and 5 μg/L for testing the mineralization methods.
Animal tissue samples. All experiments in this study were performed in line with the European guidelines related to the protection of animals used for experi-mental and other scientific purposes [21]. Prior to the study period, 62 eight-week-old male Sprague-Daw-ley rats (Charles River, Domaine des Oncins, Saint-Germain-sur-l’Arbresle, France), each weighing 250– 275 g, were housed under controlled environmental conditions for seven days in polycarbonate cages (43 cm long, 43 cm wide, 19 cm high, each holding six rats) with hardwood-chip bedding. The room tem-perature (22°C), humidity (55 ± 5%) and light cycle (07:00–19:00 h) were controlled automatically. Fil-tered tap water (pore size 0.3 μm) and γ-ray-sterilized food (UAR-Alimentation, Villemoisson, Epinay-sur-Orge, France) were provided ad libitum.
Animals were deeply anesthetized with pentobarbi-tal (60 mg/kg) and then killed by exsanguinations
through the abdominal aorta. Blood samples were taken and red blood cells (RBC) were isolated from plasma for the determination of titanium. Tissue and organs (brain, liver, spleen, kidneys, lungs) were col-lected and weighed. The brains of 46 rats were removed rapidly and then placed on glass plates at 0°C to sample the olfactory bulbs, hippocampus, frontal cortex and cerebellum. Tissue samples were placed in polyethylene microcentrifuge tubes and immediately put into liquid nitrogen storage at –180°C until analy-sis. All procedures used in this experiment were com-pliant with the local ethics committee.
Mineralization methods. The four most commonly-used digestion methods were tested (methods A to D, below). Method A is described by Wang [22] and Liu [23], and methods B, C and D are presented in Khos-ravi [24]. For each method, tissues were removed from storage and thawed. About 0.1–0.3 g of each tissue was weighed and digested.
Method A. Several hundred mg of sample was
digested overnight in 2 mL of concentrated nitric acid. After adding 0.5 mL of concentrated H2O2, the mixed solutions were digested completely using a Microwave Assisted Reaction System (MARS) Express instru-ment. The microwave digestion program consisted of a temperature ramp to 150°C over 15 min, followed by a ramp from 150 to 180°C over 15 min and then a 20-min hold at 180°C. Power was at 1200 W during the 50-min cycle. The MARS reactors were rinsed twice with 10 mL of 2% nitric acid and then transferred to a Tef lon reaction vessel containing the sample solution. The solutions were heated at 120°C until colourless and clear in order to remove the remaining nitric acid. Finally, the remaining solutions were diluted to 3 mL with 2% nitric acid and then analyzed for titanium content.
Method B. A tri-acid mixture was prepared with
concentrated nitric, hydrochloric and hydrof luoric acids mixed in a ratio of 3 : 1 : 3, and 30 mL of this mix-ture was added to each Tef lon reaction vessel contain-ing a sample. The mixed solutions were then com-pletely digested using MARS Express instrument. The microwave digestion program was the same as that used for method A. After cooling, the remaining solu-tion was diluted with 10 mL of ultrapure water. The aqueous solution was transferred to volumetric f lasks for appropriate dilution (ten-fold typically) and then analyzed for titanium content.
Method C. Samples were added to a 55 mL
micro-wave digestion vessel with 8 mL of concentrated nitric acid and 2 mL of concentrated HF. The samples were digested using MARS Express instrument, following the same temperature program as that used for meth-ods A and B. After cooling, the vessel was rinsed at least three times into a Tef lon beaker using approxi-mately 20 mL of a 2% nitric acid solution, and 2 mL of concentrated hydrogen peroxide was added to each beaker to digest any remaining organics. The beakers
were then heated on a hot plate at 180°C until 0.1 to 0.5 mL of each solution remained. The beakers were then removed from the hot plate, allowed to cool and rinsed at least three times into a 25 mL volumetric f lask using a 2% nitric acid solution before being stored for analysis. The final concentration of HF in the measured solution was low enough to allow using the routinely applied sample introduction system.
Method D. Samples were transferred to porcelain
crucibles for digestion and heated gently to dryness over a hot plate. To optimize the persulfate fusion method, various amounts of ammonium persulfate were added to the crucible. Care was taken to ensure that the residue at the bottom of the crucible was com-pletely covered with ammonium persulfate prior to fusion, and all the steps in the digestion process took place in an acid-resistant fume hood. Fusion was ini-tiated by heating with a laboratory Bunsen burner. Upon heating of the reaction vessel, the mixture began to fume. Fusion was complete once fuming had ceased (after about 3 min). The fusion product was soaked in 10 mL of 2% nitric acid solution in the reaction vessel for 30 min. The solution was then relocated into a 200 mL f lask and placed on a hotplate for further digestion by gentle boiling for 10 min. Finally, the clear solution was transferred to a 50 mL volumetric f lask and diluted with 2% nitric acid solution.
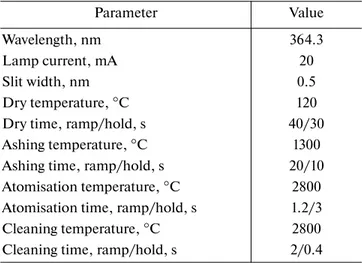
Determination of titanium. Prior to elemental anal-ysis, the tissues were mineralized according to one of the methods described above. In general, ICP‒MS was used to measure titanium concentrations in the samples. The typical method parameters (including CRI settings) used for the analyses are listed in Table 1. Analytical parameters for AAS are presented in Table 2. The internal standard concentration was 50 μg/L Ge for all samples and calibration solutions. Blanks and tissue digests were measured against an external calibration with internal standard correction. Titanium determination by conventional quadru-pole ICP‒MS has recently been optimized [15]. Unwanted interferences can also be minimized using collision/reaction cell technology [25]. For titanium determination with Varian 820-MS, the samples were injected directly. In order to avoid potential interfer-ences [13], the analyses were performed in CRI mode on 49Ti, an isotope that has a relatively low natural abundance (5.4%). In order to cross-check the ICP‒MS results, the same samples were analyzed by AAS when possible. The data were expressed either as micrograms per liter of digestion solution or as micro-grams per gram of fresh tissue. ICP‒MS was sensitive enough to quantify all of our samples and there was no need to improve the analytical quantification limit of 0.08 μg/L. In contrast, a significant effort was made to improve the method quantification limits (MQL).
Quantification limits. The limit of quantification (LOQ) can be estimated by taking 30 repeat measure-ments of the blank in the same series. The mean and
JOURNAL OF ANALYTICAL CHEMISTRY Vol. 71 No. 4 2016
MINERALIZATION OF TIO2 NANOPARTICLES FOR THE DETERMINATION 421
standard deviation (SD) of these 30 measurements are expressed in concentration. In this case, the LOQ is equal to the sum of the mean blank concentration plus ten standard deviations. Alternatively, the LOQ can be evaluated using the dilution of a standard solution or quality control sample at a low concentration with the dilutant. Eleven dilutions are prepared, altering the dilution by 10% each time (i.e., 100 + 0, 90+ 10, 80 + 20…0 + 100), and each preparation is measured 10 times in a single series. To determine the LOQ, the standard deviation and variation of the average (m) from the theoretical value (fidelity profile) are calcu-lated for each series of measurements. The concentra-tions and their respective SD values are then used to construct a Horwitz curve from which the LOQ can be extrapolated at SD = 15%. We chose the first way to estimate LOQ and we verified the consistency of this limit with the second way.
Method validation. Validation was done as described in our previous paper [26]. The linearity limit, precision (intermediate precision, repeatability and reproducibility), accuracy and sensitivity were estimated for the chosen method. This validation pro-cedure is in good agreement with that proposed by Peters et al. [27].
RESULTS AND DISCUSSION
Stability and homogeneity of TiO2‒NPs solution.
To be sure that the solution was homogeneous and sta-ble, the concentration of an initial 2 μg/L TiO2‒NPs aqueous solution (250 mL) was monitored at different times over 360 min; t = 0 corresponds to the end of ultrasonic and vibration treatment. An aliquot of 50 μL was sampled at different times (t = 0, 10, 15, 60, 90, 120, 180, 240, 300 and 360 min) and transferred to a 50 mL f lask of 2% HNO3. A ten-fold dilution was performed for each of these aliquots prior to graphite furnace (GF)-AAS analysis. At this level of titanium concentration, the GF is capable of direct analysis of solids [28], thus allowing the problem of TiO2‒NPs mineralization to be avoided. Fifteen analyses of this stock solution were performed over 360 min. The mean TiO2 concentration was 2.0 μg/L with a SD of 0.3 μg/L (RSD = 16%). A review of Cal-Prieto et al. [29] reported the RSD values for elemental analysis of animal tissue with GF-AAS ranging from 14 to 17%. The stock solution was therefore considered stable enough to be analyzed in our experimental conditions. Recovery. The digestions were first evaluated for the recovery of the 2 μg/L TiO2 NPs aqueous solution. Twelve aliquots of this solution were used for each
Table 1. Instrumental settings for the determination of titanium in HNO3 solution by ICP‒MS
Parameter Instrument parameter Setting
Gas f low parameters, L/min Plasma f low 13.5
Auxiliary fow 1.35
Nebulizer f low 1.00
Sheath f low 0.19
Plasma power RF power, kW 1.40
Sample introduction Sampling depth, mm 7.0
Pump rate, rpm 5.0
Ion optics, V First extraction lens –10
Second extraction lens –90
Third extraction lens –32
Corner lens –310
Mirror lens left 35
Mirror lens right 19
Mirror lens bottom 26
Fringe bias –7.0
CRI Gas settings Skimmer gas source He
Skimmer f low, mL/min 150
Quadrupole scan Scan mode Peak hopping
Dwell time, ms 100
Points per peak 1
Scans/replicate 20
digestion method. The results are presented in Table 3. The recovery rates of methods B, C and D were over 92% with standard deviations below 9%. At this con-centration level, a SD below 15% is equivalent to the SD values determined for quality control samples. In contrast, method A had a recovery rate of 56% and a SD of about 25%. These data were also used to deter-mine the digestion MDL.
Quantification limits. All digestion methods were applied to blank samples in order to measure the likely amounts of titanium contamination. Tef lon tubes, 15 mL polypropylene tubes and chemicals are all potential sources of titanium contamination [15]. One of the main advantages of using real blank samples to estimate the MQL is that any titanium contamination will be entirely integrated into the MQL.
As a further safeguard and quality check for tita-nium contamination, the vessels were rinsed in between two consecutive quantitative analyses,
fol-lowing the protocol of method C, and the final solu-tion was analyzed. If the titanium content was higher than 0.4 μg/L, the vessels were rinsed again and re-analyzed. This “contamination limit” was arbitrarily chosen but was later found to have yielded the best results. The quantification limits for each method are reported in Table 3. Titanium blank concentrations ranged from 0.3 to 1.3 μg/L depending on the method. MQL averages and standard deviations are also reported. Of the three methods, method C yielded the highest sensitivity (MQL = 0.9 μg/L) and a satisfac-tory recovery rate (96 ± 8%). This method was there-fore chosen for the analyses of biological samples.
Validation of the method. Linearity was investigated using 6 standard solutions with concentrations ranging from 0.8 to 52 μg/L (6 replicates). The linearity of the calibration curves for 49Ti was good over this concen-tration range (R2 > 0.999). The intermediate precision at any given level is defined as the degree of concor-dance between individual results obtained from a sin-gle sample tested in a sinsin-gle laboratory, but where one or more of the analyst, equipment and/or day varies. The intermediate precision was determined at two titanium concentrations: 1.24 and 6.20 μg/L. Samples were analyzed twice per day over 15 days. The maxi-mum standard deviation was 22%. The standard devi-ations obtained for 1.24 and 6.20 μg/L solutions were 6.6 and 3.5%, respectively.
The accuracy at any given level is the degree of con-cordance between the value certified by a recognized organization and the mean result obtained by applying the experimental procedure at least ten times. Accu-racy was measured at the two titanium concentrations, 1.24 and 6.20 μg/L. Thirty replicates of the samples were performed. The accuracies were 99.91 and 99.97%, respectively.
Matrix effects and recovery rates were double-checked by analyzing the titanium content of samples
Table 2. Instrumental settings for the determination of
tita-nium in HNO3 solution by GF-AAS
Parameter Value
Wavelength, nm 364.3
Lamp current, mA 20
Slit width, nm 0.5
Dry temperature, °C 120
Dry time, ramp/hold, s 40/30
Ashing temperature, °C 1300
Ashing time, ramp/hold, s 20/10
Atomisation temperature, °C 2800 Atomisation time, ramp/hold, s 1.2/3
Cleaning temperature, °C 2800
Cleaning time, ramp/hold, s 2/0.4
Table 3. Recovery rates and quantification limits for each method (mean values ± SD)
* For recovery, there were 12 sample repetitions, or 12 independent sample digestions; each sample was measured in triplicate. ** For LOQ, there were 30 sample repetitions; each sample was measured in triplicate; LOQ = mean + 10SD; instrumental quantifica-tion limit is equal to 0.08 μg/L.
Method Recovery*, % Expected titanium concentration, μg/L Mean titanium concentration, μg/L Blank mean titanium concentration, μg/L LOQ**, μg/L A 56 ± 25 5.4 3.0 ± 1.4 1.2 ± 0.2 3.7 B 98 ± 3 5.0 4.9 ± 0.2 0.5 ± 0.1 1.2 C 96 ± 8 5.2 5.0 ± 0.4 0.3 ± 0.1 0.9 D 92 ± 9 4.8 4.5 ± 0.4 1.3 ± 0.1 2.6
JOURNAL OF ANALYTICAL CHEMISTRY Vol. 71 No. 4 2016
MINERALIZATION OF TIO2 NANOPARTICLES FOR THE DETERMINATION 423
by both ICP‒MS and AAS. For ICP‒MS analysis in CRI mode, no matrix interferences on 49Ti, such as 33S16O, 32S16O1H or 31P18O, were observed. Direct AAS analysis of non-mineralized samples and ICP‒MS analysis of mineralized samples (method C, corrected for recovery) yielded titanium contents that usually differed by no more than 5%.
Application of method C to different types of biolog-ical organ tissues. Table 4 presents the titanium con-tents measured in different rat organs. Mean titanium concentrations are reported as “μg/L of final digestion solution” and “ng/g of tissue.” As the MQL is depen-dent on the sample mass, it is reported as “ng/g of tis-sue”.
As mentioned above, the LOQ for method C (as determined from blank analyses) was 0.9 μg/L (Table 3). In the rat tissue tests, the MQL ranged from 4.7 (in liver) to 330 ng/g (in a single olfactory bulb), depending on the sample mass and digestion method used. This important finding should be taken into consideration in future toxicological studies. Because the basal titanium content is highly variable from one organ to another, it is necessary to ensure that the measured titanium concentration is above the MQL for meaningful quantification. The number of control animals is also relatively important (n = 62 in this
study) in ensuring that statistically significant results are obtained.
In Table 4, even though the titanium contents were measured in different control animals, when the mea-sured concentrations were close to the MQL, such as those of cerebellum, 5 olfactory bulbs, 5 hippocampus and 5 frontal cortices, the respective standard devia-tions (13.4, 17.7, 13.9 and 17.6%; Table 4) were accept-able. Taking into account the variability between ani-mals, according to the Horwitz test these standard deviations confirm that the method detection and quantification limits are appropriate.
The standard deviations for organs with relatively high titanium concentrations, such as the brain, liver, spleen, kidney, lung or RBC are equal to 23.8, 39.8, 30.7, 31.5, 31.8 and 23.5%, respectively. Standard deviations at this level are frequently reported for the titanium contents of the major rat tissues [15, 18].
The MQL and method detection limit (MDL) are on the same order of magnitude as those found in the literature. Krystek et al. [15] proposed an MDL of 5 ng Ti/g tissue for liver, spleen, kidneys and blood. Our MDL are close to that level for kidneys and RBC (4.4 and 4.2 ng Ti/g tissue, respectively) but deviate from this value for liver and spleen (1.4 and 9.9 ng Ti/g tissue, respectively). The MQL and MDL expressed in “ng Ti/g tissue” are tissue mass-dependent and this
Table 4. Quantification limits for rat tissue samples
Notes: data were obtained from 62 rats. Masses in italics mean that the tissue or the sample was not taken entirely. LOQ in this table is
equivalent to MQL.
Rat matrices/organs Average sample mass, mg Mean titanium concentration, μg/L Mean titanium concentration, ng/g LOQ, ng/g LOD, ng/g Brain (n = 16) 1606 ± 388 4.8 ± 1.7 74.8 ± 17.8 13.7 4.1 Liver 4738 ± 1259 21.1 ± 11.8 108 ± 43 4.7 1.4 Spleen 668 ± 186 2. 6 ± 1.2 93.9 ± 28.8 33.1 9.9 Kidneys 1502 ± 466 7.0 ± 3.6 107 ± 33 14.7 4.4 Lung 1044 ± 192 3.9 ± 1.5 86.3 ± 27.5 21.2 6.4 RBC 1569 ± 344 5.0 ± 3.5 72.5 ± 17.1 14.1 4.2 Plasma 1984 ± 733 2.7 ± 1.3 34.5 ± 11.2 11.2 3.3 Cerebellum 2978 ± 23 0.7 ± 0.1 57.4 ± 7.7 54.1 16.2 Olfactory bulb (n = 32) 48.4 ± 5.2 0.3 ± 0.1 150 ± 63 333 99 5 Olfactory bulbs (n = 12) 239 ± 17 0.6 ± 0.1 61.4 ± 10.9 67.5 20.2 Hippocampus (n = 32) 51.6 ± 8.6 0.2 ± 0.1 116 ± 44 311 93 5 Hippocampus (n = 12) 251 ± 45 0.6 ± 0.1 66.1 ± 9.2 64.0 19.2 5 Frontal cortex (n = 18) 351 ± 57 0.8 ± 0.1 57.3 ± 10.1 45.8 13.7 Urine 3000 ± 281 11.0 ± 1.6 95.6 ± 19.2 7.4 2.2
should be kept in mind when results of future toxicoki-netic studies are presented.
The titanium contents measured in brain (75 ± 18 ng/g), liver (108 ± 43 ng/g), spleen (94 ± 29 ng/g), kidney (107 ± 34 ng/g), lung (86 ± 27 ng/g) and RBC (73 ± 17 ng/g) are relatively close to those reported by Wang et al. (n = 80) [22] and Liu et al. (n = 70) [23] in CD-1 mice. However, our results differ by one order of magnitude with those obtained by Fabian [8] (e.g., (1.6 ± 0.1) × 103 ng/g in rat lung compared to 86 ± 27 ng/g in our study) and Shinohara [30] (e.g. 5.0 ± 2.2 ng/g in rat kidney compared to 107 ± 34 ng/g in our study). These discrepancies may be due to the number of rats (n = 3 for Fabian and n = 25 for Shino-hara) and/or the species of rat (Wistar and F344/DuCrlCrlj rats, respectively) used in the differ-ent studies.
Finally, it is worth mentioning that Krystek et al. [15] compared different digestion methods (using HF) in different laboratories. The inter-laboratory study yielded consistent results for samples over 4 μg/g tis-sue. However, all control rat tissue samples have tita-nium contents lower than 0.15 μg/g tissue, their method quantification limit. In our work, the method we chose is sensitive enough to quantify titanium in all control rat organs/tissues except single olfactory bulbs and hippocampus.
The aim of this study was to compare and validate a method for quantifying titanium content in biologi-cal samples. Four mineralization methods were tested for recovery and quantification limit. The best results were obtained for a method that involved mineraliza-tion with nitric and hydrof luoric acid, leading to 96 ± 8% recovery and an LOQ down to 0.9 μg/L for a TiO2‒NPs suspension. A wide variety of rat organs were then analysed using this method. These showed that the MQL was matrix-dependent. For example, the method is not sensitive enough to quantify tita-nium levels in a single olfactory bulb and hippocam-pus in control rats. Bearing this limitation in mind, the method could be applicable to in vivo studies of TiO2‒NPs biokinetics and toxicokinetics studies and could also be transposed to human urine for biological monitoring of workers exposed to TiO2‒NPs. The nanotoxicology community is now fully aware of the need for a thorough characterization of the nano-objects used in their studies independently from any information provided by the supplier. This study has highlighted that the same attention should be paid to ICP‒MS quantification: no matter how tedious it might be, determining recovery rates and MQL of methods is a sine qua none condition for providing valuable data.
ACKNOWLEDGMENTS
The authors thank the French Alternative Energies and Atomic Energy Commission (CEA) and the
National Institute for Research and Safety (INRS). The authors particularly acknowledge the efforts of Alice Williams, Lise Merlen, Stéphane Boucard, Samuel Müller, Frédéric Cosnier and Robert Devoy for their technical assistance. This work has also ben-efited from the facilities and expertise of the Platform for TEM of Imagif (Centre de Recherche de Gif, wwww.imagif.cnrs.fr).
REFERENCES
1. Hendren, C.O., Mesnard, X., Dröge, J., and Wiesner, M.R., Environ. Sci. Technol., 2011, vol. 45, no. 7, p. 2562.
2. Occupational Exposure to Titanium Dioxide, Current Intelligence Bulletin 63, 2011 DHHS (NIOSH), publ. no. 2011-160.
3. Threshold Limit Values and Biological Exposure Indices
for 1992–1993, Cincinnati, Ohio: American
Confer-ence of Governmental Industrial Hygienists, 1992. 4. Lee, K.P., Trochimowicz, H.J., and Reinhardt, C.F.,
Toxicol. Appl. Pharmacol., 1985, vol. 79, p. 179.
5. IARS: Carbon Black and Titanium Dioxide, IARC Monographs, 2010, vol. 93.
6. Iavicoli, I., Leso, V., and Bergamaschi, A., J.
Nanoma-ter., 2012, 964381.
7. Shi, H., Magaye, R., Castranova, V., and Zhao, J.,
Part. Fibre Toxicol., 2013, vol. 10, no. 15, p. 1.
8. Fabian, E., Landsiedel, R., Ma-Hock, L., Wiench, K., Wohlleben, W., and van Ravenzwaay, B., Arch.
Toxi-col., 2008, vol. 82, no. 3, p. 151.
9. Xie, G., Wang, C., Sun, J., and Zhong, G., Toxicol.
Lett., 2011, vol. 205, p. 55.
10. Ze, Y., Sheng, L., Zhao, X., Hong, J., Ze, X., Yu, X., Pan, X., Lin, A., Zhao, Y., Zhang, C., Zhou, Q., Wang, L., and Hong, F., J. Hazard. Mater., 2014, vol. 264, p. 219.
11. Janer, G., Mas del Molino, E., Fernández-Rosas, E., Fernández, A., and Vázquez-Campo, S., Toxicol. Lett., 2014, vol. 228, no. 2, p. 103.
12. Bencsik, A. and Lestaevel, P., J. Biomed. Mater. Res., Part A, 2014, p. 1.
13. Potouridis, T., Völker, J., Alsenz, H., Oetken, M., and Püttmann, W., Anal. Bioanal. Chem., 2014, vol. 406, no. 11, p. 2495.
14. López-Heras, I., Madrid, Y., and Cámara, C., Talanta, 2014, vol. 124, p. 71.
15. Krystek, P., Tentschert, J., Nia, Y., Trouiller, B., Noël, L., Goetz, M.E., Papin, A., Luch, A., Guérin, T., and de Jong, W.H., Anal. Bioanal. Chem., 2014, vol. 406, p. 3853.
16. Korn, M.D.A., Ferreira, A.C., Costa, A.C.S., Nobrega, J.A., and Silva, C.R., Microchem. J., 2002, vol. 71, p. 41.
17. Lomer, M.C.E., Thompson, R.P.H., Commisso, J., Keen, C.L., and Powell, J.J., Analyst, 2000, vol. 125, p. 2339.
18. Sarmiento-Gonzalez, A., Encinar, J.R., Marchante-Gayon, J.M., and Sanz-Medel, A., Anal. Bioanal.
JOURNAL OF ANALYTICAL CHEMISTRY Vol. 71 No. 4 2016
MINERALIZATION OF TIO2 NANOPARTICLES FOR THE DETERMINATION 425
19. Sun, H.W., Zhang, X.Z., Niu, Q., Chen, Y.S., and Crittenden, J.C., Water, Air, Soil Pollut., 2007, vol. 178, p. 245.
20. Wildhagen, D., Krivan, V., Gercken, B., and Pavel, J.,
J. Anal. At. Spectrom., 1996, vol. 11, p. 371.
21. Directive 2010/63/EU on the approximation of laws, European Union, September 22, 2010.
22. Wang, J., Zhou, G., Chen, C., Yu, H., Wang, T., Ma, Y., Jia, G., Gao, Y., Li, B., Sun, J., Li, Y., Jiao, F., Zhao, Y., and Chai, Z., Toxicol. Lett., 2007, vol. 168, p. 176.
23. Liu, H., Ma, L., Zhao, J., Liu, J., Yan, J., Ruan, J., and Hong, F., Biol. Trace Elem. Res., 2009, vol. 129, p. 170. 24. Khosravi, K., Hoque, M.E., Dimock, B., Hintelmann, H., and Metcalfe, C.D., Anal. Chim.
Acta, 2012, vol. 713, p. 86.
25. Yip, Y. and Sham, W., TrAC Trends Anal. Chem., 2007, vol. 26, p. 727.
26. Devoy, J., Melczer, M., Antoine, G., Remy, A., and Heilier, J.F., Anal. Bioanal. Chem., 2013, vol. 405, p. 8327.
27. Peters, F.T., Drummer, O.H., and Musshoff, F.,
Foren-sic Sci. Int., 2007, vol. 165, p. 216.
28. Carnrick, G.R., Lumas, B.K., and Barnett, W.B., J.
Anal. At. Spectrom., 1986, vol. 1, p. 443.
29. Cal-Prieto, M.J., Felipe-Sotelo, M., Carlosena, A., Andrade, J.M., Lopez-Mahia, P., Muniategui, S., and Prada, D., Talanta, 2002, vol. 56, p. 1.
30. Shinohara, N., Danno, N., Ichinose, T., Sasaki, T., Fukui, H., Honda, K., and Kamo, M., Nanotoxicology, 2014, vol. 8, p. 132.