HAL Id: hal-02409107
https://hal.sorbonne-universite.fr/hal-02409107
Submitted on 13 Dec 2019
HAL is a multi-disciplinary open access
archive for the deposit and dissemination of
sci-entific research documents, whether they are
pub-lished or not. The documents may come from
teaching and research institutions in France or
abroad, or from public or private research centers.
L’archive ouverte pluridisciplinaire HAL, est
destinée au dépôt et à la diffusion de documents
scientifiques de niveau recherche, publiés ou non,
émanant des établissements d’enseignement et de
recherche français ou étrangers, des laboratoires
publics ou privés.
Chemical Heterogeneity of Mg, Mn, Na, S, and Sr in
Benthic Foraminiferal Calcite
Inge van Dijk, Aurélia Mouret, Marine Cotte, Sandrine Le Houedec, S. Oron,
Gert-Jan Reichart, Juan Reyes-Herrera, Helena Filipsson, Christine Barras
To cite this version:
Inge van Dijk, Aurélia Mouret, Marine Cotte, Sandrine Le Houedec, S. Oron, et al.. Chemical
Het-erogeneity of Mg, Mn, Na, S, and Sr in Benthic Foraminiferal Calcite. Frontiers in Earth Science,
Frontiers Media, 2019, 1, �10.3389/feart.2019.00281�. �hal-02409107�
doi: 10.3389/feart.2019.00281 Edited by: Aleksey Sadekov, University of Western Australia, Australia Reviewed by: Nina Keul, University of Kiel, Germany Takashi Toyofuku, Japan Agency for Marine-Earth Science and Technology, Japan *Correspondence: Inge van Dijk inge.van.dijk@nioz.nl
Specialty section: This article was submitted to Biogeoscience, a section of the journal Frontiers in Earth Science Received: 30 January 2019 Accepted: 17 October 2019 Published: 07 November 2019 Citation: van Dijk I, Mouret A, Cotte M, Le Houedec S, Oron S, Reichart G-J, Reyes-Herrera J, Filipsson HL and Barras C (2019) Chemical Heterogeneity of Mg, Mn, Na, S, and Sr in Benthic Foraminiferal Calcite. Front. Earth Sci. 7:281. doi: 10.3389/feart.2019.00281
Chemical Heterogeneity of Mg, Mn,
Na, S, and Sr in Benthic Foraminiferal
Calcite
Inge van Dijk1*, Aurélia Mouret1, Marine Cotte2,3, Sandrine Le Houedec1, S. Oron4,5,
Gert-Jan Reichart6,7, Juan Reyes-Herrera2,8, Helena L. Filipsson9and Christine Barras1
1LPG UMR CNRS 6112, University of Angers, UFR Sciences, Angers, France,2European Synchrotron Radiation Facility,
Grenoble, France,3Sorbonne Universités, UPMC Univ Paris 06, CNRS, UMR 8220, Laboratoire d’Archéologie Moléculaire et
Structurale (LAMS), Paris, France,4Department of Marine Geosciences, Charney School of Marine Sciences, University of
Haifa, Haifa, Israel,5The Interuniversity Institute for Marine Sciences, Eilat, Israel,6Department of Ocean Systems,
NIOZ-Royal Netherlands Institute for Sea Research and Utrecht University, Den Burg, Netherlands,7Faculty of Geosciences,
Utrecht University, Utrecht, Netherlands,8Faculty of Agricultural Sciences, Autonomous University of Chihuahua, Chihuahua,
Mexico,9Department of Geology, Lund University, Lund, Sweden
The chemical composition of fossil foraminiferal shells (tests) is widely used as tracers for past ocean chemistry. It is, therefore, important to understand how different (trace) elements are transported and incorporated into these tests from adjacent seawater. The elemental distribution within the walls of foraminiferal tests might be used to differentiate between proposed transport mechanisms. Here, the microdistribution of Mg, Mn, Na, S, and Sr in tests of three species of foraminifera, known to have contrasting test chemistry, is investigated by a combination of electron probe microanalysis (EPMA) and nanoscale secondary ion mass spectrometry (nanoSIMS), micro-X-ray fluorescence (µXRF), and micro-X-ray absorption near-edge structure (µXANES) analyses. The three investigated species are the symbiont-barren Ammonia sp. T6 and Bulimina marginata, which precipitate a low-Mg calcite test, and the symbiont-bearing species Amphistegina lessonii, which produces a test with intermediate Mg content. Because all analyzed tests were formed under controlled and identical laboratory conditions, the observed distributions of elements are not due to environmental variability but are a direct consequence of the processes involved in calcification or, in the case of A. lessonii, possibly symbiont activity. Despite some variability in elemental microdistribution between specimens from a given species, our combined dataset shows species-specific distributions of the elements (e.g., peak heights and/or band-widths) and also a systematic colocation of Mg, Na, S, and Sr for all three species, suggesting a coupled or simultaneous uptake, transport, and incorporation of these elements during chamber addition. The observed trace element patterns generally reflect a laminar calcification model, suggesting that heterogeneity of these elements is intrinsically linked to chamber addition. Although the incorporation of redox-sensitive Mn depends on the Mn concentration of the culture medium, the Mn distribution observed in Ammonia sp. suggests that Mn transport is similarly linked to laminar calcification dynamics. However, for B. marginata, Mn banding was sometimes anticorrelated with Mg banding, suggesting that (bio)availability, uptake, and transport of Mn differ from those for
van Dijk et al. Chemical Heterogeneities in Foraminiferal Shells
Ammonia sp. Our results from symbiont-bearing A. lessonii suggest that the activity of symbionts (i.e., photosynthesis/respiration) may influence the incorporation of Mn owing to alternation of the chemistry in the microenvironment of the foraminifera, an important consideration in the development of this potential proxy for past oxygenation of the oceans.
Keywords: benthic foraminifera, chemical heterogeneity, elemental banding, element incorporation, manganese, biomineralization
INTRODUCTION
The chemical composition of the carbonate shells (tests) of foraminifera, unicelullar cosmopolitan protists, is widely used to reconstruct past ocean conditions (Lear et al., 2000; Hönisch and Hemming, 2005). Lately, the incorporation of redox-sensitive element manganese (Mn) has been studied as a potential proxy for paleo-oxygenation or sediment redox conditions (e.g.,
Reichart et al., 2003; Groeneveld and Filipsson, 2013; Koho et al., 2015; McKay et al., 2015; Groeneveld et al., 2018; Ní Fhlaithearta et al., 2018; Petersen et al., 2018; Guo et al., 2019). However, questions have been raised about the heterogeneity of Mn in the test wall for different species of foraminifera (Barras et al., 2018), which is crucial to know for the development and application of foraminiferal test Mn/Ca as an oxygenation proxy. Similarly, microscale variations in the magnesium (Mg) distribution, which are observed in all species, are hypothesized to be the cause of most of the Mg/Ca variability within and between specimens (Elderfield et al., 2002; Eggins et al., 2003; Sadekov et al., 2005). This potentially affects the reliability of Mg/Ca-based proxies (e.g., Nürnberg et al., 1996) used for reconstruction of paleo-temperatures (Sadekov et al., 2008) and habitat migration of planktonic foraminifera (Eggins et al., 2003). Investigating and understanding trace element distribution at the sub-micrometric scale in foraminiferal tests are, therefore, needed in order to fundamentally understand the processes involved and minimize the potential impact on paleo-environmental reconstructions.
Heterogeneity is a trait of biologically precipitated minerals (Allison et al., 2001; Freitas et al., 2009), including the calcium carbonate precipitated by foraminifera. This trace element variability has been explained by so-called vital effects, a term introduced byUrey et al. (1951), which covers varying factors and processes, including (i) ontogenetic-related changes or migration of foraminifera in the sediment or water column during their life cycle (e.g.,Elderfield et al., 2002; Hintz et al., 2006) and (ii) processes involved in or active during biomineralization (Weiner and Dove, 2003), for instance, pH regulation during chamber formation (Toyofuku et al., 2017), or the presence of organic compounds (Kunioka et al., 2006; Mavromatis et al., 2017).
Over the last decade, there has been an increase in the use of high-resolution analysis techniques, such as laser ablation inductively coupled plasma mass spectrometry (LA-ICP-MS). This allowed for the measurement of single chambers of foraminiferal tests (Wu and Hillaire-Marcel, 1995; Reichart et al., 2003) and has been further developed to enable imaging (Evans and Müller, 2013) and depth profiling (Vetter et al.,
2013; Fehrenbacher et al., 2015) chemical variation within a single chamber wall. These methods are ideally used for larger foraminifera or foraminifera with a relatively thick test wall. Depth profiling is more complicated for most of the smaller foraminiferal species, because chamber walls are thin (∼10 µm) and generally also more curved, causing mixing of the elemental signal from different depths within the test. Other approaches exist for analyzing element distribution on microscale in foraminiferal calcite using non- (or less) destructive methods, including electron probe microanalysis (EPMA;Sadekov et al., 2005) or nanoscale secondary ion MS (nanoSIMS;Sano et al., 2005; Hoppe et al., 2013). In addition to the distribution of trace elements, the coordination and speciation of elements can be analyzed using micro-near-edge X-ray absorption fine structure (µNEXAFS) or micro-X-ray absorption near-edge structure (µXANES) (Reeder et al., 1999; Branson et al., 2013), providing information on the characteristic of element incorporation, and substitution in foraminiferal calcite and, therefore, calcification mechanisms.
Chemical variability, or so-called banding, of Mg/Ca in the chamber wall has been the most widely studied owing to the importance of Mg/Ca as a proxy for seawater temperature (Nürnberg et al., 1996). For planktic foraminifera, experiments show Mg variability being linked to day–night cycles (Eggins et al., 2004; Spero et al., 2015; Fehrenbacher et al., 2017) or crust formation (Eggins et al., 2003; Steinhardt et al., 2015). However, because a day–night Mg/Ca variation is observed for both symbiont-barren and symbiont-bearing species (for an overview, seeFehrenbacher et al., 2017), chemical heterogeneity in the test is not likely to be directly linked to symbiont activity. A chemical variation within test of benthic species has been studied less intensely (e.g., Erez, 2003; Branson et al., 2015; van Dijk et al., 2017b, 2019; Geerken et al., 2018) and is often attempted to be explained by processes involved in biomineralization, like transport of ions during calcification (Geerken et al., 2019) or changes in internal pH during calcification (Branson et al., 2015). For the accuracy of the application of foraminiferal E/Ca ratios (where E represents a trace element) as proxies for past environmental conditions, it is important to deconvolute elemental heterogeneity caused by vital effects from the environmentally induced variability (e.g., Zeebe et al., 2008; Hathorne et al., 2009). To investigate the biological-induced trace element variability, it is necessary to study the elemental variability of foraminiferal calcite grown under controlled and geochemically stable conditions. Culture experiments in stable conditions also show banding of several elements, including Na
(Geerken et al., 2018, 2019) and S (Paris et al., 2014; van Dijk et al., 2017b). However, most of these studies so far focused on one (group of) species and/or one element of interest, as a function of changes in physical parameters such as salinity (Geerken et al., 2018), light-level (e.g.,Fehrenbacher et al., 2017), or seawater chemistry (e.g.,Paris et al., 2014). The distribution of multiple trace elements in foraminiferal tests has been studied less often but is recently receiving more and more attention (Geerken et al., 2019; Glock et al., 2019).
In this study, we present the microscale distribution of Mn and compare this to the distribution of Mg, Na, S, and Sr within the test wall of benthic foraminifera. We investigate test walls of three different species: symbiont-barren species Ammonia sp. and Bulimina marginata precipitating a low Mg test and symbiont-bearing species Amphistegina lessonii, which calcifies a test with intermediate Mg content. Studies focusing on Amphistegina and Ammonia are scarce (Erez, 2003; van Dijk et al., 2017b, 2019; Geerken et al., 2018) compared with studies on planktonic species, and this is the first time that element distribution within the tests walls of B. marginata is investigated. Previous research by LA-ICP-MS measurements on single chambers (Barras et al., 2018) showed contrasting ontogenetic trends in Mn/Ca between Ammonia sp. and B. marginata, which resulted in a model including Mn adsorption between calcite layers to explain these trends. In the present study, we aim to improve the spatial resolution of the analyses, and we study in detail the microdistribution of this element using EPMA and nanoSIMS, as well as the speciation of Mn by µXANES to test this model. The nanoSIMS dataset complements the dataset obtained by EPMA, enabling us to extend our dataset to the lower culture treatment [Mn], and adds information on Sr distribution. By including species with and without symbionts, we, furthermore, examine whether symbiont activity in the microenvironment around the foraminifer (e.g., production of oxygen) influences incorporation of Mn. By including several other elements (Mg, Na, S, and Sr), it is possible to deconvolve vital effects that affect other elements from effects typical for Mn.
MATERIALS AND METHODS
Experimental Protocol
The specimens analyzed in this study have been cultured in controlled laboratory conditions with different manganese concentrations ([Mn] = ∼2, 10, 100, and 600 µmol/L). Specimens of Ammonia sp. T6 (identified followingRichirt et al., 2019) and Bulimina marginata have been grown for 2 months in the experiments described in detail in Barras et al. (2018). Specimens of Amphistegina lessonii were cultured in the same system in slightly different conditions (mainly temperature and light) that are described below. Specimens of A. lessonii were collected at a depth of between 10 and 25 m by scuba diving in the Red Sea, near Eilat, on June 2016. Average temperature and salinity were, respectively, ∼24◦C and 40 at the time
of collection. Samples were transported to the laboratory at the University of Angers (France), stored in artificial seawater (ASW, Red Sea Salt) with salinity of 35 laced with calcein (10
mg/L), and kept at laboratory temperature (∼24◦C). Calcein
labeling prior to the experiment allows for the identification of chambers formed before the start of the experiment to distinguish chambers precipitated during the experiment (Bernhard et al., 2004). An Olympus SZX-164 stereomicroscope equipped with epifluorescence optics (excitation at 470 nm, emission at 500 nm) was used to observe calcein-labeled chambers. Specimens of A. lessonii were cultured, in the summer of 2016, in the same setup as described in Barras et al. (2018), that is, in four aquaria maintained in hypoxic conditions with different manganese concentrations ([Mn] = ∼2, 10, 100, and 600 µmol/L). However, to culture this tropical species, a day–night cycle was set up (12 h/12 h, light intensity ∼10 µEinstein), and the temperature was set at 25◦C. The lower temperature used in the previous
experiment (T = 12◦C;Barras et al., 2018) might have decreased
symbiont activity (Fujita et al., 2014) and probably reduced calcification. After calcein pre-staining, specimens of both species were added in open vials (50 ml) that were introduced in the aquaria. To each vial, 100 µl of frozen Phaeodactylum tricornutum (48.6 mg/L) was added.
Four aquaria were filled with 10 L of ASW (Red Sea Salt) with salinity of ∼35. In three aquaria, Mn was enriched by adding MnCl2·2H2O (Merck), resulting in four conditions with different
[Mn]: Aq0 ∼ 2 µmol/L (corresponding to natural concentration of Mn in Red Sea Salt), Aq10 ∼ 10 µmol/L, Aq100 ∼ 100 µmol/L, and Aq600 ∼ 600 µmol/L. The highest [Mn] corresponds to pore water [Mn] from coastal Mn-rich environments (Sulu-Gambari et al., 2016; Barras et al., 2018). To maintain stable [Mn] during the duration of the experiment, all four aquaria were kept at hypoxic conditions by continuous bubbling with a mixture of N2/CO2(0.04%) gas, and oxygen concentration was continuously
monitored with four micro-optodes (Unisense). For the duration of the experiment, the average dissolved oxygen saturation was 35 ± 3% (standard deviation [SD]) for Aq0, 29 ± 5% for Aq10, 30 ± 3% for Aq100, and 32 ± 3% for Aq600. Beside oxygen saturation, several physico-chemical parameters were monitored weekly, including salinity, pH, and total alkalinity (Table 1).
All four aquaria were sampled daily to measure elemental composition of the seawater. Concentrations of Ca, Mg, Mn, Na, and Sr were measured by ICP atomic emission spectroscopy (ICP-AES, Thermo Scientific iCAP 6300 Radial), and results are presented in Table 1. Mn/CaSEAWATER was stable over the
experiment, with concentrations of 0.30 ± 0.13, 1.09 ± 0.03, 9.76 ± 0.59, and 50.89 ± 0.78 mmol/mol for Aq0, Aq10, Aq100, and Aq600, respectively. Values are very similar to those of the experimental setup ofBarras et al. (2018). Average element-to-calcium ratios were 4.86 ± 0.09 mol/mol for Mg/CaSEAWATER,
45.67 ± 0.61 mol/mol for Na/CaSEAWATER, and 11.77 ± 0.15
mmol/mol for Sr/CaSEAWATER. The chemical composition of
the culture media is very similar to that of Barras et al. (2018): 4.87 ± 0.05 mol/mol for Mg/CaSEAWATER, 45.44 ±
0.51 mol/mol for Na/CaSEAWATER, and 11.41 ± 0.11 mmol/mol
for Sr/CaSEAWATER.
The duration of the experiment with tropical foraminifera was 17 days, in which foraminifera grew one to five new chambers. After the experiment, foraminifera were cleaned with 5% NaOCl
van Dijk et al. Chemical Heterogeneities in Foraminiferal Shells
TABLE 1 | Culture parameters from the four different treatments (Aq0, Aq10, Aq100, and Aq600) used in the experiment.
Parameter Aq0 Aq10 Aq100 Aq600
O2sat (% ± SD) 35 ± 3 29 ± 5 30 ± 3 32 ± 3 Salinity 35.9 ± 0.6 35.8 ± 0.5 35.9 ± 0.4 35.9 ± 0.4 Total alkalinity (mmol/L ± SD) 2,132 ± 2 2,130 ± 2 2,088 ± 2 2,078 ± 2 pH (Avg. ± SD) 7.98 ± 0.04 7.93 ± 0.05 8.00 ± 0.02 8.00 ± 0.01 Ca (mM) 10.6 ± 0.1 10.5 ± 0.2 10.2 ± 0.1 10.2 ± 0.1 Mg (mM) 51.1 ± 0.5 50.3 ± 0.8 50.8 ± 0.7 49.9 ± 0.7 Mn (µM) 3.1 ± 1.4 11.5 ± 0.4 99.7 ± 6.2 517.6 ± 10.5 Na (mM) 483.6 ± 5.5 474.4 ± 8.1 468.4 ± 5.5 471.9 ± 7.6 Sr (µM) 123.8 ± 1.4 122.9 ± 1.9 121.1 ± 1.1 121.5 ± 1.0 Mg/Ca (mol/mol) 4.80 ± 0.01 4.77 ± 0.02 4.98 ± 0.05 4.91 ± 0.03 Mn/Ca (mmol/mol) 0.30 ± 0.13 1.09 ± 0.03 9.76 ± 0.59 50.89 ± 0.78 Na/Ca (mol/mol) 45.44 ± 0.39 44.97 ± 0.21 45.86 ± 0.24 46.40 ± 0.39 Sr/Ca (mmol/mol) 11.64 ± 0.08 11.65 ± 0.04 11.86 ± 0.05 11.94 ± 0.08
Average value (±SD) of physiochemical parameters of the culture media; oxygen saturation, salinity (n = 3), total alkalinity (n = 3), and pH (n = 4). Average elemental composition and E/Ca values (±SD) of the artificial seawater, measured by inductively coupled plasma atomic emission spectroscopy (ICP-AES).
for a minimum of 1 h until the tests were bleached. After being rinsed three times with de-ionized water, specimens were oven-dried (45◦C) and stored until measurements.
Elemental Microdistribution in
Foraminiferal Tests
Electron Probe Microanalysis
Specimens of A. lessonii from the experiment described in this study, together with specimens of Ammonia sp. and B. marginata from the study ofBarras et al. (2018), were measured on a field emission EPMA (JEOL JXA-8530F) at Utrecht University (the Netherlands) to investigate the intra-test incorporation of Mg, S, Na, and Mn. Specimens of each species from all of the four culture conditions (Aq0, Aq10, Aq100, and Aq600) were embedded under vacuum in resin (2020 Araldite R resin by Huntsman
International LLC) using 2.5-cm epoxy plugs. Samples were polished using increasingly finer sanding paper, resulting in exposure of cross section of chamber walls. In the final polishing step, a diamond emulsion with grains of 0.04 µm was used to create a smooth surface. Scanning electron microscope (SEM) images were taken with a tabletop Hitachi TM3000 at the Royal Netherlands Institute for Sea Research (the Netherlands) to find areas of interest (Figure 1).
After the carbon coating, the samples were placed in the microprobe sample holder. After selection of target areas, several small high-resolution maps (130 × 97 pixels, pixel size was generally 0.2 µm) were analyzed at 12.0 kV in beam scan mode with a dwell time of 350 ms, providing elemental maps for Ca, Mn, Mg, S, and Na. Part of the data obtained for Mg and S have previously been published (van Dijk et al., 2019), but the dataset is extended by including more maps and will be used for
comparison with Mn and Na distribution. All EPMA data were further processed in MATLAB following a protocol described in
van Dijk et al. (2019). In short, resin, pores, and edge areas were excluded from the final maps by excluding areas where Ca levels were <10,000 counts (Figure 2C). The resulting concentration (level) maps were converted to semiquantitative element-to-calcium maps (E/Ca) by applying a calibration based on mineral standards. We used diopside (CaMgSi2O6) for Ca, forsterite
(Mg2SiO4) for Mg, jadeite (NaAlSi2O6) for Na, celestine (SrSO4)
for S, and tephroite (Mn2SiO4) for Mn. Resulting matrices of
Mg, S, Na, and Mn were divided with the Ca matrix, to allow for a semiquantification of the counts to concentrations to obtain E/Ca (mmol/mol) maps. We choose to report these ratios as E/CaEPMA to clearly distinguish these data from quantitative
data obtained by other methods, for example, LA-ICP-MS. For all maps, distribution profiles were created by selecting rectangular areas perpendicular to the chamber wall, so-called transect maps, after rotation of the total matrix (Figure 2D). Resin and pore areas were, as mentioned above, also excluded for the calculation of profiles. For every element, we calculated average E/CaEPMAper column of the transect maps to create an
E/CaEPMAdistribution profile, which was plotted and compared
with the distribution profile of Mg/CaEPMA(Figure 3). Using the
coefficient of determination (R2) and the slope of the relation, we assess whether element distributions of S, Na, and Mn are (positively or negatively) significantly correlated with the Mg distribution.
Distribution profiles of the transect maps were used to localize peak and base areas and determine peak value (maximum value within band area, E/CaMAX) and the sequential base
value (minimum value within non-band area, E/CaMIN) of each
element, of the primary and any secondary peaks, counted from interior to exterior (for a more detailed description, see Figure 2 in van Dijk et al., 2019). For S/CaEPMA and
Na/CaEPMA, which have maximum values close to the high
intensity band of Mg/CaEPMA, we calculated maximum and
minimum E/CaEPMA values at the location of the Mg/CaEPMA
peak and base, respectively. This allows us to examine the difference of peak and/or base intensity within one chamber wall and between species for Mg/CaEPMA, S/CaEPMA, and
Na/CaEPMA and investigate the link in the microdistribution
of these elements. Mn/CaEPMA was often not correlated to the
highly concentrated band of Mg/CaEPMA, so we calculated the
maximum and minimum transect values independently from the location of the Mg band. We express the peak intensity as “peak factor,” which is the peak value divided by the associated base value (E/CaMAX/E/CaMIN). After testing for variance with an
F-test, we performed bilateral unpaired t-tests to determine if values of primary and secondary peaks (PI/PII) and bases (BI/BII), as well as peaks and bases (PI/BI or PII/BII), are significantly (p < 0.05) different. We also indicate which p-values are significant after Bonferroni correction, which corrects for type I errors (while underestimating for type II errors), leading to a more conservative critical value. This (more conservative) critical value (pBonferroni)is determined by p < 0.05/n, in which n is the total
FIGURE 1 | Examples of SEM images of polished specimens of (A) Ammonia sp. T6 (B), Bulimina marginata, and (C) Amphistegina lessonii. Chambers precipitated during the experiment are recognized owing to pre-staining (see Experimental Protocol section) and are numbered from final (F) to older chambers (e.g., F-1 and F-2). Scale bar is 100 µm. SEM, scanning electron microscope.
FIGURE 2 | Example of EPMA data treatment from a specimen of Amphistegina lessonii (F-2) with an asterisk indicating outer side of the test. (A) SEM image of the area of interest. (B) Map of raw Ca counts (cps). (C) Resulting Ca matrix after cutoff at 10,000 cps, removing resin, and pore areas, as well as potential edge effects. (D) Mg/Ca map is rotated (in this example, 5◦), and a rectangular area perpendicular to the test wall is selected for transect analysis. EPMA, electron probe
microanalysis; SEM, scanning electron microscope.
Nanoscale Secondary Ion Mass Spectrometry Analyses
To investigate the distribution of Mn in the different species from aquaria with the lowest seawater [Mn], we selected several specimens of Ammonia sp., B. marginata, and A. lessonii for a nanoSIMS analysis. NanoSIMS has a lower detection limit and better spatial resolution than has EPMA and, therefore, may show if high-Mn absorption layers are present in the test wall, as hypothesized byBarras et al. (2018). Specimens were embedded in resin (EpoFix by Struers) in aluminum rings with a diameter of 1 cm. Samples were dried under vacuum at room temperature overnight, which allowed for a gentle degassing of the samples. Samples were polished using increasingly finer polishing paper, from 30 to 0.3 µm, resulting in a smooth exposure of cross section of chamber walls. SEM images were taken at SCIAM platform
at the University of Angers (France) to assert the quality of the polishing and identify areas of interest. The samples were coated with a 15-nm gold layer to prevent buildup of a charge on the surface during the nanoSIMS analyses. A primary beam of O−, focused to a spot size of about 450 nm (full width at
half maximum [FWHM]) permitted extraction of40Ca+,45Ca+, 24Mg+,55Mn+,86Sr+, and88Sr+ ions, which were counted in
parallel in electron multipliers. In the imaging mode, selected areas (usually 25 × 25 µm) were first implanted in order to clean up the surface. The area was then imaged by scanning a smaller beam (∼450 nm, 26 pA) with a resolution of 256 × 256 pixels and a dwell time of 5 µs/pixel. Typically, 40 layers of data acquisition were collected and accumulated (after drift correction) into one set of individual isotopic images using the L’IMAGE R software (developed by Dr. Larry Nittler, Carnegie
van Dijk et al. Chemical Heterogeneities in Foraminiferal Shells
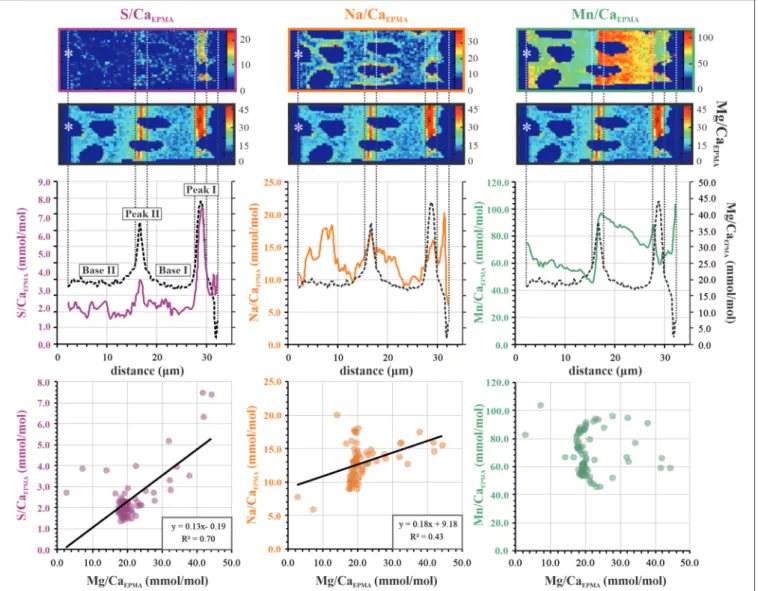
FIGURE 3 | Example of transect analysis for S/CaEPMA(left panels; purple), Na/CaEPMA(center panels; orange), and Mn/CaEPMA(right panels; green). The top three
panels show E/CaEPMAtransect maps with an asterisk indicating exterior of the foraminiferal test (for full EPMA area, see Figure 2). Middle panels show distribution
profiles calculated from the average E/CaEPMAper column over the transect map. In the S/CaEPMAprofile, primary (peak I and base I) and secondary (peak II and base
II) bands are indicated. The lower panels show E/CaEPMAvs. Mg/CaEPMAvalues of the distribution profile. The dotted vertical lines are added to illustrate the location of
Mg/Ca bands. EPMA, electron probe microanalysis.
Institution of Washington DC, USA). In addition, specific areas of interest were selected for horizontal or vertical linescans with higher spatial resolution. In this case, pre-sputtering was first performed to clean up the surface (two linescans with a dwell time of 2 s/pixel and 56 pA for the O− beam; spot size of
around 1 µm). The data acquisition was performed in the same track with a primary beam focused to about 400 nm (10 scans with 2 s/pixel). The accumulated Mg/Ca, Mn/Ca, and Sr/Ca ratios from these linescans were normalized to a range between 0 and 1 in order to facilitate comparison of peak positions. Absolute concentration ratios were not obtained. Applying the same method as for the EPMA data, we obtained peak and base values, which could be compared using bilateral unpaired t-tests (significance level: 95%).
Micro-X-Ray Fluorescence and Micro-X-Ray Absorption Near-Edge Structure Analyses
To investigate the Mn speciation in tests of Ammonia sp. and B. marginata cultured in different [Mn], we performed µXRF and µXANES analyses at the Mn K-edge. These analyses were performed with the scanning X-ray microscope (SXM) end-station hosted at the X-ray microscopy beamline ID21 of the European Synchrotron Radiation Facility (ESRF) in Grenoble (France;Cotte et al., 2017). Analyses were performed on samples of Aq100 and Aq600 prepared for EPMA (see Electron Probe Microanalysis for embedding and polishing details). Samples were mounted vertically, with an angle of XRF 62◦ with respect
to the incident beam. X-rays were generated using an undulator in which gap was adjusted synchronously with the fixed exit
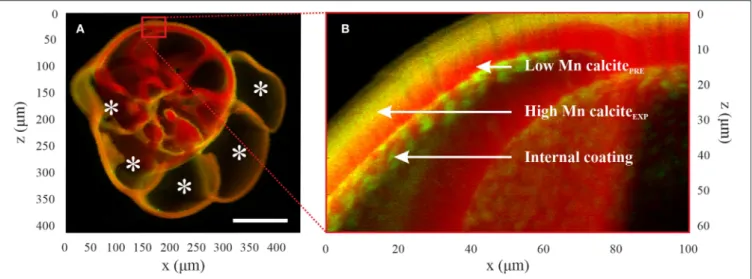
FIGURE 4 | µXRF elemental maps of Mn (green) and Ca (red) map of a specimen of Ammonia sp. T6 in culture conditions (Aq600). (A) Overview map; the five calcified new chambers are noted with an asterisk. They are enriched in Mn compared with chambers calcified prior to the experiment, and there is coverage of the entire test with enriched Mn calcite from the experiment. Scale bar is 100 µm. (B) The magnified image shows three locations of interest that have been defined for the µXANES analyses: calcite formed in enriched Mn stable conditions (“high Mn calciteEXP”), calcite formed prior to the experiment (“low Mn calcitePRE”), and internal
coating. µXRF, micro-X-ray fluorescence; µXANES, micro-X-ray absorption near-edge structure.
double-crystal Si (111) monochromator (DCM) Bragg angle. The DCM energy calibration was performed using a Mn foil (maximum of the derivative of XANES spectrum set at 6.5392 keV). The incident beam was focused with Kirkpatrick–Baez mirrors down to a probe of 0.6 × 0.3 µm² (h × v). XRF signals were collected in the horizontal plane and at 69◦ with
respect to the incident beam direction by means of an 80-mm² single energy-dispersive silicon drift detector from SGX (25 µm Be window). Elemental maps were obtained by exciting XRF employing a monochromatic primary beam of 6.64 keV while raster scanning the samples over two-dimensional (2D) regions (100 ms/pixel). The software PyMca (Solé et al., 2007; Cotte et al., 2016) was used to batch-fit the XRF spectra and to separate the contribution of the different elements. Low-resolution maps were first acquired over the entire test with a 1–2-µm step (Figure 4A). On these overview maps, high-resolution maps were acquired with a 0.2–0.5-µm step to identify the main regions of interest (Figure 4B): calcite with high [Mn] formed in the experimental conditions (“high Mn calciteEXP”), calcite formed prior to the
experiments with low [Mn] relative to the chambers calcified in culture (“low Mn calcitePRE”), calcite formed prior to the
experiments with high [Mn] relative to the chambers calcified in culture (“high Mn calcitePRE”; note that this is only the case for
one specimen of B. marginata), and the internal coating found on the internal side of the test that exhibits a high [Mn] and which has a patchy distribution. When present, this internal coating was showing high concentration of Mn in the pores of the test.
On these detailed maps (Figure 4B), µXANES spectra were acquired at the points of interest in XRF mode by scanning the primary energy at the Mn K-edge (6.52–6.64 keV; energy step: 0.4 eV). Spectra normalization was performed using PyMca software. To identify if Mn shows the same coordination depending on different parameters [i.e., species, [Mn] in the seawater of the aquaria, and locations of interest in the
sample], a statistical analysis of spectra was performed using the Orange open-source software (Demšar et al., 2013; Toplak et al., 2017). Each spectrum was labeled by the name of species (Ammonia or Bulimina), the culture media conditions (Aq100 or Aq600), and the location of the spectrum in the test structure, as determined from the µXRF maps of Ca and Mn (i.e., “high Mn calciteEXP,” “low Mn calcitePRE,” “high
Mn calcitePRE,” and “internal coating”). A set of references
was also included in the dataset. Some of the references were acquired during the same session at ID21, that is, references Mn metal and MnO2, MnO(OH), Mn3O4, MnCl2, and MnSO4,
prepared as powder spread in a tape (spectra simultaneously acquired in transmission and XRF modes). Other reference spectra were kindly provided by Dr. Samuel M. Webb (SLAC) [manganoan calcite ((Ca,Mn)CO3), kutnohorite (CaMn(CO3)2),
rhodochrosite (MnCO3), and KMnO4], calibration tuned using
a MnCO3 reference) previously published in Johnson et al.
(2016)and by Peter Kopittke (MnSO4, MnPO4, MnCO3, Mn(II)
oxide (MnO), Mn(III) oxide (Mn2O3), Mn(IV) oxide (MnO2),
pyrolusite (MnO2), hausmannite (Mn3O4), oxalate,
Mn-citrate, Mn-cystine, Mn-malate, and Mn-phytate, calibration tuned using the Mn reference) previously published inBlamey et al. (2018). The ATHENA software (Ravel and Newville, 2005) was used for interpolation and energy shifting on the external references. Further data processing consisted in the calculation of the second derivative over normalized spectra, using the Savitzky–Golay method. The second derivative was used to remove constant and linear components that could be introduced by possible discrepancy on normalization between data and references sets. Furthermore, a principal component analysis (PCA) was applied to the different datasets to compare the coordination of Mn for the two species and between different points of interest. By comparing the spectra obtained from foraminiferal calcite with spectra of references material, in
van Dijk et al. Chemical Heterogeneities in Foraminiferal Shells
FIGURE 5 | EPMA element distribution maps (Mg/Ca, S/Ca, Na/Ca, and Mn/Ca) for three species of benthic foraminifera, Ammonia sp. T6 (left panels), Bulimina marginata(center panels), and Amphistegina lessonii (right panels), from treatment Aq600 (Mn/CaSEAWATER=50.9 ± 0.8 mmol/mol). The top maps show information on chamber number (scale bar of 10 µm), and the asterisk indicates the outer side of the test. Maps are semiquantitative (see Electron Probe Microanalysis). EPMA, electron probe microanalysis.
particular the position of the edge and the white line peak (i.e., position of maximum absorption), we can investigate in which form Mn is present in the foraminiferal test.
RESULTS
Distribution of Mn, Mg, S, and Na by
Electron Probe Microanalysis
Examples of element to calcium maps per species are presented in
Figure 5. All three species show characteristic banding patterns
and peak intensities, depending on the element of interest. The most pronounced banding can be found in Mg/Ca and Mn/Ca maps, depending in the latter case of the seawater [Mn] of the culture experiment; that is, Mn banding is most visible for Aq100 and Aq600 and not in Aq10, owing to the limit of detection. Ammonia sp. shows thin bands of 1–2 µm of high E/Ca for Mg, S, Na, and Mn. Distributions of Mg, S, and Na follow the same pattern of thin bands in specimens of Bulimina marginata (1–3 µm) and Amphistegina lessonii (2–4 µm), but Mn/Ca distribution differs (Figure 5). For B. marginata, Mn/Ca
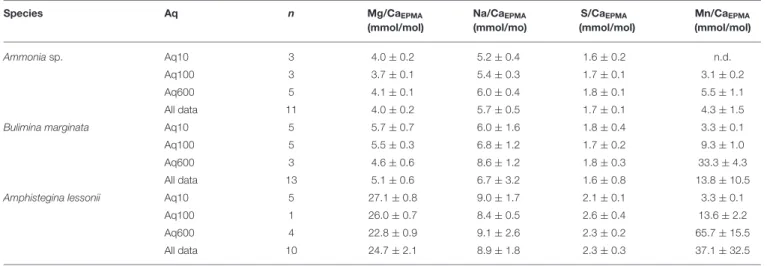
TABLE 2 | Average E/Ca (mmol/mol ± SD) per species per treatment of total distribution maps EPMA.
Species Aq n Mg/CaEPMA
(mmol/mol) Na/CaEPMA (mmol/mo) S/CaEPMA (mmol/mol) Mn/CaEPMA (mmol/mol) Ammoniasp. Aq10 3 4.0 ± 0.2 5.2 ± 0.4 1.6 ± 0.2 n.d. Aq100 3 3.7 ± 0.1 5.4 ± 0.3 1.7 ± 0.1 3.1 ± 0.2 Aq600 5 4.1 ± 0.1 6.0 ± 0.4 1.8 ± 0.1 5.5 ± 1.1 All data 11 4.0 ± 0.2 5.7 ± 0.5 1.7 ± 0.1 4.3 ± 1.5 Bulimina marginata Aq10 5 5.7 ± 0.7 6.0 ± 1.6 1.8 ± 0.4 3.3 ± 0.1
Aq100 5 5.5 ± 0.3 6.8 ± 1.2 1.7 ± 0.2 9.3 ± 1.0
Aq600 3 4.6 ± 0.6 8.6 ± 1.2 1.8 ± 0.3 33.3 ± 4.3
All data 13 5.1 ± 0.6 6.7 ± 3.2 1.6 ± 0.8 13.8 ± 10.5 Amphistegina lessonii Aq10 5 27.1 ± 0.8 9.0 ± 1.7 2.1 ± 0.1 3.3 ± 0.1
Aq100 1 26.0 ± 0.7 8.4 ± 0.5 2.6 ± 0.4 13.6 ± 2.2
Aq600 4 22.8 ± 0.9 9.1 ± 2.6 2.3 ± 0.2 65.7 ± 15.5
All data 10 24.7 ± 2.1 8.9 ± 1.8 2.3 ± 0.3 37.1 ± 32.5
Ammonia sp. T6, total n = 10; Bulimina marginata, total n = 13; Amphistegina lessonii, total n = 8. The high SD of Mn/CaEPMAis due to the different seawater [Mn] of the aquaria. Mn
counts were below detection limit. n.d., not detectable; EPMA, electron probe microanalysis.
is present as a thin highly concentrated band located close to the Mg band but is often heterogeneously distributed within the lamella. In contrast, for A. lessonii, Mn/Ca distribution is characterized by broad bands with either high or low Mn/Ca, corresponding to different lamella of the test wall.
We calculated average E/CaEPMA of all distribution
maps obtained by EPMA (for examples, see Figure 5 and
Supplementary Figures 1–3) per species per culture treatment (i.e., Aq10, Aq100, and Aq600) (Table 2). Mg/CaEPMA and
Na/CaEPMA are the lowest for Ammonia sp., 4.0 ± 0.2 and 5.7
±0.5 mmol/mol, respectively, and B. marginata, 5.1 ± 0.6 and 6.7 ± 3.2 mmol/mol, respectively, than are those of the larger benthic species A. lessonii, which has higher incorporation of Mg and Na, leading to Mg/CaEPMAand Na/CaEPMAof 24.7 ± 2.1 and
8.9 ± 1.8 mmol/mol, respectively. For these two element ratios, the differences between species are significant (p < 0.05), except for Na/Ca between Ammonia sp. and B. marginata. S/CaEPMA
is not significantly different for the small benthic species, 1.7 ± 0.1 and 1.6 ± 0.8 mmol/mol for Ammonia sp. and B. marginata, respectively, whereas A. lessonii has significantly (p < 0.05) higher values on average, 2.3 ± 0.3 mmol/mol. For a given [Mn] in seawater, Mn/CaEPMA increases from Ammonia sp. to B.
marginata to A. lessonii, showing the highest incorporation of Mn in the latter species.
Mg, Na, and S Distribution: Electron Probe Microanalysis Peak Analysis
We analyzed 11, 8, and 10 EPMA transect maps of six, six, and nine specimens of Ammonia sp., B. marginata, and A. lessonii, respectively. The patterns observed in the microdistribution of Mg, Na, and S were comparable between specimens of a given species. Because seawater chemistry of these elements is stable in the experiment, we combined the data from all culture treatments (Aq10, Aq100, and Aq600), unlike [Mn], and calculated the average E/CaEPMA, which is presented as average peak and base
values of the primary and secondary bands in Figure 6 and
Table 3. For Ammonia sp. (11 primary bands and five secondary bands) and A. lessonii (10 primary bands and two secondary bands), we acquired enough secondary bands to investigate sequential peak and base values. In most cases, peak and base (e.g., PI/BI and PII/BII) and primary and secondary peak (PI/PII) values are significantly different (p < 0.05; Table 4). This is most obvious for Mg/CaEPMA (Figure 6A). Primary base and
secondary base are, with the exception of Na/Ca in A. lessonii, always similar (p > 0.05; Table 4). Peaks are in general lower and less pronounced for the small benthic species, Ammonia sp. and B. marginata (peak factor of 1–2) compared with the large benthic species A. lessonii (peak factor of 1–4; Table 3).
When comparing the three species with each other, we observe that peak and base values of Mg/Ca (Figure 6A), Na/Ca (Figure 6B), and S/Ca (Figure 6C) are often significantly different (p < 0.05). When PI and BI are compared, Mg/Ca peaks (Figure 6A) are significantly different between all three species, whereas base values are different between the small benthic species (Ammonia sp. and B. marginata) compared with A. lessonii. For Na/Ca (Figure 6B), peak values are higher in A. lessonii compared with the small benthic species, whereas base values are significantly different between all three species. S/Ca peaks and bases (Figure 6C) are similar (p > 0.05) between Ammonia sp. and B. marginata but significantly different when comparing these species with A. lessonii.
Mn Distribution Patterns Obtained by Electron Probe Microanalysis
The distribution pattern of Mn/CaEPMA in the test
wall is different for each of the species investigated, as it can be seen in EPMA maps presented in
Figure 5, as well as the Supplementary Information
(Ammonia sp., Supplementary Figure 1; B. marginata,
Supplementary Figure 2; A. lessonii, Supplementary Figure 3). In species Ammonia sp., spatial distribution of Mn is linked to a Mg/Ca variation. In contrast, for the species B. marginata
van Dijk et al. Chemical Heterogeneities in Foraminiferal Shells
FIGURE 6 | EPMA average peak (E/CaMAX; yellow) and base (E/CaMIN; blue) values of primary peak and base (PI and BI) and secondary peak and base (PII and BII)
for the three species Ammonia sp. T6 (left panels), Bulimina marginata (middle panels), and Amphistegina lessonii (right panels) for Mg/CaEPMA(A), Na/CaEPMA(B),
and S/CaEPMA(C). Significant differences (p < 0.05) between peak and base values (e.g., PI and BI) are indicated with black brackets, and for these values, peak
factors ± SD (E/CaMAX/E/CaMIN) are given (see also Table 3). For calculation of peak and base values, see paragraph 2.3.1. The top shows a hypothetical transect
map with locations of PI, BI, PII, and BII, with the asterisk indicating the outer part of the test. Note that the scale of the y-axis is different for A. lessonii, except for Na/Ca. EPMA, electron probe microanalysis.
and A. lessonii, the Mn/CaEPMA distribution is not strongly
correlated or even sometimes anticorrelated to Mg/CaEPMA
(see, e.g., Supplementary Figure 2B for B. marginata and
Supplementary Figures 3A,C for A. lessonii). As explained in the Materials and Methods section, we, therefore, performed the
peak analysis again, focusing on Mn to obtain the minimum and maximum values per transect. For all three species, average peak and base values for Mn/Ca are presented in
Figure 7. Average Mn/CaEPMA increases from Aq10 to Aq600,
TABLE 3 | EPMA average values (see Table 2) and E/CaMAXand E/CaMIXvalues in mmol/mol for Ammonia sp. T6, Bulimina marginata, and Amphistegina lessonii with
peak factor (PF; significant values, p < 0.05, in bold, see Table 4).
E/Ca Species Avg
E/CaEPMA (mmol/mol) Peak I E/CaMAX (mmol/mol) Base I E/CaMIN (mmol/mol) PF I Peak II E/CaMAX (mmol/mol) Base II E/CaMIN (mmol/mol) PF II Mg/Ca Ammoniasp. 4.0 ± 0.2 4.9 ± 0.7 3.5 ± 0.2 1.4 ± 0.2 4.3 ± 0.2 3.5 ± 0.2 1.2 ± 0.1 Bulimina marginata 5.1 ± 0.6 6.4 ± 1.5 4.2 ± 0.9 1.6 ± 0.6 n.m. n.m. n.m. Amphistegina lessonii 24.7 ± 2.1 56.6 ± 10.2 20.2 ± 4.3 2.8 ± 0.4 37.8 ± 5.6 19.1 ± 0.3 2.0 ± 0.2 Na/Ca Ammoniasp. 5.7 ± 0.5 7.2 ± 1.7 4.6 ± 0.7 1.6 ± 0.4 5.9 ± 0.2 5.3 ± 0.6 1.1 ± 0.1 B. marginata 6.7 ± 3.2 7.8 ± 2.4 6.6 ± 1.4 1.2 ± 0.2 n.m. n.m. n.m. A. lessonii 8.9 ± 1.8 10.0 ± 2.8 8.3 ± 1.6 1.2 ± 0.2 12.5 ± 2.1 10.6 ± 0.3 1.2 ± 0.1 S/Ca Ammoniasp. 1.7 ± 0.1 2.1 ± 0.4 1.5 ± 0.1 1.5 ± 0.3 1.8 ± 0.1 1.6 ± 0.1 1.2 ± 0.1 B. marginata 1.6 ± 0.8 2.3 ± 0.3 1.5 ± 0.1 1.5 ± 0.3 n.m. n.m. n.m. A. lessonii 2.3 ± 0.3 6.9 ± 1.4 1.9 ± 0.2 3.6 ± 0.7 3.5 ± 0.4 1.9 ± 0.2 1.9 ± 0.1
Locations for E/CaMINand E/CaMAXare based on the peak and base location of Mg/Ca. Ammonia sp. n = 11 (I) and 5 (II), B. marginata n = 8 (I), and A. lessonii n = 10 (I) and 2 (II).
n.m., not measured; EPMA, electron probe microanalysis.
TABLE 4 | Two-tailed p-values of unpaired t-test of comparison of means of primary and secondary peak (PI and PII) and base (BI and BII) values of E/Ca acquired by EPMA.
Species Aq E/Ca PI/BI PII/BII PI/PII BI/BII
Ammoniasp. All Mg/Ca <0.0001 <0.0001 0.0091 0.9007
All S/Ca <0.0001 0.0009 0.0157 0.0997
All Na/Ca 0.002 0.0305 0.0168 0.0145
Aq100 Mn/Ca 0.0011 n.a. n.a. n.a.
Aq600 Mn/Ca 0.0062 n.a. n.a. n.a.
B. marginata All Mg/Ca 0.0023 n.a. n.a. n.a.
All S/Ca <0.0001 n.a. n.a. n.a.
All Na/Ca 0.2429 n.a. n.a. n.a.
Aq10 Mn/Ca 0.3118 n.a. n.a. n.a.
Aq100 Mn/Ca 0.0285 n.a. n.a. n.a.
Aq600 Mn/Ca 0.3716 n.a. n.a. n.a.
Aulimina lessonii All Mg/Ca <0.0001 <0.0001 <0.0001 0.4302
All S/Ca <0.0001 <0.0001 <0.0001 0.4657
All Na/Ca 0.1227 0.0013 0.0231 <0.0001
Aq10 Mn/Ca 0.0065 n.a. n.a. n.a.
Aq600 Mn/Ca 0.0788 n.a. n.a. n.a.
Bold values are significantly different (p < 0.05). Underlined values are conservatively significant after Bonferroni correction, pBonferroni< 0.00086 (pBonferroni< 0.05/n, with n = total number of t-test = 58). Note that for Bulimina marginata, no secondary peak and base are analyzed. EPMA, electron probe microanalysis.
seawater [Mn] (Table 2). The Mn/Ca values collected by EPMA (semiquantitative method) and LA-ICP-MS (quantitative method) by Barras et al. (2018) are given in Table 5 and are in agreement for the Aq600 (Ammonia sp. and B. marginata) and Aq100 (B. marginata), but the calibration of EPMA is not sufficient when Mn/Ca is below ∼2,500 ppm (value of Ammonia sp. in Aq100 and B. marginata in Aq10; Table 5).
For all species, we observe that with increasing seawater [Mn], Mn/CaEPMAfor both peak and base increases (Table 5; Figure 7).
Even though incorporation of Mn is species specific (Mn/CaEPMA
=Ammonia sp. < B. marginata < A. lessonii), peak intensity is very similar between species (∼1.5×).
Distribution of Mg, Mn, and Sr by
Nanoscale Secondary Ion Mass
Spectrometry
Examples of elemental maps and linescans obtained by nanoSIMS can be found in Figure 8 and
Supplementary Figure 4. We investigated the co-occurrence of peak positions of Sr/Ca and Mn/Ca with Mg/Ca (counts/counts) in the linescans (n = 5 for A. lessonii and n = 11 for B. marginata) from Aq10, based on the location of the Mg/Ca peaks. For Ammonia sp., we obtained too few linescans (n = 2) to quantify peak and base values. Results from statisticalcomparison
van Dijk et al. Chemical Heterogeneities in Foraminiferal Shells
FIGURE 7 | EPMA average peak (Mn/CaMAX; yellow) and base (Mn/CaMIN; blue) of Mn/Ca of Ammonia sp. T6 (left panel), Bulimina marginata (middle panel), and
Amphistegina lessonii(right panel) per treatment with peak factor (±SD). Significant differences (p < 0.05) between peak and/or base values (e.g., PI and BI) are indicated with brackets, and for these values, peak factors ± SD (E/CaMAX/E/CaMIN) are given (see also Table 3). EPMA, electron probe microanalysis.
TABLE 5 | Mn/Ca peak (Mn/CaMAX) and base (Mn/CaMIN) values for Ammonia sp. T6, Bulimina marginata, and Amphistegina lessonii with peak factor (PF; significant
values in bold, see Table 4) and average values obtained by EPMA analyses (see Table 2).
Species Aq n Avg Mn/CaLA Avg Mn/CaEPMA (mmol/mol) Peak I Mn/CaMAX Base I Mn/CaMIN PF (MAX/MIN) Ammoniasp. Aq100 3 0.86 ± 0.10 3.1 ± 0.2 3.8 ± 0.3 2.7 ± 0.2 1.4 ± 0.2 Aq600 5 4.74 ± 0.75 5.5 ± 1.1 8.0 ± 0.9 5.8 ± 0.4 1.4 ± 0.01 B. marginata Aq10 2 0.67 ± 0.07 3.3 ± 0.1 3.7 ± 0.3 3.4 ± 0.4 1.1 ± 0.3 Aq100 3 6.16 ± 0.62 9.3 ± 1.0 9.9 ± 1.5 6.3 ± 1.1 1.6 ± 0.4 Aq600 3 34.3 ± 3.94 33.3 ± 4.3 42.6 ± 9.0 35.8 ± 7.5 1.2 ± 0.01
A. lessonii Aq10 4 n.a. 3.3 ± 0.1 4.1 ± 0.5 3.0 ± 0.2 1.5 ± 0.2
Aq100 1 n.a. 13.6 ± 2.2 16.9 9.9 1.7
Aq600 4 n.a. 65.7 ± 15.5 78.3 ± 27.2 47.8 ± 9.2 1.6 ± 0.3
Average Mn/CaLA(mmol/mol ± SD) is fromBarras et al. (2018). n.a., not available; EPMA, electron probe microanalysis.
(p values) of averages of peaks and bases for B. marginata and A. lessonii can be found in Table 6 and Figure 9. In both species, the first Mg peak (PI), associated with the primary layer of calcite, is the most pronounced and significantly higher than the second peak (p < 0.0001 and 0.005, respectively, for B. marginata and A. lessonii; Table 6, Figure 9A). Based on visual observations, Sr/Ca seems to follow the pattern of Mg/Ca (Figure 8B for B. marginata and Figure 8D for A. lessonii). However, only for B. marginata did we observe that the first peak (PI) is significantly higher than the second peak (PII; Figure 9C), as observed for Mg/Ca. For A. lessonii, the difference between the Sr/Ca of PI and PII is not significantly different, maybe owing to the lower sample number (n = 5 vs. n = 11 for B. marginata). In contrast, Mn/Ca distribution is clearly different or offset from Mg/Ca, which is reflected by low normalized peak values with larger SD in both species (Figure 9B).
Manganese Speciation by Micro-X-Ray
Absorption Near-Edge Structure
The first observations of the combined spectra from the different locations, that is, internal coating (Figure 10C) and calcite
locations (Figure 10D) with reference spectra, suggests that Mn is systematically under a Mn(II) speciation. The results of the PCA performed on normalized (second derivative) spectra of all samples (in total 169 spectra) plus the set of references (measured during the ID21 synchrotron session and from other authors; Johnson et al., 2016; Blamey et al., 2018) are presented in Figure 10A. The first two axes of the PCA explain 77% of the variability of the data. The analysis highlights the clear difference in the chemical environment of Mn between the “internal coating” location and the measurements performed in the calcite itself (“high Mn calciteEXP,” “low Mn
calcitePRE,” and “high Mn calcitePRE”). The averaged spectra
for the different locations (all species and aquaria combined,
Figure 10B) show that the near-edge features are mainly characterized by two distinct peaks in the calcite, whereas only one large white line peak is observed for the “internal coating” zone. Regarding the calcite samples, the spectra are in general following the same trend, but the intensities of the near-edge peaks seem to be variable (Supplementary Figure 5B,
Supplementary Table 1), and the PCA suggests some small differences between the two species and between the two [Mn] conditions, for example, high Mn calcitePRE locations of
FIGURE 8 | Examples of distribution and transect profiles of elements acquired by nanoSIMS in tests of Bulimina marginata (A,B) and Amphistegina lessonii (C,D) from Aq10. The top panels show SEM overview picture of specimen and a close-up of area of interest with red rectangle of mapping area and arrow of transect analysis of B. marginata (A) and A. lessonii (C). Element distribution maps of Mg/Ca, Mn/Ca, and Sr/Ca are in cps/cps. The lower panels show the distribution profile of normalized Mg/Ca (solid black line), Mn/Ca (dashed green line), and Sr/Ca (dotted purple line) over the transect from the inside of the test toward the outer side of B. marginata(B) and A. lessonii (D). nanoSIMS, nanoscale secondary ion mass spectrometry; SEM, scanning electron microscope.
Bulimina (Aq100) and Ammonia (Aq100) in Figure 10A and
Supplementary Figure 5A.
Some references plot close to the different areas defined by the locations in the samples, that is, calcite samples (“high Mn calciteEXP,” “high Mn calcitePRE,” and “low Mn calcitePRE”)
and internal coating, meaning that their spectra show similar trends as the samples of these areas. In Figures 10C,D, the averaged spectra of the samples are presented with the associated references for each location. Internal coating spectra exhibit very similar patterns to several references such as MnSO4,
MnPO4 (Figure 10C), and Mn-organic compounds published
inBlamey et al. (2018), for example, Mn-oxalate, Mn-phytate, and Mn-cystine. The spectra for calcite locations show similar features as kutnohorite (CaMn(CO3)2) and manganoan calcite
((Ca,Mn)CO3) published in Johnson et al. (2016) with a
smaller pre-edge peak and two distinct peaks in the near-edge region of the spectra. However, the intensity and sharpness of the peaks are slightly different from the references and also between species and conditions. For example, the intensity of the white line peak of Bulimina-Aq600 is higher than that of
van Dijk et al. Chemical Heterogeneities in Foraminiferal Shells
TABLE 6 | Two-tailed p-values of unpaired t-test of comparison of means of primary and secondary peak (PI and PII) and base (BI and BII) values of E/Ca acquired by nanoSIMS.
Species E/Ca PI/BI PII/BII PI/PII BI/BII
Bulimina marginata
Mg/Ca >0.0001 >0.0001 >0.0001 0.9808 Mn/Ca 0.2180 0.8241 0.5553 0.5363 Sr/Ca >0.0001 >0.0001 0.0004 0.1170 Aulimina lessonii Mg/Ca >0.0001 >0.0001 0.0005 0.3097 Mn/Ca 0.9052 0.7254 0.9040 0.5258 Sr/Ca 0.0026 0.0004 0.7176 0.3352
Bold values are significantly different (p < 0.05). Underlined values are conservatively significant after Bonferroni correction, pBonferroni< 0.00086 (pBonferroni< 0.05/n, with n = total number of t-test = 58). nanoSIMS, nanoscale secondary ion mass spectrometry.
Ammonia-Aq100 (Supplementary Figure 5B), and the energy of white line peaks is different between conditions (Aq600 and Aq100) for each species (Supplementary Figure 5C). Although the calcite Mn/Ca ratio may partly influence the analyses, the normalization of the spectra should reduce this effect. Moreover, the potential bias due to self-adsorption effects, which could change according to different [Mn] in the sample, has been assessed and, in the concentrations of Mn considered here, would not be sufficient to explain the differences observed between the “high Mn calciteEXP” spectra from different species and aquaria
(see Supplementary Figure 5 for comparison of the “high Mn calciteEXP” spectra).
For the moment, it is difficult to explain the reason for this discrepancy. On the one hand, we could have variable contributions from an additional Mn phase to the XANES signal observed in calcite, and in this case, we could be missing an appropriate reference that would plot on the negative side of the PC1 axis where all the newly formed calcites are plotting. Considering that the depth resolution of the XRF analyses is ∼30 µm, we are analyzing a depth mixture of different parts of the test, which could include an additional Mn phase. For now, we can, however, suppose that the main signal measured in the calcite corresponds to MnCaCO3 phase. Considering
the references available in this study, we believe that a linear combination would not be reliable, and quantitative analyses would require the preparation and analysis of a wider set of references.
DISCUSSION
Intra-Test Variability of Mg, Na, S, and Sr
Distribution of Mg, Na, S, and Sr Follows Laminar Calcification ModelBy combining the EPMA and nanoSIMS data, we can summarize the spatial distribution of several elements in three species of foraminifera, that is, Ammonia sp. T6, Bulimina marginata (which has never been studied before in this context), and Amphistegina lessonii. All three species show high a variation of Mn, Mg, Na, S, and Sr in their test while being cultured in a controlled laboratory setup with stable conditions. Therefore, any
heterogeneity is not a function of fluctuation of environmental parameters nor due to migration of the foraminifera in the sediment or water column. To compare the intra-test variation of Mn with that of the other elements, we first need to discuss the banding observed for Mg, Na, S, and Sr. From EPMA and nanoSIMS measurements, we observe a correlation between the locations of high concentration bands of Mg, Na, S, and Sr. The number of high concentration bands, especially the Mg banding, which is the most pronounced, seems to be linked to the investigated position of the chamber, that is, only one high-band in the ultimate chamber and two high-bands in the penultimate chamber. The three species studied follow the laminar calcification model proposed for hyaline foraminifera (for example, see Erez, 2003; Sadekov et al., 2005). During a calcification event (i.e., creation of a new chamber), the chamber is composed of a primary layer of calcite and followed by a secondary layer of calcite that will cover the rest of the test or preexisting chambers (Reiss, 1958; Hemleben et al., 1977, 1986; Bé et al., 1979). The co-occurrence of number of calcite lamella and highly concentrated bands implies that element banding might be intrinsically linked to the laminar calcification in these foraminifera, as suggested before (Erez, 2003; Jonkers et al., 2016; van Dijk et al., 2017b; Geerken et al., 2018). The high concentration bands are located in the first part of each lamella, close to the primary organic sheet, where calcification commences. This is in line with previous studies on small and larger benthic foraminifera showing thin high concentration of these elements close to the location of the organic sheets (Erez, 2003; Paris et al., 2014; van Dijk et al., 2017b, 2019; Geerken et al., 2018, 2019).
The presence of organic material, like organic linings between calcite lamellae, could cause a higher Mg content owing to increased adsorption of Mg (Mavromatis et al., 2017). If that is also the case for other elements, for example, S and Na, this could be the reason behind the observed covariation of banding of Mg and other elements, as suggested earlier byKunioka et al. (2006)for planktic foraminifera. However, this is disputed by the work ofAmiel et al. (1973),Busenberg and Plummer (1985), andKitano et al. (1975), who show that sulfate and sodium are predominately in solid solution and not a component of the organic matrix of biogenic (Mg-)calcites. Also, the (small) spatial offset observed between the organic layers and the elemental band, as shown previously for Alobifera gibbosa (by EPMA;van Dijk et al., 2017b), Alobifera lobifera (by electron probe WDS;
Erez, 2003), and Orbulina universa (by nanoSIMS;Paris et al., 2014), suggests that the banding is not directly related to the organic matter content.
The location of concentrated bands might be explained by a small amount of seawater enclosed in the site of calcification (SOC;de Nooijer et al., 2014) or input of unmodified seawater through small openings in the organic sheet enveloping the SOC, which has been observed at the start of calcification (Nagai et al., 2018). When it was assumed that foraminiferal calcification occurs in a closed system, the Rayleigh fractionation, as proposed byElderfield et al. (1996), fails to explain the observed banding at the start of the lamellae. Indeed, higher E/Ca is expected to be observed when Ca is being utilized (Evans et al., 2018),
FIGURE 9 | Normalized average values of primary peak and base (PI and BI) and secondary peak and base (PII and BII) for the two species Bulimina marginata (left panels) and Amphistegina lessonii (right panels) from Aq10 for (A) Mg/Ca, (B) Sr/Ca, and (C) Mn/Ca derived from profiles obtained by nanoSIMS analysis (for example, see Figure 8). The top shows a hypothetical transect map with locations of PI, BI, PII, and BII, with the asterisk indicating the outer part of the test. Note that peak-base data are in counts/counts, unlike semiquantitative EPMA data presented in Figures 6, 7. nanoSIMS, nanoscale secondary ion mass spectrometry; EPMA, electron probe microanalysis.
which would lead to higher E/Ca on the external part of the lamella. Following the trans-membrane transport mixing model (Nehrke et al., 2013; Mewes et al., 2014), banding can be explained by import of Ca2+ in the SOC during calcification.
This would “dilute” the E/Ca at the SOC, leading to a lower
E/Ca in the rest of the lamellae. The reasons for differences in elements incorporation between species (Table 2, this study;
van Dijk et al., 2017a) are partially unknown but have been hypothesized to be caused by different contributions of processes involved in biomineralization responsible for element uptake
van Dijk et al. Chemical Heterogeneities in Foraminiferal Shells
FIGURE 10 | Summary of µXANES analyses. PCAs performed on all normalized (second derivative) spectra (both species, both aquaria, and all locations) and on reference spectra (A). Average spectra ± SD for the different locations (“high Mn calciteEXP,” “high Mn calcitePRE,” “low Mn calcitePRE,” and “internal coating”; B). The
average spectra ± SD of (C) “internal coating” and (D) calcite locations (i.e., “high Mn calciteEXP,” “high Mn calcitePRE,” and “low Mn calcitePRE” spectra combined),
plotted with spectra of the reference material. Please note that for panels (B–D), a shift has been applied on the y-axis to improve readability. µXANES, micro-X-ray absorption near-edge structure; PCA, principal component analysis.
(Mewes et al., 2014). For example, variable passive transport and Ca2+pumping efficiency could result in different element incorporation between species (Nehrke et al., 2013; Geerken et al., 2018) and might also explain our observed differences in peak intensity (Figure 6, Table 3). Banding is most intense for Mg, which is tightly biologically controlled (Zeebe and Sanyal, 2002; Bentov and Erez, 2006; de Nooijer et al., 2014). If changes in transport, uptake, or incorporation of Mg during chamber formation are responsible for Mg banding, the incorporation of Mg might lead to higher incorporation of other elements, like Na and Sr, owing to crystal lattice strain.
Differences in Banding Intensity of Mg, Na, and S Between Species
Although banding can be explained by the incorporation of elements that is, over time, diluted as a result of pumping of Ca2+in the SOC, the difference in the absolute values of E/Ca between the low Mg species Ammonia sp. and B. marginata and the intermediate Mg species A. lessonii (Table 2) might be explained by the abundance of seawater endocytosis, as suggested before to explain the chemical fingerprint of S and Mg in a wide range of foraminiferal species (van Dijk et al., 2019). Vacuoles of seawater have been observed in A. lessonii (e.g.,Bentov et al., 2009) but are so far not resolved in Ammonia sp. or B. marginata. In fact, according to the observations ofNehrke et al. (2013), they would play only a minor role in the calcification of Ammonia sp. The seawater in these vacuoles is altered by various pumps and possible channels, like Ca2+/H+and Na+/H+ channels, to
increase internal pH and [Ca] (Erez, 2003), and Mg/Ca of this calcification fluid is lowered to ∼2 mol/mol (Evans et al., 2018). Seawater vacuoles, high in Ca, represent still a considerable flux of Mg but are low in Na ions owing to the proposed pumps. The chemical signature of the vacuoles (low [Na], but still relatively high [Mg]) could explain why tests of A. lessonii have a 5× higher Mg/Ca than have tests of Ammonia sp. and B. marginata, whereas Na/Ca is only ∼1.5× higher. Another explanation is offered byGeerken et al. (2019), who hypothesized that Na and Sr banding is higher for A. lessonii compared with Ammonia sp. owing to crystal lattice strain, allowing for higher incorporation of alkali elements, like Sr, owing to lattice distortion (Mucci and Morse, 1983). Even though it is not certain if Na is affected by lattice strain, because this element is incorporated interstitially (Ishikawa and Ichikuni, 1984), it fits the observations byEvans et al. (2015), who showed that foraminiferal Na/Ca increases with Mg/Ca.
Species B. marginata has slightly higher average test Mg/Ca than has Ammonia sp. (Table 2), but both species have similar base values for Mg/Ca (Figure 6 and Mg, Na, and S Distribution: Electron Probe Microanalysis Peak Analysis section). These results suggest that the difference in total test Mg/Ca between these species is caused by the higher peak value. This higher E/Ca in the banding of B. marginata could be caused by either a larger volume of seawater enclosed at the SOC, as suggested byde Nooijer et al. (2014), or more passive transport of seawater at the start of calcification, when the protective envelop is not completely closed (Nagai et al., 2018). The first theory, not directly proven yet, could be revealed by analyzing
calcification fluid in the SOC by, for example, cryo-SEM, or cryo-nanoSIMS, which would allow for the measurement of fully hydrated samples. Furthermore, the evolution of the protective organic sheet enclosing the SOC has so far only been studied on Ammonia (Nagai et al., 2018) and will need to be studied for other species to investigate its link to intra-test variability in E/Ca. Interestingly, for Na/Ca, peak and base values increase from Ammonia sp. and B. marginata to A. lessonii (Figure 6B), suggesting that sodium content in these species is determined by both peak and base values, and not just the peak intensity, as suggested for Mg/Ca and S/Ca (van Dijk et al., 2019). As a monovalent ion, Na+, compared with Mg2+, would be
incorporated at the same time but perhaps differently to the crystal lattice.
Element Banding in Foraminiferal Calcite Due To Vital Effects: Synthesis
In Table 7, we show an overview of all data on element banding in foraminiferal tests currently available, including our observations. We included only studies investigating “internal” banding, in the primary and secondary layers of calcite, and we excluded studies focusing on crust formation (e.g., Eggins et al., 2003; Sadekov et al., 2009; Marr et al., 2013; Steinhardt et al., 2015) or studies that do not discuss mechanistic responsible for banding (Sadekov et al., 2010; Vetter et al., 2013). We conclude that all bandings reported in this table are due to vital effects, that is, due to processes active during chamber formation, like biomineralization processes. However, not one mechanism alone can explain all observations for both benthic and planktic species, suggesting that there might be a combination of factors causing and modulating banding of elements in foraminifera. For both planktic and benthic foraminifera, the hypothesis that Mg banding in the calcite would correspond to organic linings enrichments between calcite lamellae (Erez, 2003; Kunioka et al., 2006) does not allow to explain the co-occurrence of Na and S banding that is predominately in solid solution and not a component of the organic matrix in a range of biogenic calcites (Amiel et al., 1973; Kitano et al., 1975; Busenberg and Plummer, 1985). For foraminifera, the coordination of Mg and B is uniform across the banding of individual tests, rebutting a double-phase Mg incorporation (Branson et al., 2013, 2015). Furthermore, Ammonia sp. has a relatively thick organic lining than have other species (Ní Fhlaithearta et al., 2013), which would, hypothetically, lead to a more pronounced organic signal in the banding. However, this is in contrast to our results and other studies (Geerken et al., 2018, 2019; van Dijk et al., 2019), which all show that banding intensity is low for Ammonia sp. compared with other species, like Amphistegina. Lastly, most often, banding in tests from both benthic and planktonic species is found adjacent to and not directly on the organic linings (Hathorne et al., 2009; van Dijk et al., 2017b). On the basis of this combined evidence, we conclude that the banding observed in foraminiferal calcite is not likely to be caused by the presence of organic matter in the test wall.
For planktonic foraminifera with and without symbionts, day–night cycling is suggested to be responsible for the observed banding, whether by processes involved in biomineralization
van Dijk et al. Chemical Heterogeneities in Foraminiferal Shells
TABLE 7 | Overview of planktonic and benthic species with heterogeneous element distribution in the chamber wall, including proposed mechanisms responsible for banding.
Species Element Mechanisms responsible
PLANKTONIC SPECIES WITH SYMBIONTS
Orbulina universa Mg Symbiont-associated pH changes (Eggins et al., 2004; Sadekov et al., 2005) Changes in mitochondrial density/activity (Spero et al., 2015)
Processes involved in biomineralization (Sadekov et al., 2005)
Globigerinoides ruber Mg Biomineralization processes and/or algal symbionts activity (Sadekov et al., 2005; Fehrenbacher and Martin, 2014)
Pulleniatina obliquiloculata Mg, Sr Laminar calcification model/organic linings (Kunioka et al., 2006) PLANKTONIC SPECIES WITHOUT SYMBIONTS
Neogloboquadrina dutertrei Mg Biomineralization processes (Fehrenbacher et al., 2017)
Changes in calcification temperature due to migration (Sadekov et al., 2005) Neogloboquadrina incompta
Globorotalia menardii Globorotalia truncatulinoides
Mg Changes in calcification temperature due to migration (Sadekov et al., 2005)
Neogloboquadrina pachyderma Mg Chamber formation processes (Jonkers et al., 2016) Globorotalia inflata
Globorotalia scitula
Mg Not due to calcite precipitation rate, Rayleigh distillation of the calcifying reservoir, and organic linings (Hathorne et al., 2009)
BENTHIC SPECIES WITH SYMBIONTS
Alobifera lobifera Mg, S Laminar calcification model/organic linings (Erez, 2003)
Amphistegina lessonii Mg, Na, S, Sr Chamber addition/biomineralization processes; Ca-pumping (This study;Geerken et al., 2018)
Mn Symbiont activity; oxygenation of microenvironment (this study)
B Biomineralization processes: change in internal pH or ion transport (Branson et al., 2015)
BENTHIC SPECIES WITHOUT SYMBIONTS
Ammoniasp. Mg, Na, S, Sr Chamber addition/biomineralization processes; Ca-pumping (This study;Geerken et al., 2018, 2019; van Dijk et al., 2019)
Mn Chamber addition/biomineralization processes; Ca-pumping (this study) Bulimina marginata Mg, Na, S, Sr Chamber addition/biomineralization processes; Ca-pumping (this study)
Mn Variable Ca-pumping/passive transport, or chamber 3D structure, compared with Ammoniasp. (this study)
Uvigerina peregrine Mg Laminar calcification model (Glock et al., 2012)
Bolivina spissa Mg banding
absent
Chamber 3D structure: monolamellar calcification model (Glock et al., 2012)
(Fehrenbacher et al., 2017) or changes in the activity and density of mitochondria during chamber formation (Spero et al., 2015). Changes in pH of the microenvironment due to symbiont activity, proposed by Eggins et al. (2004) and Sadekov et al. (2005), might modulate the banding but cannot explain its occurrence, because Mg banding is also present in non-symbiont species (Fehrenbacher et al., 2017).
Benthic foraminifera, especially deep-sea species like B. marginata, should not be sensitive to day–night cycling, and banding is more likely to be the result of processes involved in chamber additions, like unmodified seawater at the SOC (de Nooijer et al., 2014) by, for example, openings in the organic sheet at the start of calcification (Nagai et al., 2018) and consequently “dilution” of E/Ca of the SOC owing to Ca-proton pumping (Nehrke et al., 2013; Toyofuku et al., 2017). It is likely that banding in benthic foraminifera is tightly coupled to chamber addition and the lamellar calcification model. The lack of Mg banding observed for Bolivina spissa is explained by Glock et al. (2012) with the fact that this species has a monolamellar
calcification structure (Sliter, 1974). However, even with a monolamellar species, one would still expect elemental banding in lamellae of older chambers. The lack of Mg banding observed for this species by Glock et al. (2012) might be due to other reasons, maybe related to, for example, calcification processes in B. spissa, or low intensity of the Mg and the sensitivity of the method used.