HAL Id: hal-02923899
https://hal.archives-ouvertes.fr/hal-02923899
Submitted on 28 Oct 2020
HAL is a multi-disciplinary open access
archive for the deposit and dissemination of
sci-entific research documents, whether they are
pub-lished or not. The documents may come from
teaching and research institutions in France or
abroad, or from public or private research centers.
L’archive ouverte pluridisciplinaire HAL, est
destinée au dépôt et à la diffusion de documents
scientifiques de niveau recherche, publiés ou non,
émanant des établissements d’enseignement et de
recherche français ou étrangers, des laboratoires
publics ou privés.
Positive feedback between future climate change and the
carbon cycle
Pierre Friedlingstein, Laurent Bopp, Philippe Ciais, Jean-Louis Dufresne,
Laurent Fairhead, Hervé Letreut, Patrick Monfray, James Orr
To cite this version:
Pierre Friedlingstein, Laurent Bopp, Philippe Ciais, Jean-Louis Dufresne, Laurent Fairhead, et al..
Positive feedback between future climate change and the carbon cycle. Geophysical Research Letters,
American Geophysical Union, 2001, 28 (8), pp.1543-1546. �10.1029/2000GL012015�. �hal-02923899�
GEOPHYSICAL RESEARCH LETTERS, VOL. 28, NO. 8, PAGES 1543-1546, APRIL 15,2001
Positive feedback between future climate change
and the carbon cycle
Pierre Friedlingstein, Laurent Bopp, Philippe Ciais,
IPSL/LSCE, CE-Saclay, 91191, Gif sur Yvette, France
Jean-Louis Dufresne, Laurent Fairhead, Herv LeTreut,
IPSL/LMD, Universit6 Paris 6, 75252, Paris, France
Patrick Monfray, and James Orr
IPSL/LSCE, CE-Saclay, 91191, Gif sur Yvette, France
Abstract. Future climate change due to increased atmo- spheric CO2 may affect land and ocean efficiency to absorb atmospheric CO2. Here, using climate and carbon three- dimensional models forced by a 1% per year increase in at- mospheric CO•, we show that there is a positive feedback between the climate system and the carbon cycle. Climate
change
reduces
land and ocean uptake of CO•, respectively
by 54% and 35% at 4 x CO• . This negative impact im-
plies that for prescribed anthropogenic COy. emissions, the atmospheric CO• would be higher than the level reached if climate change does not affect the carbon cycle. We esti- mate the gain of this climate-carbon cycle feedback to be 10% at 2 x CO2 and 20% at 4 x CO• . This translates into a 15% higher mean temperature increase.
Introduction
Atmospheric
CO• is expected
to increase
in the coming
decades
due to emissions
of CO• by fossil fuel burning and
land use changes. The rate of increase depends on anthro- pogenic emissions and on the capacity of the oceans and the
land biosphere
to take up COy. [$chimet
et at., 1995]. Cur-
rent climate models predict a mean temperature increase
of i to 4.5øC compared
to the present
for a doubling
of
atmospheric
CO• [Kattenberg
et at., 1996]. Recent carbon
cycle studies suggest that such climate change may reduce
the uptake of CO2 by the ocean [Maier-Reimer et at., 1996;
$armiento
et al., 1998; Matear and Hirst, 1999] or the land
biosphere
ICao and Woodward,
1998; Meyer et at., 1999;
Cramer et al., 2000]. It is thus necessary
to account for
the climate impact on the carbon cycle when translating
anthropogenic emissions into CO• concentrations. Method
In this study, we used a model structure composed of a coupled ocean-atmosphere general circulation model
(OAGCM), and models of land and ocean components
of
the carbon cycle, the carbon cycle models being forced by
the climate fields of the OAGCM. Two climate simulations have been run with the OAGCM: the control run where the
CO• is held constant at 350 ppmv and the transient climate run where the CO2 increases at a rate of 1% per year from
350 ppmv up to 1400 ppmv (Figure la). We then performed
Copyright 2001 by the American Geophysical Union. Paper number 2000GL012015.
0094-8276/01/2000GL012015505.00
two carbon simulations. In the "constant climate" simula-
tion the carbon models are forced by a CO2 increase of 1% per year and the control climate from the OAGCM. In the "climate change" simulation, the carbon models are forced
by the same 1%/yr CO2 increase
as well as the climate from
the transient climate run.
In this experiment, atmospheric
CO2 and monthly aver-
aged
climate
fields
from the IPSL OAGCM [Braconnot
et at.,
2000] are used to drive both terrestrial and oceanic
carbon
cycle models. These two models allow one to translate an- thropogenic CO2 emissions into atmospheric CO2 concen- tration trajectories and vice-versa. The terrestrial carbon
model (SLAVE) [Friedtingstein
et at., 1995; Ciais et at.,
1999] is driven by surface air temperature, precipitation,
and solar radiation, and calculates net primary productiv-
ity (NPP) following
a light use
efficiency
formulation
[Field
et al., 1995] that is a function of temperature and water
stress. NPP increases with CO• under a Michaelis-Menten
beta factor formulation
[Gifford, 1992], which has a global
value
of 0.5, in the upper
range
of experimental
data [DeLu-
cia et al., 1999], although, nitrogen limitation and deposi-
tion as well as vegetation
dynamics and land use changes
are ignored
in this study. The ocean carbon model (IPSL-
OCCM1) [Aumont
et al., 1999;
Le Qudrd
et al., 1999],
based
on the HAMOCC3 biogeochemical
scheme
[Maier-Reimer,
1993] is driven by monthly mean global fields of oceanic
cir-
culation, temperature, salinity, and surface fields of winds,
sea ice and water fluxes all issued from the OAGCM. Both
land and ocean
carbon
models
have been applied
successfully
to study seasonal, interannual and decadal characteristics
of the carbon
cycle
over the historical
period [Friedlingstein
et al., 1995; Ciais et al., 1999; Aumont et al., 1999; Le Qudr•
et al., 1999].
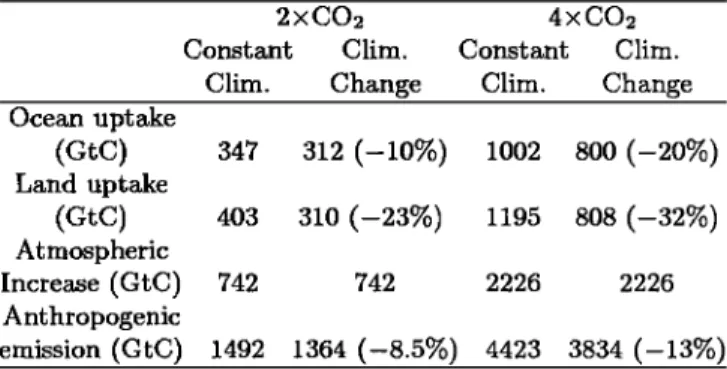
Table 1. Changes in cumulated carbon budget at 2xCO2 and 4xCO2
2xCO• 4xCO•.
Constant Clim. Constant Clim. Clim. Change Clim. Change Ocean uptake
(GtC)
347
312 (-10%)
1002 800 (-20%)
Land uptake(arC)
403
310 (-23%)
1195 808 (-32%)
AtmosphericIncrease
(GtC)
742
742
2226
2226
Anthropogenicemission
(GtC) 1492 1364 (-8.5%) 4423 3834 (-13%)
15431544 FRIEDLINGSTEIN ET AL.' CLIMATE-CARBON CYCLE FEEDBACK 2=C• ... 4xCO t . o , , , 4, t2. -20. 0 4O 8O t20 t60 20O Time
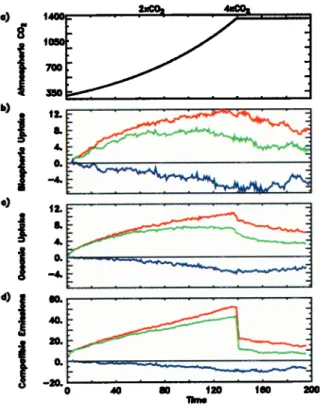
Figure 1. Carbon budget. a) Atmospheric CO2 scenario used as a forcing for the climate model (in ppmv) (12). b) Simulated annual biospheric CO2 uptake (GtC/yr) for the constant climate simulation (red line), the climate change simulation (green line)
and the difference between the two simulations, showing the cli-
mate change impact on reduction biospheric carbon uptake (blue line). c) same as b), but for the ocean. d) Annual rate of com-
patible anthropogenic 002 emissions calculated as the sum of atmospheric 002 growth rate and land plus ocean carbon up-
takes (GtO/yr). Lines colors follows the same convention as in b).
Climate Impact on Land Uptake
In the constant climate experiment, increasing CO2 stim-
ulates terrestrial NPP from 70 to 110 GtC/yr at 2 x CO2 ,
and to 150 GtC/yr at 4 x CO2 . These results
fall within the
range of previous
model ICao and Woodward,
1998; Meyer
et al., 1999; Cramer et al., 2000]. The residence
time of
carbon in living and dead biomass induces a transient dis- equilibrium between NPP and the release due to oxidation
of decaying
material. A net biospheric
uptake (NEP) grows
as long as atmospheric
CO2 increases,
reaching
9 GtC/yr at
2 x CO2 and 12 GtC/yr at 4 x CO2 (Figure lb). When CO2
stabilizes, so does the NPP, and the biosphere reaches a new equilibrium state. The climate change experiment, shows a
much smaller NEP than the constant climate run (Figure
lb). Ten years before reaching 2 x CO2 , NEP saturates
at around 7 GtC/yr, and starts to decrease
after 120 years
despite increasing atmospheric CO2. When CO2 reaches
4 x CO2 , NEP only amounts
to 5.5 GtC/yr, less than half
of the value found at the same CO2 level in the constant
climate run. The cumulative land uptake in the climate change run is 310 GtC at 2 x CO2 and 808 GtC at 4 x CO2 , that is respectively 23% and 32% lower than in the constant
climate simulation (Table 1).
The strong reduction of NEP induced by the climate change is mainly located in the subtropics (especially South
America) and caused by increase in soil aridity, due to a larger increase in evaporative demand than in precipitation
(Figure 2). Qualitatively similar findings
were found previ-
ously ICao and Woodward,
1998; Cramer et al., 2000].
Climate Impact on Ocean Uptake
For the constant climate run, rising atmospheric CO2 also increases the oceanic uptake. At 2 x CO2 , the ocean carbon
sink reaches
7.5 GtC/yr and 10.5 GtC/yr at 4 x CO2 (Fig-
ure lc). After CO2 stabilizes, the ocean uptake decreases as the ocean carbon tends toward a new equilibrium state. As for the land uptake, the oceanic uptake is always lower in the climate change simulation than under constant climate.
After 80 years, oceanic
uptake saturates around 7 GtC/yr,
and shows a slight decrease during the last ten years of in- creasing atmospheric CO2. At 4 x CO2 , the oceanic uptakes
amounts
to 5.7 GtC/yr, which is 35% lower than in the con-
stant climate run. When cumulated, the climate induced decrease of oceanic uptake is 10% at 2 x CO2 , and 20% at
4 x CO2 (Table 1). The effect of the global warming scenario
in reducing oceanic CO2 uptake is, at 2 x CO2 of the same or-
der as that was previously
found [Maier-Reimer et al., 1996;
Sarmiento et al., 1998; Matear and Hirst, 1999]. As shown
on Figure 3, the reduction in the oceanic uptake of carbon, as discussed in earlier studies, results from the combination of three effects: impact of increased sea-surface temperature on CO2 solubility, impact of reduced vertical mixing on CO2 transport from the surface to the deep ocean and impact of changes in the biogeochemical cycle of CO2. The combi- nation of those three climatic feedbacks lead to a reduced oceanic uptake of CO2, principally located at high latitudes, and for its main part in the Southern Ocean. However, this effect might be over-evaluated in our experiments due to ab- normally strong oceanic convection in the Southern Ocean.
-SilO.
•1•0.
' I'"
I • "1
' I,•j•
-t00.
-150. i ,, ß •-
Figure 2. Zonal mean difference between the climate change and the constant climate simulations at the time of 4x CO2 of a) annual surface land temperature (øC) (red line) and precipitation (mm/yr) (blue line), b) soil water content (ram), c) Net Primary Productivity (gC/m 2/yr), and d) net carbon uptake (gC/m 2/yr).
FRIEDLINGSTEIN ET AL.' CLIMATE-CARBON CYCLE FEEDBACK 1545
O,
I-- . I . I . I I.. I . I . I . I . I . --I I ' I ' I ' I ' I ' I ' I '
ß I , I ß I I
Figure 3. Zonal mean difference between the climate change and the constant climate simulations at the time of 4xCO2 of a) sea surface temperature (øG), b) depth of the mixed layer (m), c) export production (gG/m2/yr), and d) net carbon uptake (gC/m2/yr).
In the following, we provide the first estimate of the mag- nitude of this positive feedback. Using a classical approach
[Hansen
et al., 1984], we define the gain of the climate sys-
tem carbon cycle feedback, g, as O*T/OC x •*C/OT where the first term represents the overall physical sensitivity of temperature to atmospheric CO2, and the second term rep- resents the overall sensitivity of atmospheric CO2 to tem- perature. In our climate change simulation, the sensitiv- ity of temperature to COa gradually decreases from 0.007
K/ppmv at 2 x COa to 0.003 K/ppmv at 4 x COa (Figure
4a). The COa sensitivity to temperature can be inferred
from Figure 1, showing the impact of climate change on the carbon fluxes, and from the calculated airborne fraction. The CO2 sensitivity to temperature increases strongly from
20 ppmv/K at 2 x COa to 60 ppmv/K at 4 x COa (Figure
4b). The gain, g, defined
above, amounts
to 0.11 at 2 x COa
and reaches
0.19 at 4 x COa (Figure 4c). The net feed-
back, f, which is the global warming amplification, defined
as 1/(1 -g), reaches
1.12 and 1.23 at 2 x CO2 and 4 x COa
respectively
(Figure 4d). Assuming
that future emissions
follow a trajectory compatible with today's climate (Fig-
ure ld, constant
climate simulation), one can approximate
the COa levels and the climate change that would occur in a coupled climate-carbon cycle configuration. This analyt- ical calculation gives a 5.2øC warming at a COa level of 1560 ppmv after 140 years instead of a 4.6øC warming at 1400 ppmv, as given by the uncoupled simulation.
Impact on Derived Emissions
Our two estimates of both terrestrial and oceanic car- bon uptakes allow us to determine the compatible anthro- pogenic emissions with and without accounting for the cli- mate change. In the constant climate simulation, in order
to sustain a 1%/yr increase
in atmospheric
COa, the com-
patible emissions have to peak at 50 GtC/yr at the time of
4 x CO2 , whereas
they would be lowered
by 10 GtC/yr in
the climate change
run (Figure l d). When cumulated,
the
compatible emissions are respectively reduced by 8% and 13% at 2 x CO2 and 4 x CO2 when climate change is ac-
counted
for (Table 1). Thus, to achieve
a given atmospheric
CO2 trajectory any economic COa emission scenario needs to prescribe lower emissions if the climate impact on the carbon cycle is accounted for. Furthermore, the response of the carbon cycle to the warming being non-linear, reduc- tions in emissions will then have to be increasingly stronger with time.
Climate System-
Carbon Cycle
Feedback
In a more consistent study where the carbon cycle is forced by anthropogenic emissions, as in the real world, our results would translate into a faster atmospheric CO2 buildup as land and ocean efficiencies to sequester carbon decrease with time. That in turn would feed back in a more rapid climate change and may have further adverse impacts on terrestrial and oceanic processes and on the CO2 concen-
tration. .) d)
•'f I I I ,
701I I I I ; I I I
t.t
I
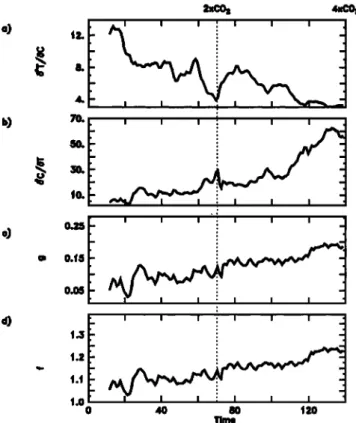
t.0 0 4O 8O t20Figure 4. Time evolution of a) c9*T/c9C', the overall sensitivity of surface temperature to the atmospheric GOa (10 3 K/ppmv), b) c9*C'/c9T, the overall sensitivity of atmospheric GOa to sur- face temperature (ppmv/K), c) g, the gain of the climate system- carbon cycle feedback calculated as g = c9*T/c9C' x c9' C/OT, and d) f, the global warming amplification calculated as f = 1/(l-g).
1546 FRIEDLINGSTEIN ET AL.: CLIMATE-CARBON CYCLE FEEDBACK Conclusions
Our results suggest that the future climate change impact on the carbon cycle can be large, with a risk of seeing both ocean and biospheric capacity to absorb anthropogenic CO2 significantly reduced as the Earth warms up, leaving larger CO2 fraction in the atmosphere and therefore enhancing the climate change. In order to further explore these effects, it should be given high priority to develop comprehensive models where physical climate system and carbon cycle are explicitly coupled.
This study is a first attempt to quantify the climate- carbon feedback under elevated CO•.. To help reduce uncer- tainties, and to identify the key processes controlling CO2 and climate requires a better understanding of the observed historical trends. In future scenarios, one should also specif- ically account for changes in non-CO2 greenhouse gases, in future land use and land cover, in vegetation-climate feed- backs controlled by stomatal conductance and canopy devel- opment, as well as for alterations in land and ocean ecosys- tem distribution, and in the cycling of nutrients. In addition,
non-linear
changes
in the ocean-atmosphere
dynamics
[Man-
abe et al., 1992], could affect the magnitude
of the feedback
we have calculated here.
Acknowledgments. We thank O. Aumont, J. Jouzel
and K. Rodgers for useful comments on the manuscript. J.-Y. Grandpeix developed the formalism used for our feedback anal-
ysis. The computer time was provided by IDRIS/CNRS. This
work was part of the IPSL modelling pole, and is supported by
PNEDC and PROOF.
References
Aumont, O., J. C. Orr, P. Monfray, G. Madec, and E. Maier- Reimer, Nutrient trapping in the equatorial pacific: The ocean circulation solution, Global Biogeochemical Cycles, 13, 351- 371, 1999.
Braconnot, P., O. Marti, S. Joussaume, and Y. Leclainche, Ocean feedback in response to 6 kyr bp insolation., Journal of Cli-
mate, 13(9), 1537- 1553, 2000.
Cao, M. and F. I. Woodward, Dynamic responses of terrestrial ecosystem carbon cycling to global climate change, Nature, 393, 249-252, 1998.
Ciais, P., P. Friedlingstein, D. S. Schimel, and P. P. Tans, A global
calculation of the soil carbon 513C value: Implications for the
biospheric uptake of anthropogenic CO2, Global Biogeochemi- cal Cycles, 13, 519-530, 1999.
Cramer, W., A. Bondeau, F. Woodward, I. Prentice, R. Betts, V. Brovkin, P. Cox, V. Fisher, J. Foley, A. Friend, C. Kucharik, M. Lomas, N. Ramankutty, S. Sitch, B. Smith, A. White, and C. Young-Molling, Global response of terrestrial ecosys- tem structure and function to co2 and climate change: results œrom six dynamic global vegetation models, Global Change Bi-
ology, 2000.
DeLucia, E., J. Hamilton, S. Naidu, R. Thomas, J. Andrews, A. Finzi, M. Lavine, R. Matamala, J. Mohan, G. Hendrey, and W. Schlesinger, Net primary production of a forest ecosystem with experimental CO2 enrichment, Science, 284, 1177-1179,
1999.
Field, C. B., J. T. Randerson, and C. M. MalmstrSm, Global net primary production: Combining ecology and remote sensing, Remote Sensing of Environment, 51, 74-88, 1995.
Friedlingstein, P., I. Y. Fung, E. A. Holland, J. G. John, G. P. Brasseur, D. J. Erickson, and D. S. Schimel, On the contri- bution of the biospheric CO2 fertilization to the missing sink, Global Biogeochemical Cycles, 9, 541-556, 1995.
Gifford, R. M., Interaction of carbon dioxide with growth-limiting environmental factors in vegetation productivity: Implications for the global carbon cycle, Advances in Bioclimatology, 1, 24- 58, 1992.
Hansen, J., A. Lacis, D. Rind, G. Russel, P. Stone, I. Fung, R. Ruedy, and J. Lerner, Climate sensitivity: Analysis of feed- back mechanisms, in Climate Processes and Climate Sensi- tivity, Geophysical Monograph 29, edited by J. Hansen and T. Takahashi, pp. pp. 130-163, American Geophysical Union, Washington, D.C., 1984.
Kattenberg, A., F. Giorgi, H. Grassl, G. A. Meehl, J. F. B. Mitchell, R. J. Stouffer, T. Tokioka, A. J. Weaver, and T. M. L. Wigley, Climate Change 95, The Science of Climate Change, chapter 6. Climate Models - Projections of Future Climate, pp. 285-357, Intergovernmental Panel on Climate Chang, Cam- bridge, England, 1996.
Le Qu6r6, C., J. C. Orr, P. Monfray, O. Aumont, and G. Madec, Interannual variability of the oceanic sink of CO2 from 1979 through 1997, Global Biogeochemical Cycles, in press, 1999. Maier-Reimer, E., Geochemical cycles in an ocean general circu-
lation model. Preindustrial tracer distributions, Global Biogeo- chemical Cycles, 7, 645-677, 1993.
Maier-Reimer, E., U. Mikolajewicz, and A. Winguth, Future ocean uptake of CO2: interaction between ocean circulation and biology, Climate Dynamics, 1œ, 711-721, 1996.
Manabe, S., R. J. Stouffer, M. J. Spelman, and K. Bryan, Tran- sient response of a coupled ocean-atmosphere model to gradual changes of atmospheric CO2. Part II: Annual mean response, Journal of Climate, •, 785-818, 1992.
Matear, R. and A. Hirst, Climate change feedback on the future oceanic CO2 uptake, Tellus, 51B, 722-733, 1999.
Meyer, R., F. Joos, G. Esser, M. Heimann, G. Hooss, G. Kohlmaier, W. Sauf, R. Voss, and U. Wittenberg, The sub- stitution of high-resolution terrestrial biosphere models and carbon sequestration in response to changing CO2 and climate, Global Biogeochemical Cycles, 13, 785-802, 1999.
Sarmiento, J. L., T. M. C. Hughes, R. J. Stouffer, and S. Manabe, Simulated response of the ocean carbon cycle to anthropogenic climate warming, Nature, 393, 245-249, 1998.
Schimel, D., I. Enting, M. Helmann, T. Wigley, D. I•ynaud, D. Alves, and U. Siegenthaler, CO2 and the carbon cycle, in Climate Change 199•, Radiative Forcing of Climate Change and Evaluation of the IPCC IS9œ Emission Scenarios, edited by J. T. Houghton, L. G. Meira Filho, J. Bruce, Hoesung Lee, B. A. Callander, E. Haites, N. Harris, and K. Maskell, Cam- bridge University Press, New York, 1995.
P. Friedlingstein, L. Bopp, P. Ciais, P. Monfray, and J. Orr,
IPSL/LSCE, CE-Saclay, 91191, Gif sur Yvette, France. (eraall:
[email protected]. cea. fr; [email protected]. cea.fr; ciais@cea. fr;
monfray@cea. fr; orr@cea. fr)
J.-L. Dufresne, L. Fairhead, and H. LeTreut, IPSL/LMD, Uni- versit6 Paris 6, 75252, Paris, France. (eraall: Jean-Louis. Dufresne
@lmd.jussieu.fr; [email protected]; Herve. Letreut
@lmd.jussieu.fr)