HAL Id: hal-00328233
https://hal.archives-ouvertes.fr/hal-00328233
Submitted on 18 Sep 2007HAL is a multi-disciplinary open access
archive for the deposit and dissemination of sci-entific research documents, whether they are pub-lished or not. The documents may come from teaching and research institutions in France or abroad, or from public or private research centers.
L’archive ouverte pluridisciplinaire HAL, est destinée au dépôt et à la diffusion de documents scientifiques de niveau recherche, publiés ou non, émanant des établissements d’enseignement et de recherche français ou étrangers, des laboratoires publics ou privés.
Retrieval of global upper tropospheric and stratospheric
formaldehyde (H2CO) distributions from high-resolution
MIPAS-Envisat spectra
T. Steck, N. Glatthor, T. von Clarmann, H. Fischer, J. M. Flaud, B. Funke,
U. Grabowski, M. Höpfner, S. Kellmann, A. Linden, et al.
To cite this version:
T. Steck, N. Glatthor, T. von Clarmann, H. Fischer, J. M. Flaud, et al.. Retrieval of global upper tro-pospheric and stratospheric formaldehyde (H2CO) distributions from high-resolution MIPAS-Envisat spectra. Atmospheric Chemistry and Physics Discussions, European Geosciences Union, 2007, 7 (5), pp.13627-13652. �hal-00328233�
ACPD
7, 13627–13652, 2007 MIPAS-Envisat formaldehyde retrieval T. Steck et al. Title Page Abstract Introduction Conclusions References Tables Figures ◭ ◮ ◭ ◮ Back Close Full Screen / EscPrinter-friendly Version Interactive Discussion Atmos. Chem. Phys. Discuss., 7, 13627–13652, 2007
www.atmos-chem-phys-discuss.net/7/13627/2007/ © Author(s) 2007. This work is licensed
under a Creative Commons License.
Atmospheric Chemistry and Physics Discussions
Retrieval of global upper tropospheric
and stratospheric formaldehyde (H
2
CO)
distributions from high-resolution
MIPAS-Envisat spectra
T. Steck1, N. Glatthor1, T. von Clarmann1, H. Fischer1, J. M. Flaud2, B. Funke3, U. Grabowski1, M. H ¨opfner1, S. Kellmann1, A. Linden1, A. Perrin2, and
G. P. Stiller1
1
Institut f ¨ur Meteorologie und Klimaforschung, Forschungszentrum Karlsruhe, Germany
2
Laboratoire Interuniversitaire des Systemes Atmospheriques (LISA), Paris, France
3
Instituto de Astrof´ısica de Andaluc´ıa, Granada, Spain
Received: 2 August 2007 – Accepted: 10 September 2007 – Published: 18 September 2007 Correspondence to: T. Steck ([email protected])
ACPD
7, 13627–13652, 2007 MIPAS-Envisat formaldehyde retrieval T. Steck et al. Title Page Abstract Introduction Conclusions References Tables Figures ◭ ◮ ◭ ◮ Back Close Full Screen / EscPrinter-friendly Version Interactive Discussion
EGU
Abstract
The Fourier transform spectrometer MIPAS (Michelson Interferometer for Passive At-mospheric Sounding) on Envisat measures infrared emission of the Earth’s atmo-sphere in a limb viewing mode. High spectral resolution measurements of MIPAS are sensitive to formaldehyde from the upper troposphere to the stratopause.
Formalde-5
hyde single profile retrieval is formally possible, however with a large noise error (more than 60%), which is the dominant error source. The number of degrees of freedom for single profile retrieval ranges from 2 to 4.5 depending on latitude and number of cloud-free tangent altitudes. Calculation of zonal mean values for 30 days of data during 8 September 2003 and 1 December 2003 reduces the noise induced error by a factor
10
of 20 or more. In the upper tropical troposphere zonal mean values of about 70 parts per trillion by volume (pptv) were found, which have been attributed to biomass burning emissions. In the stratosphere, formaldehyde values are determined by photochemi-cal reactions. In the upper tropiphotochemi-cal stratosphere, formaldehyde zonal mean maximum values can reach 130 pptv. Diurnal variations in this region can be up to 50 pptv.
Com-15
parisons with other satellite instruments show generally good agreement in the region of upper troposphere and lower stratosphere as well as in the upper stratosphere.
1 Introduction
1.1 Formaldehyde sources, sinks and measurements
Formaldehyde (H2CO) is a principal intermediate in the oxidation of hydrocarbons in
20
the troposphere (Chance et al.,2000). The main sources of H2CO in the troposphere are biomass burning, anthropogenic, and biogenic emissions as well as methane ox-idation. It is destroyed via photolysis and reaction with OH. In continental boundary layers, non-methane hydrocarbons (NMHCs) emitted by biogenic and anthropogenic sources usually dominate over methane as a source of H2CO (Munger et al.,1995).
ACPD
7, 13627–13652, 2007 MIPAS-Envisat formaldehyde retrieval T. Steck et al. Title Page Abstract Introduction Conclusions References Tables Figures ◭ ◮ ◭ ◮ Back Close Full Screen / EscPrinter-friendly Version Interactive Discussion In the stratosphere, the H2CO profile results from an equilibrium between production
by methane oxidation and destruction as described above (Brasseur and Solomon, 1986), which means that a diurnal variation in formaldehyde abundances is expected in the stratosphere where production and destruction processes are dominated by pho-tochemistry.
5
First stratospheric measurements of formaldehyde have been made with a ground-based Fourier Transform infrared (FTIR) instrument (Barbe et al.,1979). Global distri-butions of H2CO columns have been derived with the GOME (Global Ozone Monitoring
Experiment) instrument (Burrows et al., 1999;Chance et al., 2000) which are domi-nated by the tropospheric signal. Vertically resolved satellite measurements of H2CO
10
have been made recently with the sub-millimeter radiometer (SMR) aboard the Odin satellite (Ricaud et al.,2007), with an altitude region of about 35 to 50 km, and with the Atmospheric Chemistry Experiment - Fourier Transform Spectrometer (ACE-FTS) (Co-heur et al.,2007) with focus on the upper tropospheric and lower stratospheric (UTLS) region. In the following we show that MIPAS has the potential to provide day and night
15
profile information of formaldehyde from the upper troposphere to the stratopause on a global scale.
1.2 MIPAS-Envisat description
The Michelson Interferometer for Passive Atmospheric Sounding (MIPAS) is a Fourier transform infrared (FTIR) spectrometer measuring the emission of the Earth’s
atmo-20
sphere in limb-viewing mode (Fischer and Oelhaf, 1996; Fischer et al., 2007). MI-PAS was launched on the environmental satellite Envisat on 1 March 2002 into a sun-synchronous polar orbit with equatorial crossing times of 10:00 (descending node) and 22:00 local mean time (ascending node). MIPAS operated in its nominal mode from July 2002 to March 2004 in high spectral resolution of nominal 0.025 cm−1. Flight
alti-25
tude of Envisat is 800 km and one orbit takes about 100 min allowing to measure 72 limb sequences per orbit with a sampling of about 550 km along track. With these charac-teristics, MIPAS is able to provide vertical profiles of temperature and a large number of
ACPD
7, 13627–13652, 2007 MIPAS-Envisat formaldehyde retrieval T. Steck et al. Title Page Abstract Introduction Conclusions References Tables Figures ◭ ◮ ◭ ◮ Back Close Full Screen / EscPrinter-friendly Version Interactive Discussion
EGU trace gases globally during day and night. The nominal observation mode comprises
17 tangent altitudes per limb sequence from 6 to 68 km (3 km step-width between 6 and 42 km, and at 47, 52, 60, and 68 km). The 3 km step-width was chosen due to the ver-tical instantaneous field-of-view (FOV) of MIPAS, which is about 3 km, while the across track FOV is about 30 km. The generation of calibrated radiance spectra, the so-called
5
level 1B data, is performed by the European Space Agency (ESA) (Nett et al.,2002). ESA additionally provides vertical profiles of temperature and 6 key species (H2O, O3,
HNO3, CH4, N2O, and NO2), the so-called Level 2 product. Furthermore, there are sev-eral institutes which have developed retrieval codes to determine trace gases beyond the ESA key species. The formaldehyde distributions described in this paper were
de-10
rived with the retrieval processor of the Institut f ¨ur Meteorologie und Klimaforschung (IMK) and the Instituto de Astrofisica de Andalucia (IAA) (von Clarmann et al.,2003).
2 Formaldehyde spectral signatures
In the mid-infrared spectral region, formaldehyde shows weak emission lines between about 900 and 1850 cm−1 (Fig. 1) with the most prominent band centered around
15
1750 cm−1. Due to the lowest instrumental noise level there, this region is used in
the retrieval based on new spectroscopic data (Perrin et al.,2003;Sharpe et al.,2004) which are thought to be more accurate and contain more spectral lines compared to previous data. The challenge of the H2CO retrieval is the very weak signal of the
emis-sion lines compared to the instrumental noise which is in the order of 3 nW/(cm2 sr
20
cm−1) at the relevant spectral region.
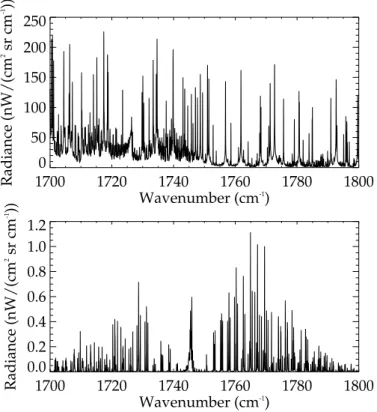
Figure 2(top) shows the simulated formaldehyde spectrum at 16.4 km tangent alti-tude for tropical atmospheric conditions. The spectrum is dominated by water vapor lines and minor ozone and nitric acid signatures. The H2CO contribution is shown in Fig.2 (bottom) which is given by the residual spectrum. The residual spectrum is
25
the difference between the spectra at 16.4 km with and without formaldehyde consid-ered in the simulation. For these conditions the formaldehyde contribution is below the
ACPD
7, 13627–13652, 2007 MIPAS-Envisat formaldehyde retrieval T. Steck et al. Title Page Abstract Introduction Conclusions References Tables Figures ◭ ◮ ◭ ◮ Back Close Full Screen / EscPrinter-friendly Version Interactive Discussion instrumental noise of about 3 nW/(cm2sr cm−1).
3 Retrieval setup
For the retrieval, 9 narrow spectral regions (microwindows) have been selected by vi-sual inspection between 1700 cm−1 and 1750 cm−1, which is the upper end of MIPAS
channel C (see Table1). The main criterion for the selection was high sensitivity to
5
formaldehyde and low interference by other gases. Since the formaldehyde contribu-tion is so small, the contribucontribu-tion of other gases still needs to be considered even after careful microwindow selection. Many gases need to be retrieved jointly in order to limit propagation of related errors in particular in the UTLS region. These interfering gases are: H2O, O3, HNO3, ClONO2, and PAN.
10
The retrieval procedure follows a scheme similar to that described by Rodgers (2000):
xi+1 = xi + (KTiS−1
y Ki + R)−1× [KTiS−1y (y − F (xi)) − R(xi − xa)], (1)
where x is the retrieval vector, K the partial derivatives of the spectra with respect to the retrieval vector (Jacobian), Sythe covariance matrix due to measurement noise, R
15
the regularization or constraint matrix, y the measurement vector, F the forward model,
xathe a priori profile, and i the iteration index.
The retrieval is performed on a fine vertical grid with 1 km distance up to 44 km and 2 km above. Since the retrieval grid is finer than the tangent altitude spacing, the retrieval is stabilized by a first order Tikhonov smoothing constraint (Tikhonov,1963):
20
R = αLT1L1, (2)
where α is the strength of the constraint and L1 the first order derivative matrix (as
discussed by Steck, 2002), which smoothes the solution without biasing it towards the a priori profile. The regularization strength α is determined by finding a trade-off
ACPD
7, 13627–13652, 2007 MIPAS-Envisat formaldehyde retrieval T. Steck et al. Title Page Abstract Introduction Conclusions References Tables Figures ◭ ◮ ◭ ◮ Back Close Full Screen / EscPrinter-friendly Version Interactive Discussion
EGU between the number of degrees of freedom, which is given by the trace of the averaging
kernel A (Rodgers,2000)
A = (KTiS−1
y Ki + R)−1KTiS−1y Ki (3)
and the noise induced error (Steck,2002)
Sn= (KTiS−1y Ki+ R)−1KTi S −1 y Ki(KTiS −1 y Ki + R)−1, (4) 5
where Sn is the error covariance matrix due to instrumental noise. A regularization strength α of 104was found optimum.
As initial guess, the profile from the U.S. standard atmosphere 1976 is used. As a priori profile we use a zero profile to avoid any artificial structures in the formalde-hyde profile not caused by the measurements. Thus, the linear retrieval equation
10
(Rodgers,2000) ˆ
x= Axt+ (I − A)xa, (5)
where ˆx is the estimated and xt is the true H2CO profile, simplifies for xa = 0 to
ˆ
x = Axt. This means that in linear approximation the retrieved H2CO profile is a smoothed version of the true profile.
15
All settings (microwindows, constraint, initial guess and a priori profiles) are chosen time and latitude-independent. This is again to ensure that all structures visible in the retrieved distributions originate from the measurements and are not artifacts due to any constraint.
4 Single profile retrieval and diagnostics
20
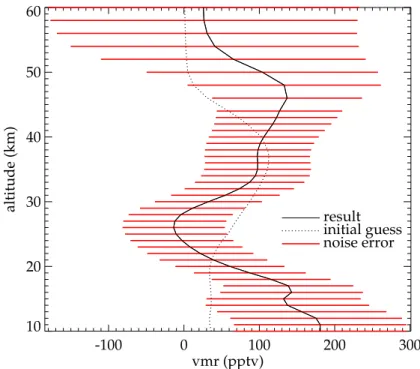
The retrieval procedure described above has been applied to real MIPAS measure-ments. Figure 3 shows an example for single profile retrieval of formaldehyde for MIPAS-Envisat orbit 8194 on 24 September 2003, at 14◦S/46◦W, which is right over
ACPD
7, 13627–13652, 2007 MIPAS-Envisat formaldehyde retrieval T. Steck et al. Title Page Abstract Introduction Conclusions References Tables Figures ◭ ◮ ◭ ◮ Back Close Full Screen / EscPrinter-friendly Version Interactive Discussion by volume (pptv) and near the stratopause of 140 pptv, which are both of reasonable
size. However, the profile shows some oscillations and the retrieval error caused by measurement noise is rather large with values of about 70 pptv leading to percentage errors larger than 100% except for the altitude regions with maximum formaldehyde (about 60%).
5
A detailed error analysis is given in Fig.4. Due to the small formaldehyde signatures and large instrumental noise, as discussed in Sect. 2, the measurement noise induced error (Fig.4, solid blue) is the dominating error source with values between 70 and 115 pptv in the altitude region from 10 to 47 km. The error due to spectral shift (Fig.4, solid red) exceeds 10 pptv at 40 km altitude and further increases with altitude. The
10
systematic errors are dominated by errors due to uncertainties in spectroscopic data (Fig.4, dashed blue) with maximum values of 24 pptv around 40 km altitude and 33 pptv at 10 km altitude. The altitude dependence of the error due to spectroscopic data is linked to the actual H2CO profile shape and is nearly constant with altitude when expressed in percentage (about 20%). For single profile retrieval, however, this error
15
becomes negligible compared to the noise error. Further errors due to gain calibration, instrumental line shape (ILS) and line-of-sight (LOS) uncertainties are mainly below 10 pptv for the complete altitude range.
The formaldehyde averaging kernel A (Fig. 5) shows sensitivity to the true profile from the UTLS region up to the stratopause. The dotted horizontal lines in Fig.5delimit
20
the altitude region of every single degree of freedom with a total number of 3.9, which is given by the trace of A. The averaging kernels show that MIPAS is also sensitive to the UTLS region with about one piece of information. The vertical resolution is estimated at about 11 km. The averaging kernel also shows that there is basically no information in the retrieval above 60 km and below 10 km, although for this geolocation
25
the lowest tangent altitude is at 7.9 km. This means that the atmosphere becomes optically opaque.
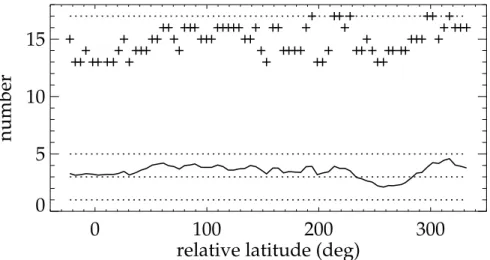
Figure6(solid line) shows the variation of the number of degrees of freedom along the complete orbit 8194. The number of independent pieces of information varies
ACPD
7, 13627–13652, 2007 MIPAS-Envisat formaldehyde retrieval T. Steck et al. Title Page Abstract Introduction Conclusions References Tables Figures ◭ ◮ ◭ ◮ Back Close Full Screen / EscPrinter-friendly Version Interactive Discussion
EGU between 2 and 4.5 depending on latitude and number of cloud-free tangent altitudes
(crosses). Near the southern winter pole (Fig.6, about 270◦), the number of tangent
altitudes not affected by clouds is reduced to 13 due to polar stratospheric clouds. Together with the low temperatures in this region and the resulting low signal, the number of degrees of freedom has a minimum and is close to 2. The mean number of
5
degrees of freedom for this orbit is about 3.5.
5 Global MIPAS formaldehyde data
The error analysis of the single profile retrieval has shown large random errors which are dominating the error budget. To reduce this error component and to receive more reliable data, averaging over a larger ensemble of data is the obvious way to go.
Be-10
tween 8 September 2003 and 1 December 2003, 30 days of data have been analyzed which cover about 420 orbits or more than 29 000 geolocations.
5.1 Zonal means
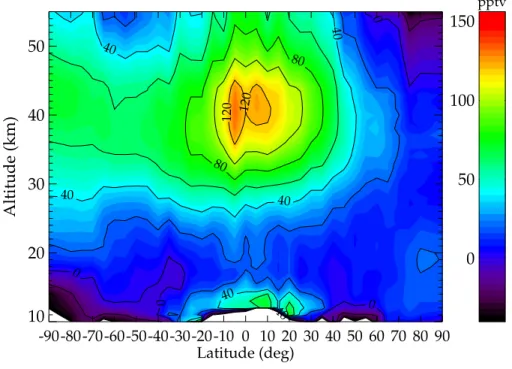
Zonal mean formaldehyde data is shown in Fig. 7. Averages have been taken for latitude bins of 5◦leading to about 500 to 1000 profiles per bin. This means a reduction
15
of the random error by a factor of about 20 to 30. For the averaging only altitudes are used which are within the cloud-masked tangent altitude range and where the corresponding diagonal value of the averaging kernel is above a given threshold (0.03). In the upper tropical tropopause region, mean values exceed 60 pptv. These larger values are attributed mainly to biomass burning emission. MIPAS has detected
en-20
hanced values also in other gases like PAN (Glatthor et al., 2007), C2H6, and ozone (von Clarmann et al.,2007) which are attributed to biomass burning events. Due to the very weak emission lines, MIPAS can measure enhanced formaldehyde mainly in the tropical troposphere, where lower tropospheric air is transported to higher altitudes.
In the upper stratosphere a prominent maximum is visible at around 40 km altitude
ACPD
7, 13627–13652, 2007 MIPAS-Envisat formaldehyde retrieval T. Steck et al. Title Page Abstract Introduction Conclusions References Tables Figures ◭ ◮ ◭ ◮ Back Close Full Screen / EscPrinter-friendly Version Interactive Discussion with values of about 130 pptv in the tropics. The stratospheric values in the southern
hemisphere are smaller than in the tropics but much larger compared to the northern hemisphere. This is likely connected with the southern polar vortex and its breakup. In the northern winter upper stratosphere low temperatures cause an extremely low signal, which makes the formaldehyde retrieval even more difficult and prone to
er-5
ror propagation. These degraded retrievals are characterized by unrealistic negative mixing ratios.
5.2 Diurnal variations
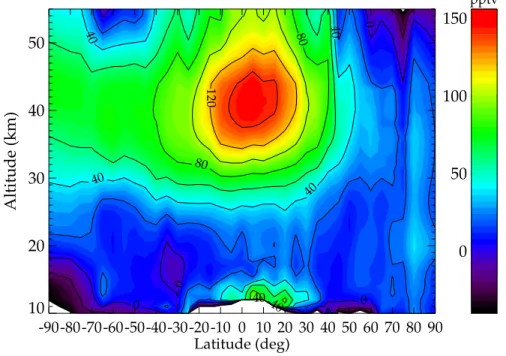
Since MIPAS is measuring the atmospheric emission, the zonal mean data (Fig. 7) can be divided into day- and nighttime measurements. Daytime measurements (Fig.8)
10
show enhancements in the stratosphere with maximum values of more than 150 pptv. For nighttime measurements (Fig.9), formaldehyde stratospheric maximum values are reduced to values below 100 pptv. Since there are slightly more daytime than nighttime measurements available, the combination of all measurements gives a maximum of 130 pptv which is slightly shifted towards daytime results. In the southern polar
night-15
time lower stratosphere, the values are larger than for daytime which is likely connected to the special chemistry in the polar vortex.
While photochemistry plays the dominating role particularly in the upper strato-sphere, in the upper troposphere also transport is important to understand the formaldehyde mixing ratios and may outweigh the diurnal variations there.
20
6 Comparison with other satellite instruments
6.1 Comparison with ACE-FTS
ACE-FTS is operating in the infrared between 750 and 4400 cm−1 at a spectral
ACPD
7, 13627–13652, 2007 MIPAS-Envisat formaldehyde retrieval T. Steck et al. Title Page Abstract Introduction Conclusions References Tables Figures ◭ ◮ ◭ ◮ Back Close Full Screen / EscPrinter-friendly Version Interactive Discussion
EGU measuring a maximum of 15 sunrises and 15 sunsets a day. The altitude range spans
from the upper troposphere to the mesosphere at an average vertical resolution of 4 km.
Table 2 shows the comparison between ACE-FTS and MIPAS measurements be-tween 12 and 20 km. The ACE-FTS values are measured in a biomass burning plume
5
on 8 October 2005 (Coheur et al., 2007), while MIPAS values are zonal averages for 10◦N between 8 September 2003 and 1 December 2003. The 10◦N bin for MIPAS
was chosen to match, at least partly, the high ACE-FTS tropical values measured in a biomass burning plume. The general agreement between ACE-FTS and MIPAS is good with values between 15 and 31 pptv for an altitude range of 16 to 20 km. At
10
12 km altitude both instruments show enhanced values at a similar magnitude (71 and 92 pptv). Due to the poor vertical resolution of MIPAS formaldehyde profiles, the large upper tropospheric values are smeared over a wide altitude range.
6.2 Comparison with Odin-SMR
Odin-SMR is a limb-viewing instrument aboard the Odin satellite launched on 20
Febru-15
ary 2001 into a 600 km sun-synchronous orbit (Murtagh et al., 2002). The formalde-hyde analysis is based on a weak rotational transition line at 576.7083150 GHz (Ricaud et al.,2007). The signal-to-noise ratio is increased by averaging about 1000 spectra within vertical layers of 2 km width leading to profile retrieval in the upper stratosphere. For the comparison, the period from 19 to 20 September 2005 was taken. The values
20
in Table3 are averaged values within three latitude bands: 90◦S–45◦S, 30◦S–30◦N,
and 45◦N–90◦N. For comparison, MIPAS zonal mean values are also averaged for the
latitude bands given above but for the previously mentioned period in 2003. Addition-ally to the measured values, Table 3 also contain values from the three-dimensional chemical-transport model Reprobus (Lef `evre et al.,1994;Ricaud et al., 2007) which
25
are monthly averages.
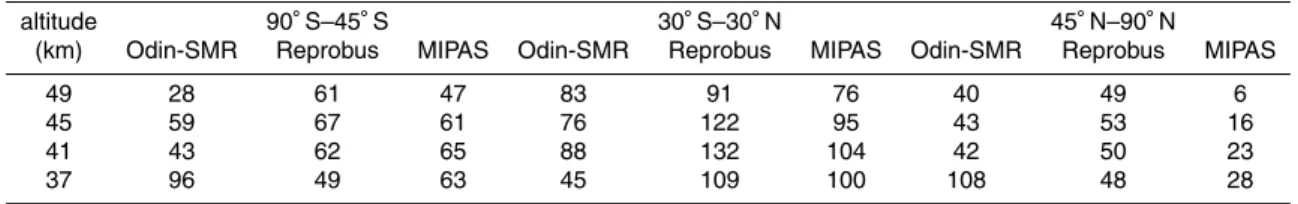
For southern hemispheric latitude region, MIPAS and Reprobus values agree quite well (Table3, left columns) with values between 47 and 67 pptv between 37 and 49 km
ACPD
7, 13627–13652, 2007 MIPAS-Envisat formaldehyde retrieval T. Steck et al. Title Page Abstract Introduction Conclusions References Tables Figures ◭ ◮ ◭ ◮ Back Close Full Screen / EscPrinter-friendly Version Interactive Discussion altitude. In the northern hemisphere (Table 3, right columns), large differences are
observed. This apparent disagreement is attributed to seasonal variation; contrary to Odin and Reprobus data, the MIPAS average, which spans from 8 September to 1 De-cember includes polar winter data which push the seasonal mean towards much lower values (Fig. 7). For tropical conditions (Table 3, middle columns), where the
strato-5
spheric maximum is mostly pronounced, MIPAS values are again in good agreement with both Odin-SMR and Reprobus.
7 Summary and conclusions
We have demonstrated that high spectral resolution measurements of MIPAS on En-visat are sensitive to formaldehyde. These emission lines are weak compared to the
10
instrumental noise, nevertheless vertical distributions from the upper troposphere to the stratopause have been derived on basis of most recent spectroscopic data. Formalde-hyde single profile retrieval is formally possible, however with a large noise error (more than 60%), which is the dominant error source. The number of degrees of freedom for single profile retrieval ranges from 2 to 4.5 depending on latitude and number of
15
cloud-free tangent altitudes.
For the period from 8 September 2003 to 1 December 2003, 30 days of data have been analyzed which cover 420 orbits or more than 29 thousand geolocations. To re-duce the large noise error component, profiles have been averaged leading to a reduc-tion by a factor of 20 or more. In the upper tropical troposphere, enhanced
formalde-20
hyde values of about 70 pptv were measured which have been attributed to biomass burning emission. In the stratosphere, formaldehyde production and destruction is dominated by photochemical reactions. Zonal mean profiles show a prominent maxi-mum in the upper tropical stratosphere with values up to 130 pptv, which are decreasing towards the poles. Zonal mean values in the upper tropical stratosphere show
differ-25
ences between day and night of up to 50 pptv.
ACPD
7, 13627–13652, 2007 MIPAS-Envisat formaldehyde retrieval T. Steck et al. Title Page Abstract Introduction Conclusions References Tables Figures ◭ ◮ ◭ ◮ Back Close Full Screen / EscPrinter-friendly Version Interactive Discussion
EGU agreement. High formaldehyde values in the tropical UTLS region are confirmed by
ACE-FTS and in the upper stratosphere by Odin-SMR.
Acknowledgements. We thank ESA for providing the MIPAS spectra (Level-1B data). The
sim-ulations were performed on the national super computer HP XC6000 at the High Performance Computing Center Stuttgart (HLRS) under the project MIPAS.
5
References
Barbe, A., March ´e, P., Secroun, C., and Jouve, P.: Measurements of Tropospheric and Strato-spheric H2CO by an Infrared High Resolution Technique, Geophys. Res. Lett., 6, 463–465, 1979. 13629
Bernath, P. F., McElroy, C. T., Abrams, M. C., Boone, C. D., Butler, M., Camy-Peyret, C., Carleer,
10
M., Clerbaux, C., Coheur, P.-F., Colin, R., DeCola, P., DeMazi `ere, M., Drummond, J. R., Dufour, D., Evans, W. F. J., Fast, H., Fussen, D., Gilbert, K., Jennings, D. E., Llewellyn, E. J., Lowe, R. P., Mahieu, E., McConnell, J. C., McHugh, M., McLeod, S. D., Michaud, R., Midwinter, C., Nassar, R., Nichitiu, F., Nowlan, C., Rinsland, C. P., Rochon, Y. J., Rowlands, N., Semeniuk, K., Simon, P., Skelton, R., Sloan, J. J., Soucy, M.-A., Strong, K., Tremblay,
15
P., Turnbull, D., Walker, K. A., Walkty, I., Wardle, D. A., Wehrle, V., Zander, R., and Zou, J.: Atmospheric Chemistry Experiment (ACE): Mission overview, Geophys. Res. Lett., 32, L15S01, doi:10.1029/2005GL022386, 2005. 13635
Brasseur, G. and Solomon, S.: Aeronomy of the Middle Atmosphere, Atmospheric Science Library, D. Reidel Publishing Company, Dordrecht, Holland, second edn., 1986.13629
20
Burrows, J. P., Weber, M., Buchwitz, M., Rozanov, V., Ladst ¨atter-Weißenmayer, A., Richter, A., de Beek, R., Hoogen, R., Bramstedt, K., Eichmann, K.-U., Eisinger, M., and Perner, D.: The Global Ozone Monitoring Experiment (GOME): Mission Concept and first scientific results, J. Atmos. Sci., 56, 151–175, 1999.13629
Chance, K., Palmer, P. I., Spurr, R. J. D., Martin, R. V., Kurosu, T. P., and Jacob, D. J.: Satellite
25
observations of formaldehyde over North America from GOME, Geophys. Res. Lett., 27, 3461–3464, 2000. 13628,13629
Coheur, P.-F., Herbin, H., Clerbaux, C., Hurtmans, D., Wespes, C., Carleer, M., Turquety, S., Rinsland, C. P., Remedios, J., Hauglustaine, D., Boone, C. D., and Bernath, P. F.: ACE-FTS observation of a young biomass burning plume: first reported measurements of C2H4,
ACPD
7, 13627–13652, 2007 MIPAS-Envisat formaldehyde retrieval T. Steck et al. Title Page Abstract Introduction Conclusions References Tables Figures ◭ ◮ ◭ ◮ Back Close Full Screen / EscPrinter-friendly Version Interactive Discussion
C3H6O, H2CO and PAN by infrared occultation from space, Atmos. Chem. Phys. Discuss., 7, 7907–7932, 2007,http://www.atmos-chem-phys-discuss.net/7/7907/2007/. 13629,13636
Fischer, H. and Oelhaf, H.: Remote sensing of vertical profiles of atmospheric trace con-stituents with MIPAS limb-emission spectrometers, Appl. Opt., 35, 2787–2796, 1996. 13629
Fischer, H., Birk, M., Blom, C., Carli, B., Carlotti, M., von Clarmann, T., Delbouille, L., Dudhia,
5
A., Ehhalt, D., Endemann, M., Flaud, J. M., Gessner, R., Kleinert, A., Koopmann, R., Langen, J., L ´opez-Puertas, M., Mosner, P., Nett, H., Oelhaf, H., Perron, G., Remedios, J., Ridolfi, M., Stiller, G., and Zander, R.: MIPAS: an instrument for atmospheric and climate research, Atmos. Chem. Phys. Discuss., 7, 8795–8893, 2007,
http://www.atmos-chem-phys-discuss.net/7/8795/2007/. 13629
10
Glatthor, N., von Clarmann, T., Fischer, H., Funke, B., Grabowski, U., H ¨opfner, M., Kellmann, S., Linden, A., Milz, M., Steck, T., and Stiller, G. P.: Global peroxyacetyl nitrate (PAN) retrieval in the upper troposphere from limb emission spectra of the Michelson Interferometer for Passive Atmospheric Sounding MIPAS, Atmos. Chem. Phys., 7, 2775–2787, 2007,
http://www.atmos-chem-phys.net/7/2775/2007/. 13634
15
Lef `evre, F., Brasseur, G. P., Folkins, I., Smith, A. K., and Simon, P.: Chemistry of the 1991–1992 stratospheric winter: Three-dimensional model simulations, J. Geophys. Res., 99, 8183– 8195, 1994. 13636
Munger, J. W., Jacob, D., Daube, B., Horowitz, L., Keene, W., and Heikes, B.: Formaldehyde, glyoxal, and methylglyoxal at a rural mountain site in central Virginia, J. Geophys. Res., 100,
20
9325–9334, 1995. 13628
Murtagh, D., Frisk, U., Merino, F., Ridal, M., Jonsson, A., Stegman, J., Witt, G., Eriksson, P., Jim ´enez, C., Megie, G., de la N ¨oe, J., Ricaud, P., Baron, P., Pardo, J. R., Hauchcorne, A., Llewellyn, E. J., Degenstein, D. A., Gattinger, R. L., Lloyd, N. D., Evans, W. F. J., Mc-Dade, I. C., Haley, C. S., Sioris, C., von Savigny, C., Solheim, B. H., McConnell, J. C.,
25
Strong, K., Richardson, E. H., Leppelmeier, G. W., Kyr ¨ol ¨a, E., Auvinen, H., and Oikari-nen, L.: An overview of the Odin atmospheric mission, Can. J. Phys., 80, 309–319, doi: 10.1139/P01-157, 2002. 13636
Nett, H., Perron, G., Sanchez, M., Burgess, A., and Mossner, P.: MIPAS inflight calibration and processor validation, in: ENVISAT Calibration Review - Proc. of the European Workshop, 9–
30
13 September 2002, ESTEC, Noordwijk, The Netherlands, CD-ROM, vol. SP-520, edited by Sawaya-Lacoste, H., ESA Publications Division, ESTEC, P. O. Box 299, 2200 AG Noordwijk, The Netherlands, 2002. 13630
ACPD
7, 13627–13652, 2007 MIPAS-Envisat formaldehyde retrieval T. Steck et al. Title Page Abstract Introduction Conclusions References Tables Figures ◭ ◮ ◭ ◮ Back Close Full Screen / EscPrinter-friendly Version Interactive Discussion
EGU
Perrin, A., Keller, F., and Flaud, J.-M.: New analysis of the ν2, ν3, ν4and ν6bands of formalde-hyde H122 C16O, Line positions and intensities in the 5–10 µm spectral region, J. Mol. Spec-trosc., 221, 192–198, 2003. 13630,13644
Ricaud, P., Alexandre, D., Barret, B., Flochmo ¨en, E. L., Motte, E., Berthet, G., Lef `evre, F., and Murtagh, D.: Measurements of mid-stratospheric formaldehyde from the Odin/SMR
instru-5
ment, J. Quant. Spectroscop. Radiat. Transfer, 107, 91–104, 2007.13629,13636
Rodgers, C. D.: Inverse Methods for Atmospheric Sounding: Theory and Practice, vol. 2 of Series on Atmospheric, in: Oceanic and Planetary Physics, edited by: F. W. Taylor, World Scientific, 2000. 13631,13632
Sharpe, S. W., Johnson, T. J., Sams, R. L., Chu, P. M., Rhoderick, G. C., and Johnson, P. A.:
10
Gas-phase databases for quantitative infrared spectroscopy, Appl. Spectrosc., 58, 1452– 1461, 2004. 13630
Steck, T.: Methods for determining regularization for atmospheric retrieval problems, Appl. Opt., 41, 1788–1797, 2002. 13631,13632
Tikhonov, A.: On the solution of incorrectly stated problems and method of regularization, Dokl.
15
Akad. Nauk. SSSR, 151, 501–504, 1963.13631
von Clarmann, T., Glatthor, N., Grabowski, U., H ¨opfner, M., Kellmann, S., Kiefer, M., Linden, A., Mengistu Tsidu, G., Milz, M., Steck, T., Stiller, G. P., Wang, D. Y., Fischer, H., Funke, B., Gil-L ´opez, S., and L ´opez-Puertas, M.: Retrieval of temperature and tangent altitude pointing from limb emission spectra recorded from space by the Michelson Interferometer for Passive
20
Atmospheric Sounding (MIPAS), J. Geophys. Res., 108, 4736, doi:10.1029/2003JD003602, 2003. 13630
von Clarmann, T., Glatthor, N., Stiller, G. P., Grabowski, U., H ¨opfner, M., Kellmann, S., Linden, A., Milz, M., Steck, T., Fischer, H., Funke, B., and Koukouli, M. E.: MIPAS measurements of upper troposheric C2H6and O3 during the Southern hemispheric biomass burning season
25
ACPD
7, 13627–13652, 2007 MIPAS-Envisat formaldehyde retrieval T. Steck et al. Title Page Abstract Introduction Conclusions References Tables Figures ◭ ◮ ◭ ◮ Back Close Full Screen / EscPrinter-friendly Version Interactive Discussion Table 1. Microwindows for MIPAS formaldehyde retrievals.
MW begin (cm−1) end (cm−1) 1 1701.3 1702.9 2 1708.7 1710.0 3 1720.2 1722.0 4 1722.8 1723.1 5 1727.8 1729.5 6 1730.6 1731.8 7 1735.7 1736.7 8 1738.2 1739.1 9 1744.7 1746.7
ACPD
7, 13627–13652, 2007 MIPAS-Envisat formaldehyde retrieval T. Steck et al. Title Page Abstract Introduction Conclusions References Tables Figures ◭ ◮ ◭ ◮ Back Close Full Screen / EscPrinter-friendly Version Interactive Discussion
EGU Table 2. Comparison with ACE-FTS measurements. (1) ACE-FTS values are measured in a
biomass burning plume on 8 October 2005. (2) MIPAS values are zonal mean values for 10◦N
between 8 September 2003 and 1 December 2003.
altitude ACE-FTS(1) MIPAS(2) (km) (pptv) (pptv) 20 23 19 18 23 15 16 31 22 14 37 61 12 92 71
ACPD
7, 13627–13652, 2007 MIPAS-Envisat formaldehyde retrieval T. Steck et al. Title Page Abstract Introduction Conclusions References Tables Figures ◭ ◮ ◭ ◮ Back Close Full Screen / EscPrinter-friendly Version Interactive Discussion
Table 3. Comparison with Odin-SMR measurements for 3 latitude bands: 90◦S–45◦S, 30◦S–
30◦N, and 45◦N–90◦N. Odin-SMR values are averaged for the period 19 to 20 September
2005, Reprobus values are averaged for September 2005, and MIPAS values are averaged for the period 8 September 2003 to 1 December 2003. All formaldehyde values are in pptv.
altitude 90◦S–45◦S 30◦S–30◦N 45◦N–90◦N
(km) Odin-SMR Reprobus MIPAS Odin-SMR Reprobus MIPAS Odin-SMR Reprobus MIPAS
49 28 61 47 83 91 76 40 49 6
45 59 67 61 76 122 95 43 53 16
41 43 62 65 88 132 104 42 50 23
ACPD
7, 13627–13652, 2007 MIPAS-Envisat formaldehyde retrieval T. Steck et al. Title Page Abstract Introduction Conclusions References Tables Figures ◭ ◮ ◭ ◮ Back Close Full Screen / EscPrinter-friendly Version Interactive Discussion EGU
1000
1200
1400
1600
1800
Wavenumber (cm
-1)
0.0
0.5
1.0
1.5
2.0
2.5
Radiance (nW/(cm
2sr cm
-1))
Fig. 1. Simulated H2CO spectrum at 16.4 km tangent altitude with only H2CO in the atmosphere
ACPD
7, 13627–13652, 2007 MIPAS-Envisat formaldehyde retrieval T. Steck et al. Title Page Abstract Introduction Conclusions References Tables Figures ◭ ◮ ◭ ◮ Back Close Full Screen / EscPrinter-friendly Version Interactive Discussion 1700 1720 1740 1760 1780 1800 Wavenumber (cm-1 ) 0 50 100 150 200 250 Radiance (nW/(cm 2 sr cm -1 )) 1700 1720 1740 1760 1780 1800 Wavenumber (cm-1 ) 0.0 0.2 0.4 0.6 0.8 1.0 1.2 Radiance (nW/(cm 2 sr cm -1 ))
Fig. 2. Top: Simulated spectrum at 16.4 km tangent altitude; tropical conditions, all gases
ACPD
7, 13627–13652, 2007 MIPAS-Envisat formaldehyde retrieval T. Steck et al. Title Page Abstract Introduction Conclusions References Tables Figures ◭ ◮ ◭ ◮ Back Close Full Screen / EscPrinter-friendly Version Interactive Discussion EGU -100 0 100 200 300 vmr (pptv) 10 20 30 40 50 60 altitude (km) result initial guess noise error
Fig. 3. Formaldehyde retrieval result (solid) (orbit 8194, 24 September 2003, 14◦S/46◦W) with
ACPD
7, 13627–13652, 2007 MIPAS-Envisat formaldehyde retrieval T. Steck et al. Title Page Abstract Introduction Conclusions References Tables Figures ◭ ◮ ◭ ◮ Back Close Full Screen / EscPrinter-friendly Version Interactive Discussion 0 20 40 60 80 100 120 error (pptv) 10 20 30 40 50 60 altitude (km)
random
noise
shift
gain
los
systematic
spectro
ils
total
Fig. 4. Error analysis of formaldehyde retrieval (24 September 2003, 14◦S/46◦W). Error
sources from top to bottom: total random error (solid black), measurement noise (solid blue), spectral shift (solid red), gain calibration uncertainty (solid purple), line-of-sight (LOS) uncer-tainty (solid green), total systematic error (dashed black), spectroscopic data uncertainties (dashed blue), instrumental line shape (ILS) (dashed yellow), and total error (dotted black).
ACPD
7, 13627–13652, 2007 MIPAS-Envisat formaldehyde retrieval T. Steck et al. Title Page Abstract Introduction Conclusions References Tables Figures ◭ ◮ ◭ ◮ Back Close Full Screen / EscPrinter-friendly Version Interactive Discussion EGU -0.05 0.00 0.05 0.10 0.15 0.20 Averaging kernel 10 20 30 40 50 60 altitude (km)
Fig. 5. Formaldehyde averaging kernels, some altitudes are highlighted in colors, dotted
hori-zontal lines delimit the altitude regions characterized by one degree of freedom each, which is derived from sum of the diagonal elements of the averaging kernel matrix (diamonds).
ACPD
7, 13627–13652, 2007 MIPAS-Envisat formaldehyde retrieval T. Steck et al. Title Page Abstract Introduction Conclusions References Tables Figures ◭ ◮ ◭ ◮ Back Close Full Screen / EscPrinter-friendly Version Interactive Discussion
0
100
200
300
relative latitude (deg)
0
5
10
15
number
Fig. 6. Degrees of freedom (solid line) and number of cloud-free tangent altitudes (crosses)
along orbit 8194 (24 September 2003). The values on the abscissa have the following meaning: 0◦and 180◦correspond to the equator, 90◦to the north pole, and 270◦to the south pole. Dotted
ACPD
7, 13627–13652, 2007 MIPAS-Envisat formaldehyde retrieval T. Steck et al. Title Page Abstract Introduction Conclusions References Tables Figures ◭ ◮ ◭ ◮ Back Close Full Screen / EscPrinter-friendly Version Interactive Discussion EGU -90-80-70-60-50-40-30-20-10 0 10 20 30 40 50 60 70 80 90 Latitude (deg) 10 20 30 40 50 Altitude (km) -40 0 0 0 0 40 40 40 40 40 80 80 120 120 pptv
0 50 100 150
Fig. 7. Zonal mean of formaldehyde for the period 8 September 2003–1 December 2003. Zonal
averages are taken for 5◦ latitudinal bins. White areas mean no data available or values are
ACPD
7, 13627–13652, 2007 MIPAS-Envisat formaldehyde retrieval T. Steck et al. Title Page Abstract Introduction Conclusions References Tables Figures ◭ ◮ ◭ ◮ Back Close Full Screen / EscPrinter-friendly Version Interactive Discussion -90-80-70-60-50-40-30-20-10 0 10 20 30 40 50 60 70 80 90 Latitude (deg) 10 20 30 40 50 Altitude (km) -40 0 0 0 0 40 40 40 40 40 80 80 120 pptv
0 50 100 150
Fig. 8. Zonal mean of daytime formaldehyde for the period 8 September 2003–1 December
ACPD
7, 13627–13652, 2007 MIPAS-Envisat formaldehyde retrieval T. Steck et al. Title Page Abstract Introduction Conclusions References Tables Figures ◭ ◮ ◭ ◮ Back Close Full Screen / EscPrinter-friendly Version Interactive Discussion EGU -90-80-70-60-50-40-30-20-10 0 10 20 30 40 50 60 70 80 90 Latitude (deg) 10 20 30 40 50 Altitude (km) -40 0 0 0 0 0 0 0 40 40 40 40 40 40 40 80 pptv
0 50 100 150
Fig. 9. Zonal mean of nighttime formaldehyde for the period 8 September 2003–1 December