MAGNETIC RESONANCE
Axial T2* mapping in intervertebral discs: a new technique
for assessment of intervertebral disc degeneration
Sven Hoppe&Sebastian Quirbach&Tallal C. Mamisch&
Fabian G. Krause&Stefan Werlen&Lorin M. Benneker
Received: 23 September 2011 / Revised: 6 February 2012 / Accepted: 10 February 2012 / Published online: 29 April 2012 # European Society of Radiology 2012
Abstract
Objectives To demonstrate the potential benefits of bio-chemical axial T2* mapping of intervertebral discs (IVDs) regarding the detection and grading of early stages of de-generative disc disease using 1.5-Tesla magnetic resonance imaging (MRI) in a clinical setting.
Methods Ninety-three patients suffering from lumbar spine problems were examined using standard MRI protocols including an axial T2* mapping protocol. All discs were classified morphologically and grouped as“healthy” or “ab-normal”. Differences between groups were analysed regard-ing to the specific T2* pattern at different regions of interest (ROIs).
Results Healthy intervertebral discs revealed a distinct cross-sectional T2* value profile: T2* values were signifi-cantly lower in the annulus fibrosus compared with the nucleus pulposus (P00.01). In abnormal IVDs, T2* values were significantly lower, especially towards the centre of the disc representing the expected decreased water content of the nucleus (P00.01). In herniated discs, ROIs within the nucleus pulposus and ROIs covering the annulus fibrosus showed decreased T2* values.
Conclusions Axial T2* mapping is effective to detect early stages of degenerative disc disease. There is a potential benefit of axial T2* mapping as a diagnostic tool, allowing the quantitative assessment of intervertebral disc degeneration. Key Points
• Axial T2* mapping effective in detecting early degenerative disc disease.
• Healthy and abnormal intervertebral discs revealed dis-tinct cross-sectional T2* value profiles.
• T2* can be performed at 1.5 T in a clinical setting. Keywords MRI . Axial T2* mapping . 1.5 Tesla . Lumbar . Degenerative disc disease
Introduction
Lower-back pain is the most common reason for limitation of activity in patients below 45 years. The lifetime preva-lence of lower-back pain is up to 80%, leading to enormous costs due to treatment and work absenteeism [1]. Degener-ative disc disease (DDD) is regarded as the most prevalent cause of lower-back pain, even though the pathophysiolog-ical correlations between pain and disc degeneration are not fully understood as the problem of lower-back pain is mul-tifactorial [2]. In intervertebral discs (IVDs), the annulus fibrosus (AF) consists of fibro-cartilage; its function as a rigid containment for the nucleus pulposus (NP) accounts for its fibrous structure and low water content. The gelati-nous structure of the NP, however, consists mostly of water, bearing a low yield of collagenous material. Degeneration of intervertebral discs is initiated by the incapacity of disc cells to maintain a highly hydrated proteoglycan rich matrix of the nucleus pulposus as well as a loss of the collagen structure that affects the mechanical integrity of the IVD. S. Hoppe
:
S. Quirbach:
F. G. Krause:
L. M. Benneker (*)Department of Orthopaedic Surgery, Inselspital, Berne University Hospital,
3010 Berne, Switzerland e-mail: lorin.benneker@insel.ch T. C. Mamisch
Department of Radiology, Inselspital, Berne University Hospital, Berne, Switzerland
S. Werlen
Department of Radiology, Clinic Sonnenhof, Berne, Switzerland
The IVD’s mechanical function in distributing axial loads and absorbing shock while providing flexibility relies heavily on the hydrodynamic capabilities of the NP [3–6].
Magnetic resonance imaging (MRI) is a well-established method for the evaluation of DDD, providing primary diag-nostics as well as grading of disc degeneration. Morpholog-ical axial and sagittal T1- and T2-weighted imaging are standard diagnostic methods; however, they are limited in detecting early signs of degeneration [7]. Therefore, several grading systems used for the classification of DDD focus on loss of signal intensity in sagittal T2-weighted images. Some authors, however, state that early degeneration may exist before a significant loss of T2 signal intensity occurs [8–11]; these early alterations cannot be measured by stan-dard MRI sequences. Another limitation of today’s stanstan-dard MRI protocols is the distinction of the nucleus–annulus interface. In healthy IVDs, the nucleus can easily be distin-guished on MRI from the annulus fibrosus. In degenerative IVDs, on the other hand, the distinction of nucleus pulposus and annulus fibrosus may be difficult to evaluate or may even completely be lost in end-stage DDD. The detection of early degeneration is also dependent on the visualisation of biomechanically important structures, as for example in the annulus fibrosus, where Thompson described the mucinous infiltration and a loss of fibre orientation of the inner annulus as some of the earliest signs of disc degeneration [12].
Watanabe et al. [13] demonstrated axial biochemical T2 mapping as a potential diagnostic method allowing for quantitative measurement of the structural integrity of IVDs. Utilising this new technique, more detailed evaluation and grading of spinal disorders is possible. Furthermore, new classification and scoring systems of DDD that take findings gained from T2 mapping into account may be implemented in order to detect degenerative processes within the IVD earlier than other diagnostic methods. T2 mapping allows for quantitative grading of the condition of the IVD as it is highly sensitive to hydration and collagen structure; however, providing high enough resolution, this technique is impaired to a certain degree by high time consumption and is limited to high-field MR units [13].
T2* has also proven to be a reliable and valid method in biochemical cartilage imaging [14]. Few available studies imply a close relationship to T2; nevertheless, T2* seems to be more dependent on micro-structural tissue changes and has shorter imaging times providing the same spatial reso-lution; therefore T2* appears to be an adequate diagnostic method that can be implemented into a clinical MR protocol [15].
The purpose of our study was to demonstrate the poten-tial benefits of biochemical axial T2* mapping of IVDs regarding the detection and grading of DDD using a large patient cohort; furthermore, to correlate our results with already existing clinical scores with the goal to assess the
capability of T2* mapping as a diagnostic technique on a day-to-day basis.
Materials and methods Patient population
The study was approved by the local ethics committee (Kantonale Ethikkommission Bern KEK 18/05). Ninety-three patients (37 male, 56 female) suffering from various impairments originating from the lumbar spine (L1/2, L2/ 3 L3/4, L4/5 and L5/S1) were examined using a standard MRI protocol including axial T2* mapping sequences. Mean age at the time of the examination was 53 years (SD, 16 years; range, 18–87 years). The symptoms and diagnoses ranged from moderate lumbar disorders such as lower-back pain up to herniated IVDs; totally collapsed discs, however, were excluded from the study. In total, 239 lumbar discs were examined.
Image acquisition
MR examination was performed on a 1.5-Tesla MR unit (Magnetom Avanto, Siemens Erlangen, Germany). The imag-ing protocol included morphological (sagittal T1-weighted fast-spine-echo as well as sagittal, axial and coronal T2-weighted fast-spine-echo) and biochemical sequences. T2* mapping was used instead of T2 mapping, because within given measurement time it is possible to perform T2 (MSME) measurement with slice thickness lower than 2–4 mm, which is a three-dimensional (3D) technique.
As a result, these maps have limited spatial resolution with section thickness in the range of 2–4 mm on current systems. The 2D acquisition precludes reformatting the data into 3D surface maps and requires reliable positioning to achieve reproducible results, a critical factor in longitudinal studies. Therefore T2* imaging has in addition the possibility to reformat 3D data in any arbitrary orientation. However, this is true only in case of isotropic 3D measurements, which were not applied within our study.
The inherent variability in the 180-degree refocusing pulses leads to error in T2 estimates as a result of the contribution from stimulated echoes and magnetisation transfer (MT). The T2* value is related to T2 as follows: 1/T2*01/T2+1/T2’, where 1/T2’ can be given by ã∇B. Assuming the applied static magnetic field (B0) is uniform and constant over the region of interest (ROI), then the 1/ T2’ term will only be influenced by local susceptibility fields. The lack of radiofrequency refocusing pulses sub-stantially decreases the contribution of MT to cartilage contrast and thus may lead to differences in sensitivity of T2* and T2 to changes of disc structure T2* relaxation
times were measured by a multi-echo gradient-echo se-quence (TR/TE/FA~600/5.7, 9.8, 14, 18.1, 22.2, 26.4/20°, 1.5 mm slice thickness). Imaging time decreased to 3:05 min compared with the T2 protocol. Axial T2* mapping was performed on the same IVDs that were examined mor-phologically with the routine protocol; therefore, T2* map-ping was performed on two or more IVDs in some patients. Data analysis
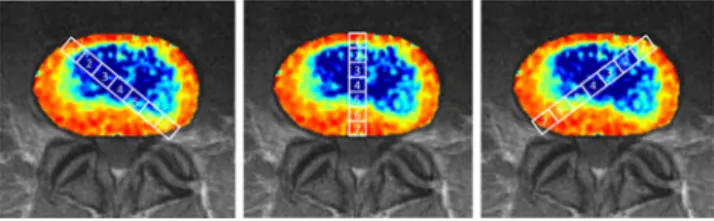
T2* maps were calculated using an inline processing package (SyngoMapIt) supplied by Siemens MR (Siemens Medical, Erlangen, Germany) which uses a log-linear least-squares method to fit the echo intensities. Each intervertebral disc was covered by three slices, representing the weight-bearing central part of the disc. In cases with severely degenerated interverte-bral discs, only the most central slice was used in order to avoid flawed ROI analysis/structural interference originating from the endplates. Totally collapsed discs were excluded from the data. Within each slice, a total of 21 ROIs were drawn by one observer experienced in musculoskeletal radiology for 5 years in consensus with a senior musculoskeletal radiologist. Regard-less of eventual underlying pathological conditions, except for collapsed disc space, these ROIs were drawn following a standard protocol for all IVDs. The ROI analysis was per-formed in one central, sagittally oriented column (C) and two oblique columns (L, R), thus creating three perpendicular col-umns of ROIs spanning through the entire cross-section (Fig.1). For each column, seven rectangular ROIs (C1–C7, L1–L7, and R1–R7) sized between 380 and 420 pixels, were drawn across the entire IVD. ROI 1 was drawn at the posterior margin of the disc, ROI 7 at the anterior margin, thus represent-ing the outer annulus fibrosus (AF); ROIs 2 and 3 as well as ROIs 5 and 6 were created within the boundary region between inner annulus fibrosus and nucleus pulposus (NP). ROI 4 was drawn at the centre of the IVD, representing the centre of the nucleus pulposus. Furthermore, in ROI 4, overlapping of all three columns was allowed to occur.
Classification and grading system
Radiological evaluation was performed utilising the stan-dard morphological T1- and T2-weighted images. All
images were graded by an experienced radiologist (15 years of experience with MRI) and an experienced orthopaedic spine surgeon (10 years specialising in spine surgery) by consensus decision. Initially, all discs (n0239) were divided into a group of healthy IVDs (n072) and a group of abnor-mal IVDs with any pathological condition (n0167). All abnormal discs were further subdivided into three groups according to the diagnosis based on morphological evalua-tion. Group 1 included mild to moderate disc degeneration without other impairments (n077); group 2 comprised all IVDs in which annular tears in the AF were detected (n08). Herniated/protruded NPs were subsumed in group 3 (n082). Additionally, all IVDs were evaluated with the Boos/ Pfirrmann grading system for degeneration [16]. For this score, sagittal T2-weighted MRI were used. Grade V of Pfirrmann’s scoring system was intentionally omitted since grade V includes lumbar segments with an entirely col-lapsed intervertebral disc space; our study design, however, excluded collapsed IVDs a priori.
Statistical analysis
Mean values were used for statistical analysis. Quantitative evaluation was done by analysis of variance using a three-way ANOVA with random factor, considering the fact of different measurements within each patient or control. All statistics were done with SPSS version 14.0 (SPSS Institute, Chicago, IL, USA) for Windows (Microsoft, Redmond, WA, USA). Differences with a P value less than 0.05 were considered as statistically significant.
Results
Results for all intervertebral discs
T2* relaxation time values at ROIs 1–7 in each column of all IVDs were combined and the mean values were calculated. Figure1shows a typical cross-sectional T2* relaxation time profile including the central, oblique left and oblique right columns of ROIs. The distribution shows lower mean values in the outer ROIs (ROIs 1 and 7) and rising mean values in the central ROIs (ROIs 2–6). Separate analysis of the central (C), oblique left (L) and right (R) lateral columns did not reveal any significant difference (Fig.2).
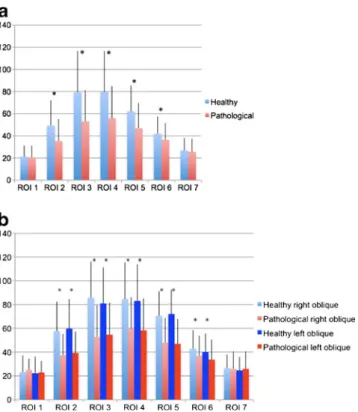
Comparison of healthy and pathological intervertebral discs All IVDs marked as healthy (n02) in the morphological eval-uation were combined and the mean values were calculated. As demonstrated in Fig.3a, a cross-sectional T2* relaxation time profile revealed higher mean values within the ROIs 2–6 (inner AF and NP) than in the ROIs 1 and 7 (outer AF). Fig. 1 ROIs 1–7 in the typical T2* cross-sections (left oblique,
cen-tral, right oblique). ROIs 1 and 70outer annulus; ROIs 2 and 60inner annulus; ROIs 3–50nucleus pulposus
Compared with healthy discs, all IVDs that were mor-phologically marked as pathological (n0167), showed sig-nificantly lower T2* values (P<0.05) in ROIs 2–6 (inner AP and NP). T2* relaxation times for ROIs 1 and 7 (outer AF) are not significantly lower compared with healthy discs. That implies the discrimination between nucleus pulposus and annulus fibrosus becomes less clear in pathological discs. Again, separate analysis of the lateral-oblique ROI columns resulted in no significant difference compared with the central mean T2* values. Data for left- and right-lateral-oblique T2* relaxation time values are shown in Fig.3b. Results regarding classification of disc disease
IVDs with mild to moderate signs of degeneration (group 1, n077) show significantly lower mean T2* values for ROIs covering the anterior inner AF and the NP (ROIs 2–5) compared with healthy IVDs, whereas T2* values covering the outer AF and posterior inner AF (ROIs 1, 6 and 7) are similar to healthy IVDs (Fig.4).
The same pattern can be found in the group of IVDs with herniated nucleus pulposus (group 3, n082). The T2* values for the inner AF and NP are lower, the values for the outer AF equal compared with healthy IVDs.
Discs with annular tears (group 2, n08), however, show global mean T2* relaxation time values similar to healthy discs in all ROIs. No significant decrease in relaxation time was observed in this group.
Results regarding Pfirrmann classification
Using the Boos/Pfirrmann score, 80 IVDs were classified as grade I or healthy, 81 as grade II, 48 as grade III, and 30 as grade IV (Table 1). Severe degeneration corresponding to Fig. 2 Mean T2* relaxation time values (ms) and standard deviation
(SD) for ROIs 1–7 of all intervertebral disks (Healthy+Pathological). ROIs 1 and 70outer annulus; ROIs 2 and 60inner annulus; ROIs 3–50 nucleus pulposus. There is no significant difference between the lateral and central ROIs detectable; ANOVA test, P<0.05
Fig. 3 a Pathological IVDs show significantly lower T2* values (ms) in ROIs 2–6 compared with healthy IVDs, whereas in ROIs 1 and 7 T2* relaxation times are not significantly different. ROIs 1 and 70 outer annulus; ROIs 2 and 60inner annulus; ROIs 3–50nucleus pul-posus. *Significant differences between the Healthy and Pathological groups, line on top of the bars indicates standard deviation; t-test, P< 0.05. b According to the central ROIs in the oblique ROIs pathological IVDs show significantly lower T2* values (ms) in ROIs 2–6 compared with healthy IVDs whereas in ROI 1 and 7 T2* relaxation times of healthy and pathological disks are not significantly different. ROIs 1 and 70outer annulus; ROIs 2 and 60inner annulus; ROIs 3–50nucleus pulposus. *Significant differences between the Healthy and Patholog-ical groups, line on top of the bars indicates standard deviation; t-test, P<0.05
Fig. 4 IVDs with mild to moderate changes show a similar T2* relaxation pattern (ms) then IVDs with herniated/protrused NP, where-as IVDs with annular tears are comparable to normal IVDs. ROIs 1 and 70outer annulus; ROIs 2 and 60inner annulus; ROIs 3–50nucleus pulposus. *Significant differences between the mild-moderate changes group to the normal group,+significant changes between the herniated/ protrused group and the normal group, line on top of the bars indicates standard deviation; P<0.05, ANOVA test
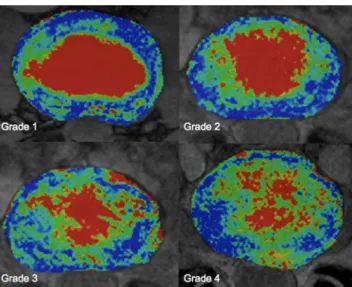
Pfirrmann’s grade V was excluded from this study. Separate analysis according to the morphological Boos/Pfirrmann score shows global T2* relaxation times decreasing with increasing Pfirrmann grade. Furthermore, the typical pattern of an ROI column flattens as the severity of degeneration increases and the distinction between nucleus and annulus becomes unclear (Fig. 5). Grade IV IVDs show atypical profile compared with the other grades of degeneration. The decrease in T2* values, however, occurs more promi-nently in ROIs covering the central sections; values in ROIs 1 and 7, located within the outer AF, were not significantly lower (Table2and Fig.6).
Discussion
In this study we developed and investigated an MRI method, applicable for conventional 1.5-Tesla units, for axial T2* weighted mapping of intervertebral discs which can be used in a clinical set-up. Other studies already showed that quanti-tative sagittal T2 mapping allows to show significant differ-ences between herniated disc and annular tears compared with discs without pathological abnormalities [17] and can charac-terise different degrees of disc degeneration quantitatively [18]. Moreover it was shown that quantitative sagittal T2* is more sensitive for depicting changes in the annulus fibrosus compared with normal T2 sequences [19].
In contrast to sagittal oriented imaging methods, axial mapping allows the examination of a larger disc area and has shown to be a useful grading instrument, especially for early stages of disc degeneration [13]. Therefore, our hy-pothesis was that axial T2* mapping is a promising tech-nique to show early stages in disc degeneration in all areas of the intervertebral disc. The definition of 21 ROIs in the sagittal and two oblique cross-sections was necessary to observe and compare structural changes in the IVD itself independent of the underlying pathology.
Analysis of all healthy intervertebral discs assessed in this study revealed a distinct cross-sectional T2* value pro-file; T2* values were significantly lower in ROIs, covering the annulus fibrosus, compared with ROIs covering the nucleus pulposus. This demonstrates that T2* mapping is a sensitive marker for water and collagenous tissue. The fact that no difference between the central, left lateral, and right
lateral column was obeyed indicates the nearly identical biochemical structure of all three columns.
Regarding all pathological IVDs, the global mean T2* values were significantly lower, especially towards the cen-tre of the disc representing the expected decreased water content of the nucleus.
Table 1 Intervertebral discs (IVDs) classified by Boos/Pfirrmann score Pfirrmann classification n % Grade 1 80 33.5 Grade 2 81 33.9 Grade 3 48 20.1 Grade 4 30 12.5 Total 239 100.0
Fig. 5 T2* mapping at different stages of disk degeneration according to Pfirrmann grade 1 to Pfirrmann grade 4
Table 2 Post-Hoc-Test (Tukey HSD) for global T2* relaxation times of the 7 ROI’s comparing the groups according to the Pfirrmann grade (1 to 4); p < 0.05. ROI 1 & 7 = Outer Annulus; ROI 2 & 6 = Inner Annulus; ROI 3– 5 = Nucleus Pulposus
Dependent variable
Pfirrmann grade x Pfirrmann grade y P value
ROI 1 1 2 0.061 2 3 0.99 3 4 0.702 ROI 2 1 2 0.309 2 3 0.001 3 4 0.975 ROI 3 1 2 0.175 2 3 0.003 3 4 0.054 ROI 4 1 2 0.137 2 3 0.009 3 4 0.019 ROI 5 1 2 0.569 2 3 0.001 3 4 0.031 ROI 6 1 2 0.981 2 3 0.001 3 4 0.173 ROI 7 1 2 0.04 2 3 0.126 3 4 0.239
Separate analysis regarding specific disc pathology, how-ever, revealed that only discs affected by mild to moderate degeneration, without any signs of tears or herniations, had lower T2* values in the central regions solely. In herniated discs, not only the ROIs within the nucleus pulposus but also ROIs covering the annulus fibrosus showed decreased T2* values. Mean T2* values in discs affected by annular tears did not differ significantly from healthy IVDs. Although the sample number in this group was smaller (n08), annular tears seem not be accompanied by the same microstructural and biochemical alterations as observed in otherwise degen-erated discs, indicating a different underlying disease process. T2* seems not capable of detecting such small lesions; here, probably protocols for high-field MR units with better resolu-tion are better suited for quantitative assessment of annular tears.
Watanabe et al. [13] described the potential benefits of standard axial T2 mapping in the lumbar spine. In correla-tion with clinical evaluacorrela-tion, it was demonstrated that T2 relaxation times correlate with the structural integrity of IVDs. Benefits of T2 mapping as a routine technique for biochemical and structural analysis of cartilage tissue, not only on the spine but also on other joints, such as the hip, knee, and ankle, have been confirmed by several other publications. T2* mapping does not differ extensively from T2 mapping and is expected to depict the same structural changes within IVDs with shorter imaging times and with-out the restriction to high-field MR units. However, T2* is more likely to be affected by susceptibility fields which may originate either from the boundary layer between cartilage and bone or on a microscopic scale; this further implicates that T2* may be more sensitive to microstructural changes, but it is also more affected by susceptibility artefacts
deriving from metallic implants, etc. In our study, however, we did not encounter severe limitations caused by suscepti-bility artefacts.
We could not determine any variations in signal intensity due to magic angle effects; such variations may occur during imaging of IVDs with a vertically oriented magnetic field when collagen fibres are aligned with an angle of 54.7° to the static magnetic field B0 [20]. In our case, however, B0 was orientated horizontally and therefore no signal varia-tions should have been expected [21]. Due to our detailed ROI analysis, variations of the T2* signal in areas where the collagen fibres were close to the magic angle would have been detected easily.
A major limitation of our study is the fact that no histo-logical or biochemical analysis of intervertebral discs has been performed. Therefore it is not possible to demonstrate a direct correlation between T2* relaxation times and the actual condition of IVDs.
In conclusion, axial T2* mapping is feasible to detect early stages of degenerative disc disease. Our study demon-strates the potential benefit of axial T2* mapping as a diagnostic tool, allowing the quantitative assessment of intervertebral disc degeneration. The protocol can be per-formed in one-third of the MR data acquisition time used to perform a T2 mapping and can be performed on a standard 1.5-T unit in a clinical setting and therefore has the potential for large population studies.
Acknowledgements This study was supported by the‘Stipendienfonds’ of the Swiss Orthopaedic Association (SGO).
References
1. Andersson GB (1998) Epidemiology of low back pain. Acta Orthop Scand Suppl 281:28–31
2. Podichetty VK (2007) The aging spine: the role of inflammatory mediators in intervertebral disc degeneration. Cell Mol Biol (Noisy-le-grand) 53:4–18
3. Boos N, Wallin A, Gbedegbegnon T, Aebi M, Boesch C (1993) Quantitative MR imaging of lumbar intervertebral disks and ver-tebral bodies: influence of diurnal water content variations. Radi-ology 188:351–354
4. Buckwalter JA (1995) Aging and degeneration of the human intervertebral disc. Spine (Phila Pa 1976) 20:1307–1314 5. Paajanen H, Lehto I, Alanen A, Erkintalo M, Komu M (1994)
Diurnal fluid changes of lumbar discs measured indirectly by magnetic resonance imaging. J Orthop Res 12:509–514. doi:10.1002/jor.1100120407
6. Roberts N, Hogg D, Whitehouse GH, Dangerfield P (1998) Quan-titative analysis of diurnal variation in volume and water content of lumbar intervertebral discs. Clin Anat 11:1–8. doi:10.1002/(SICI) 1098-2353(1998)
7. Pfirrmann CW, Metzdorf A, Zanetti M, Hodler J, Boos N (2001) Magnetic resonance classification of lumbar intervertebral disc degeneration. Spine (Phila Pa 1976) 26:1873–1878
8. Schiebler ML, Camerino VJ, Fallon MD, Zlatkin MB, Grenier N, Kressel HY (1991) In vivo and ex vivo magnetic resonance Fig. 6 Global T2* relaxation times (ms) decreasing with increasing
Pfirrmann grade. Severe degeneration corresponding to Pfirrmann’s grade V was excluded from this study. ROIs 1 and 70outer annulus; ROIs 2 and 60inner annulus; ROIs 3–50nucleus pulposus.+
Differ-ence between ROIs 1 and 2; *differDiffer-ence between ROIs 2 and 3;
#difference between ROIs 3 and 4; line on top of the bars indicates
imaging evaluation of early disc degeneration with histopathologic correlation. Spine 16:635–640
9. Gunzburg R, Parkinson R, Moore R et al (1992) A cadaveric study comparing discography, magnetic resonance imaging, histology, and mechanical behavior of the human lumbar disc. Spine 17:417– 426
10. Benneker LM, Heini PF, Anderson SE, Alini M, Ito K (2005) Correlation of radiographic and MRI parameters to morphological and biochemical assessment of intervertebral disc degeneration. Eur Spine J 14:27–35
11. Antoniou J, Steffen T, Nelson F et al (1996) The human lumbar intervertebral disc: evidence for changes in the biosynthesis and denaturation of the extracellular matrix with growth, maturation, ageing, and degeneration. J Clin Invest 98:996–1003. doi:10.1172/ JCI118884
12. Thompson JP, Pearce RH, Schechter MT, Adams ME, Tsang IK, Bishop PB (1990) Preliminary evaluation of a scheme for grading the gross morphology of the human intervertebral disc. Spine (Phila Pa 1976) 15:411–415
13. Watanabe A, Benneker LM, Boesch C, Watanabe T, Obata T, Anderson SE (2007) Classification of intervertebral disk degener-ation with axial T2 mapping. AJR Am J Roentgenol 189:936–942. doi:10.2214/AJR.07.2142
14. Murphy BJ (2001) Evaluation of grades 3 and 4 chondromalacia of the knee using T2*-weighted 3D gradient-echo articular cartilage imaging. Skeletal Radiol 30:305–311
15. Krause FG, Klammer G, Benneker LM, Werlen S, Mamisch TC, Weber M (2010) Biochemical T2* MR quantification of ankle arthrosis in pes cavovarus. J Orthop Res 28:1562–1568. doi:10.1002/jor.21192
16. Pfirrmann CW, Metzdorf A, Zanetti M, Hodler J, Boos N (2001) Magnetic resonance classification of lumbar intervertebral disc degeneration. Spine 26:1873–1878
17. Trattnig S, Stelzeneder D, Goed S et al (2010) Lumbar interverte-bral disc abnormalities: comparison of quantitative T2 mapping with conventional MR at 3.0 T. Eur Radiol 20:2715–2722. doi:10.1007/s00330-010-1843-2
18. Stelzeneder D, Welsch GH, Kovacs BK et al (2011) Quantitative T2 evaluation at 3.0 T compared to morphological grading of the lumbar intervertebral disc: a standardized evaluation approach in patients with low back pain. Eur J Radiol 81:324–330. doi:10.1016/j.ejrad.2010.12.093
19. Welsch GH, Trattnig S, Paternostro-Sluga T et al (2010) Parametric T2 and T2* mapping techniques to visualize intervertebral disc degeneration in patients with low back pain: initial results on the clinical use of 3.0 Tesla MRI. Skeletal Radiol 40:543–551. doi:10.1007/s00256-010-1036-8
20. Xia Y (2000) Magic-angle effect in magnetic resonance imaging of articular cartilage: a review. Invest Radiol 35:602–621
21. Hardy PA (1996) Intervertebral disks on MR images: variation in signal intensity with the disk-to-magnetic field orientation. Radi-ology 200:143–147