Publisher’s version / Version de l'éditeur:
Journal of Materials Science, 17, pp. 785-802, 1982
READ THESE TERMS AND CONDITIONS CAREFULLY BEFORE USING THIS WEBSITE. https://nrc-publications.canada.ca/eng/copyright
Vous avez des questions? Nous pouvons vous aider. Pour communiquer directement avec un auteur, consultez la première page de la revue dans laquelle son article a été publié afin de trouver ses coordonnées. Si vous n’arrivez pas à les repérer, communiquez avec nous à [email protected].
Questions? Contact the NRC Publications Archive team at
[email protected]. If you wish to email the authors directly, please see the first page of the publication for their contact information.
NRC Publications Archive
Archives des publications du CNRC
This publication could be one of several versions: author’s original, accepted manuscript or the publisher’s version. / La version de cette publication peut être l’une des suivantes : la version prépublication de l’auteur, la version acceptée du manuscrit ou la version de l’éditeur.
Access and use of this website and the material on it are subject to the Terms and Conditions set forth at
Constant strain- and stress-rate compressive strength of
columnar-grained ice
Sinha, N. K.
https://publications-cnrc.canada.ca/fra/droits
L’accès à ce site Web et l’utilisation de son contenu sont assujettis aux conditions présentées dans le site LISEZ CES CONDITIONS ATTENTIVEMENT AVANT D’UTILISER CE SITE WEB.
NRC Publications Record / Notice d'Archives des publications de CNRC:
https://nrc-publications.canada.ca/eng/view/object/?id=607339dd-e792-4532-966b-a2c09c16df77 https://publications-cnrc.canada.ca/fra/voir/objet/?id=607339dd-e792-4532-966b-a2c09c16df77Sar
'TPU
no.
1039
1 c.-
2
,
,'----
National Research Conseil national
I
+
Council Canada de recherches CanadaCONSTANT STRAIN- AND STRESS-RATE COMPRESSIVE STRENGTH O F COLUMNAR-GRALNEI) ICE
b y N. K. Sinha
ANALYZED
R e p r i n t e d f r o m J o u r n a l of M a t e r i a l s S c i e n c e Vol. 17, 1982 p. 7 8 5-
802 I DBR P a p e r No. 1039 IBIBLIO"PH~@W
Division of Building R e s e a r c h I
Reeh.
%bSEteisSOMMAIRE On a 6 t u d i 6 l a r e s i s t a n c e B l a c o m p r e s s i o n s i m p l e d e l a g l a c e c o l u m n a i r e i s o t o p e t r a n s v e r s a l e m e n t s o u s c h a r g e s a p p l i q u ' e e s normalement 3 l ' a x e l o n g i t u d i n a l d e s c o l o n n e s 2 h a u t e t e m p e r a t u r e h o m o l o g u e d e 0,96 Tm s o u s v i t e s s e s d e d e f o r m a t i o n e t d e c o n t r a i n t e v e r i t a b l e m e n t c o n s t a n t e s . Pour c e f a i r e , on a u t i l i s ' e un systSme d ' e s s a i s h y d r a u l i q u e a s s e r v i e n b o u c l e f e r d e p l a c e d a n s u n e chambre f r o i d e . La dependance e n t r e l e s v i t e s s e s d e d e f o r m a t i o n e t d e c o n t r a i n t e e t l a l i m i t e e l a s t i q u e s u p e r i e u r e p e u t C t r e e x p r i d e e n t e r m s d e l o i s d e p u i s s a n c e . La dependance o b s e r v e e d e l a r ' e s i s t a n c e s u r l a v i t e s s e d e d e f o r m a t i o n e t a i t numgriquement l a msme q u e l a d e p e n s e du d e b i t d ' u n f l u i d e v i s q u e u x s u r l a c o n t r a i n t e d a n s d e s e s s a i s d e f l u a g e s o u s c o n t r a i n t e c o n s t a n t e B t e m p e r a t u r e i d e n t i q u e . On montre que l a s e n s i b i l i t e d e l a l i m i t e e l a s t i q u e B l a v i t e s s e d e d e f o r m a t i o n s e compare b i e n B d e s r e s u l t a t s a n t e r i e u r s ( o b t e n u s B l ' a i d e d ' u n e machine c l a s s i q u e p o u r un d e p l a c e m e n t 3 v i t e s s e c o n s t a n t e d e l a p l a q u e de c h a r g e ) s e u l e m e n t s i l a v i t e s s e moyenne d e d e f o r m a t i o n B l a l i m i t e e s t u t i l i s ' e e comme v a r i a b l e i n d e p e n d a n t e a u l i e u de l a v i t e s s e c l a s s i q u e n o m i n a l e d e d e f o r m a t i o n . Les f a c t e u r s de d e f o r m a t i o n e t de d u r e e d e s e s s a i s s o n t e g a l e m e n t Ctudi'es d a n s l e document. I1 e s t montr'e q u ' i l e x i s t e e n t r e l a l i m i t e ' e l a s t i q u e e n c o m p r e s s i o n , l a v i t e s s e d e d e f o r m a t i o n , l a d e f o r m a t i o n p a r f a t i g u e e t l a dur'ee d ' u n e i n t e r d e p e n d a n c e tres s e m b l a b l e 2 1 1 i n t e r d 6 p e n d a n c e e n t r e l e s g r a n d e u r s c o r r e s p o n d a n t e s d e s d e f o r m a t i o n s p a r f l u a g e e n t r a c t i o n d a n s l e s metaux, l e s a l l i a g e s e t d ' a u t r e s mat'eriaux p o l y c r i s t a l l i n s B h a u t e t e m p e r a t u r e . On met e n r e l i e f l e f a i t que l a d e f o r m a t i o n p r e m a t u r e e p a r f i a b i l i t ' e du t y p e " f i s s u r e s " depend d e l a r i g i d i t e du s y s t b e d ' e s s a i s e t ne d o i t d o n c p a s C t r e vue cornme une c a r a c t ' e r i s t i q u e f o n d a m e n t a l e . La n o t i o n du module d e d e f o r m a t i o n e s t p r o p o s e e p o u r l ' e t u d e du p a s s a g e de 1 ' B t a t d u c t i l e 3 l ' e t a t f r i a b l e .
Journal of Materials Science
Journal of Materials Science is an international publica- tion reporting recent advances in all the major fields of investigation into the properties of materials. Papers and letters on metallurgy, ceramics, polymers, electrical materials, biomaterials, composites, and fibres appear regularly.
Papers for submission to the Journal of Materials Science should be sent to Professor W. Bonfield, Dept. of Materials, Queen Mary College, Mile End Road, London E l 4NS.
Journal of Materials Science is published monthly by Chapman and Hall Ltd., 11 New Fetter Lane, London EC4P 4EE, from whom subscription details are available.
J O U R N A L O F M A T E R I A L S S C I E N C E 1 7 ( 1 9 8 2 ) 7 8 5 - 8 0 2
Constant strain
-
and stress
-
rate compressive
strength of columnar -grained ice
N. K. SINHA
Geotechnical Section, Division of Building Research, National Research Council of Canada, Ottawa, Canada
Unconfined compressive strength of transversely isotropic columnar-grained ice has been investigated for loads applied normal to the longitudinal axis of the columns a t the high homologous temperature of 0.96 T, (T, is the melting temperature) under truly constant strain and stress rates. A closed-loop, servo-hydraulic test system inside a cold room was used. Both the strain- and stress-rate dependences of upper yield stress can be expressed in terms of power laws. The observed strain-rate dependence of strength was found to be numerically the same as the dependence of viscous-flow rate on stress in constant stress creep tests a t the same temperature. I t is shown that the strain-rate sensitivity of yield strength compares well with previous results (obtained under constant cross-head rates using a conventional machine) only i f the average strain rate to yield is used as the independent variable instead of the conventional nominal strain rate. The paper also discusses the strain and time aspects of the tests. It shows interdependence among values for compressive yield strength, strain rate, failure strain and time very similar to the inter- dependence among the corresponding values in tensile creep failures in metals, alloys and other polycrystalline materials a t high temperatures. It is emphasized that the splitting type of brittle-like premature failure depends on the stiffness of the test system and should not be considered to be a fundamental material property. The concept of failure modulus is proposed for examining the ductile to brittle transition.
1. Introduction
Rate sensitivity of ice strength is well recognized and several studies have been made of the strain- rate dependence of its compressive strength under uniaxial loading conditions. Tests were conducted under constant or near-constant actuator or cross- head displacement rates. Strain rates were some- times assumed to be constant and equal to "nominal strain rate", 6, =ill, that is, to the ratio of displacement rate, f , and specimen length, I . A relation was sought between the upper yield or maximum stress, of, and 6,. The upper yield stress will often be referred t o in this paper as yield stress, failure stress or strength.
A programme of developing strength testing procedures and methods of analysing the results was undertaken by the author [ I ] , with par- ticular attention given t o the non-constancy of the strain rate that usually exists for constant cross-
head displacement rate tests. Because of this non- constancy, such tests cannot be construed as taking place at constant strain rate.
Observation of specimens prior to failure revealed that deformation history influences internal cracking activity and therefore should affect strength. A reasonable representation of the deformation history was considered t o be given by the average strain rate to yield or failure,
6&= ef/tf, where ef and tf were, respectively, failure strain and failure time. Using instead of the nominal strain rate provided a coherent interrelation of of, E ~ , tf and for yielding and pointed out, in particular, the need t o establish the dependence of strength on a truly constant strain rate [I].
As strength measuring systems are invariably equipped t o record load, it was decided to examine the stress history of the author's earlier measure-
ments made with a conventional system. The observation that during a constant cross-head rate test the load was applied at a nearly constant rate, not only for the initial loading period (as observed by Traetteberg et al. [2] in examining the depen- dence of initial modulus on strain rate) but also for up to about 90 per cent of yield stress, indi- cated that a constant stress-rate analysis was more appropriate than the assumption of constant strain rate.
The analysis allowed the effect of test system stiffness on strength to be taken into consideration. It was shown that a stiff system would give a higher yield strength than a soft system at the same 6, and shift the occurrence of abrupt "brittle-like" premature failures to lower strain rates [I]. These conclusions were verified experimentally [3]. Much of the reported scatter in ice strength was confirmed, therefore, to be due not only to differ- ences in the type of ice but also to differences in the geometry of the specimens and the relative stiffness of the test systems. The stress rate analysis, however, posed the problem of what the response of ice would be for a truly constant stress rate.
The analyses emphasized the fact that for rate- sensitive materials, or, strictly speaking, for con- ditions where the rate sensitivity of a material becomes pronounced, not only the strength for compression-cracking types of failure, as argued by Kandall [4] and Karihaloo [5], but also the compressive yield strength may not be useful information without knowledge of the response of the test system. The need to control the stress or strain history during a strength measurement was clearly established.
This report presents results obtained from a closed-loop test system. To maintain continuity, other conditions of testing were kept the same as in the author's earlier studies, i.e., the type of ice, its structure, texture, density and average grain diameter, specimen geometry, test temperature, load and strain measurement. Specimens were prepared at the Division of Building Research, National Research Council in Ottawa, and tests were conducted at Exxon Production Research Laboratory in Houston, Texas, U.S.A.
2. Experimental details
2.1. Preparation of ice and specimens Rectangular specimens were made from columnar- grained S-2 ice of average cross-sectional grain
size, d = 4 to 5 mm and density of 9 17.7 kgm-3 at
-
9" C [6]. (This does not differ from single- crystal density of 9 17.8 kg m-3 by more than the error of measurement.) The ice was prepared from distilled and de-aerated water and selected accord- ing to previously described methods [7]. Speci- mens were machined to their final dimensions of 5 cm x 10 cmx
25 cm, with the axis ofthe columns normal to the lOcm x 25cm faces. They were made inside a cold room at - 10" C two weeks before they were transported to Houston by care- fully milling and surface finishing according to the method already described [I]. Specimens were stored in a kerosene bath to prevent sublimation. 2.2. Transporation of specimensSixteen specimens were transported in a heavily insulated box, each specimen coated with kerosene and stored inside a sealed plastic bag. The bags were individually wrapped with insulating and shock-absorbing material, then tightly arranged in the central part of the container and additional layers of insulation added at the periphery of the block of samples. Thin slices of dry ice were placed between the inner insulation and the insulated walls and the lid of the box. These precautions were taken to avoid any thermal or mechanical shock to the specimens. Their tempera- ture was monitored and allowed to drop to about
- 30" C from - 10" C in two days. Additional small amounts of dry ice were added to the box prior to the flight to Houston which took about 8 h. The box was taken to a cold room at - 10" C immediately after arrival. It was therefore outside a cold room for a total of 10 h exactly, in which time the temperature inside did not change by any significant amount. At Houston the specimens were allowed to warm up to the test temperature of
-
10" C over a two-day period.2.3. Test systems
The test machine was an MTS Model 810.15 of 1 .O MN capacity [8] situated inside a cold room, with the controls, pump, and recording system outside it. The loading column consisted of two 32 cm diameter MTS compression platens (one at the top and one at the bottom of the specimen), a spherical seat, and a 0.91 MN capacity load cell. The lower platen was attached to the actuator and the upper platen reacted against the load frame through the spherical seat and the load cell.
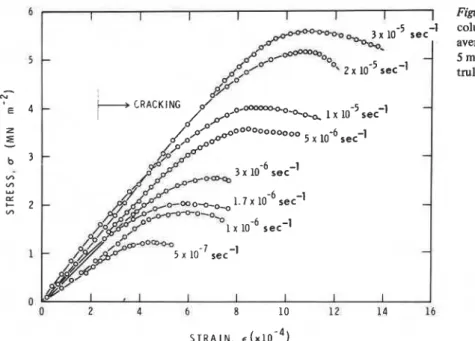
Figure I Stress-strain results for I columnar-grained S-2 ice o f average grain diameter of 4 to 5 mm at - 10' C subjected to truly constant strain rates.
that of the cold room, set during this series of experiments at - 10" C. A thermistor was placed between a pair of specimens to record the actual temperature. The temperature variation was never more than
*
0.2" C from - 10" C during the four days of testing.The machine could be programmed to apply various amounts and rates of load, strain, and displacement. Strain rate was recorded and con- trolled by a 2.5 cm gauge-length MTS extenso- meter attached directly to the central area of the 10 cm
x
25 cm face of the specimen. Load and the strain outputs were recorded separately as func- tions of time t o permit comparison with earlier observations [ I ] .2.4. T y p e o f testing
Compressive loads were applied t o the 5 cm x
10 cm faces of the specimens and thus normal to the length of the columnar grains. Ten of the specimens were tested under constant strain rates, P , in the range 'of 5
x
to 5 x lo-' sec-' ; five were tested under constant stress rates, b, in the range of 1 x t o 8x
MN m-2 sec-' ; one was damaged during the initial trial run.2.5. Test procedures
Procedures, including those for recording cracking activity, recovery strain after yield, and micro- structural examinations including determination of grain size, followed as closely as possible the
methods used earlier [ I ] . The specimens were brought back to Ottawa for microstructural analysis using the precautions described for taking them t o Houston.
3. Results and analysis
3.1. Tests a t constant strain rates
3.1.
I .
General observationsAU
the specimens tested in the range of 5 x lo-' to 3 x lo-' sec-' exhibited a distinct upper yield, with load decreasing after it reached a maximum value. The measured strain rates were constant and did not vary by more than an error of measure- ment of about 1.0% from the applied rates. Fig. 1 gives the stress-strain diagrams for all tests. The end of each curve shows the stress, strain and, hence, time when the specimen was unloaded. The strain associated with the initiation of internal cracking is also shown.The number of internal cracks at the time of unloading increased with increase in strain rate, as shown in Fig. 2. The cracks were long and narrow, and parallel to the length of the columnar grains, similar t o those observed by Gold [9] during uniaxial constant load creep experiments. The specimen tested at 5 x sec-' did not,however, develop any visible cracks and stayed clear and transparent during the entire loading period. On removal of load after yield a few minute cracks developed suddenly in the specimen during the unloading time
(<
0.5 sec).Figure 2 Specimens after unloading and complete recovery. Note the increase in crack density and strain rate.
It should be mentioned that the actual strain was high because of the low strain level and it was rate experienced by the sample deformed at not certain whether this change occurred at a 5 x sec-I could have been slightly lower constant rate during the loading period.
owing to drift. The estimated maximum change Two tests were carried out at a strain rate of was - 1.8 x sec-'. The signal-to-noise ratio 5 x lo-' sec-l. Both specimens failed by splitting.
6 I I
30 Figure 3 Dependence of yield or fail-
-
N ure stress and strain on constant
E
-
strain rate for columnar-grained S-25
-
-'25 ,I ice of average grain size of 4 to 5 mmZ d I at - 10" C.
-
-
b 4 - 20 =- "7-
"7 a w LL re + "7z
3 --
15 w w LL (r 3 f 3 -I-
-I a re LL 0 0 a a 2 2 1 - LU r = 7.3 O. l8-
f 5=
> 2-*
The first failed at a stress of 4.5 MNm-2 after a loading time of 19sec. Examination of the sample end surfaces disclosed signs of damage, probably caused by sublimation during storage. The test was therefore repeated with another specimen whose end surfaces were smoothed by hand using emergy paper. This specimen also failed by splitting, but it took longer (21.25 sec)
and had a higher strength (5.6MNm-'). The
average stress-rates to failure in the two tests were 0.24 and 0.27 MNm-2 sec-', but the stress rate during loading was nearly constant at
0.3 1 MN m-2 sec-' until splitting started to
occur. This splitting type of failure will be called
"premature" failure in accordance with the
terminology used earlier [ I ] . It was not possible to investigate the effect of end conditions or t o carry out tests at higher strain rates owing to the lack of specimens.
3.1.2. Strength-strain-rate relation
The dependence of strength, of, on strain rate,
P,
isshown in Fig. 3, including the premature failures. The uncertainty in the strain rate for the slowest test is also indicated. As the total strains at failure in all the tests were very small (less than 1.2 x see Fig. 3), the stresses estimated from the loads and cross-sectional areas of the specimens can be considered to be true stresses. The maximum stress for the yield type of failure was found to vary with strain rate according to the following dimensionally-balanced relation
where o1 and
P1
are the unit or reference stressand strain rates, respectively.
Least-squares regressional fit of the results gave
P = 212 and p = 0.345 with a correlation coef-
ficient of 0.989 (see Table I). The slowest test
T A B L E I Results of regression analyses (using stress in MN m-Z and time in sec)
Equation Equation Coefficient Exponent Correlation
result was excluded because of the uncertainty in
6 . With the above values of the coefficient and the exponent, Equation 1 can be written as
where ol = 1 MNm-2 and 6 , = 1 sec-'. Note the resemblance of the form of the above relation to the dependence of stress and steady-state or, strictly speaking, the minimum strain rate in creep tests under constant stress and temperature commonly observed in polycrystalline materials, including ice at high homologous temperatures [lo, 111.
3.1.3.
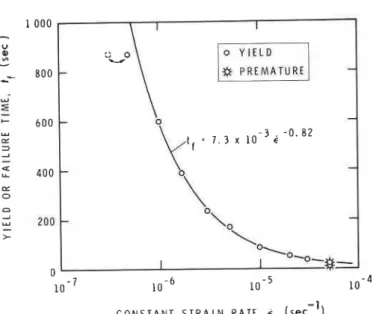
Failure timeThe dependence of time to reach yield stress, tf,
on strain rate is shown in Fig. 4, which also indi- cates the uncertainty in the slowest test. The dependence of tf on
t
can be represented bywhere t, is the unit or reference time.
Application of the least-squares fit, excluding the slowest test result, gave Q = 7.3 x and q = 0.82 with a correlation coefficient of 0.999 (Table I). With these values of the constants Equation 3 gives
where t, = 1 sec.
Figure 4 Dependence of yield or fadure time on constant strain rate for S-2 ice at
- lo0
c.
The yield stress for the slowest test agrees well with the best-fit curve (Fig. 3) if the estimated maximum correction to the strain rate is applied; on the other hand, the failure time agrees better with the best-fit curve (Fig. 4) if no correction to the strain rate is made. This indicates that the actual specimen strain rate was perhaps somewhere between the two values.
Equation 4 is similar to that which has been generally observed for the dependence of creep rupture time at constant temperature on the corresponding secondary or steady-state strain rate. Creep rupture time in metals and other polycrystalline materials has been noted as approximately inversely proportional to the steady-state creep rate.
3.7.4. Dependence of failure time on yield stress
Interdependence of failure time and failure stress can be obtained from Equations 1 and 3 giving
Substitution of the numerical values of P, Q, p and q from Table I in Equation 5 gives
There is a remarkable similarity between Equation 6 and the dependence of creep rupture time on stress for metals and alloys at high temperatures [ l o , 12,131.
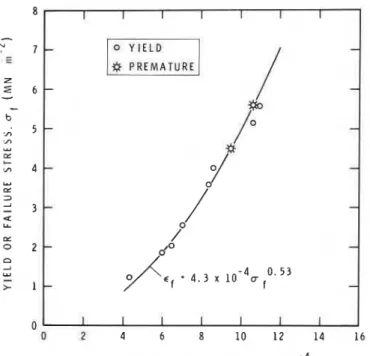
Figure 5 Stress dependence of strain at yield or failure.
3.1.5.
Failure strain-s train-ra te relation strain rate in metals and alloys [14, 151. A relation For conditions of constant rate of strain, the failure of the form of Equation 7 with a constant for ~f strain, ef, is given by the product of 6 and tf: has been widely accepted [lo, 161.6 tf
ef = :-. (7)
3.1.6.
Stress and strain at failure€1 tl Equation 8, in conjunction with Equation 1, gives
Substitution in Equation 7 of tf/t, from Equation 3 the important interrelation of the failure strain gives the dependence of failure strain on the and failure stress:
imposed strain rate,
or, using the values in Table I,
(1-4)IP
(8)
which, on substitution of the numerical values of the constants from Table I, reduces to
Figs 3 and 4 show that strain at yield does not vary with strain rate as much as with of and ti.
For the increase in 6 of almost two orders of magnitude, E, increased by a factor of only about 2.5 compared with an increase of 5 times in of (Fig. 3) or a decrease of 25 times in tf (Fig. 4). Analogous behaviour has been observed in metals and alloys during tensile creep rupture or fracture experiments, and creep ductility has been found to be relatively insensitive to a wide variation of stress and creep life. When nucleation and growth of cavities are responsible for creep failure, the strain at fracture has been reported to be almost independent of stress and hence of steady-state
Yield strain is thus nearly proportional t o the square-root of the yield stress, indicating a low sensitivity of ef on of. This bears a close resem- blance to the proposed relation of Greenwood [15] of ef a: 0°'4 for creep fractures in metals at
high temperatures. Equation 11 is compared with the experimental results in Fig. 5. The failure strain for the slowest test is shown here without applying any correction. Note the results for the premature failures.
3.1.7.
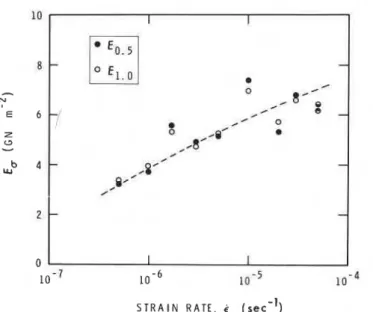
Initial modulusIt is customary in engineering practice to deter- mine a tangent modulus from the initial slope of
Figure 6 Dependence of secant modulus,
E,, to the stress, o, on strain rate for columnar-grained S-2 ice of average gain
diameter of 4 to 5 mm at - 10' C.
the stress-strain curves. The error in determining these slopes, and hence the moduli, was, however, thought t o be due largely to uncertainty in the loading conditions during the initial period and the errors in measuring the stresses and, particularly, the strains at low levels. Moreover, these moduli were thought t o be ambiguous because of the curvature in the stress-strain curves, unless the sections of the stress-strain curves were specified. Nonetheless, Fig. 1 shows a general increase in the initial slope of the stress-strain curve with increase in strain rate. To avoid the ambiguity of the customary eye-fitting, the secant modulus, E,, t o the fixed initial stress level of u = 0.5 or 1 .O MNm-' was determined. Both are shown in Fig. 6. The results are rather scattered, but indi- cate that the stress-strain curves are not far from linear up t o the stress level of 1 MNm-'. The trend, however, towards an increase with increase in strain rate is clear and agrees numerically with previous experimental observations of Traetteberg
et al. [2] for a stress level of about 0.3 M N ~ - ' for the same type of ice and is consistent with a viscoelastic model of this behaviour presented by Sinha [ l 7 ] .
A
l
l
the moduli reported here are considerably lower than the Young's modulus of about 9.5 GNm-' determined earlier for the same type of ice, loading direction, and temperature [7]. The initial modulus of about 6.2 GNm-' obtained for the two tests at 6 = 5 x lo-' sec-' (Fig. 6) is also significantly less than the Young's modulus of ice. Thus, the conditions for brittle-like prematurefailures, noticed in both the tests mentioned, were far from the "pure elastic" conditions.
3.2. Tests at constant stress rate
3.2.1. General observations
It was decided to perform tests at constant stress rates of less than 1 x lo-' MN m-' sec-' in order t o avoid the initiation of premature failure. This was prompted by the fact that both the tests performed at 6 = 5 x lo-' sec-' failed prematurely by splitting and had nearly constant stress rates of about 3
x
lo-' MNm-2 sec-' during the pre- splitting period.Stress-strain diagrams for the five tests are shown in Fig. 7. The crack-forming rate and strain rate increased with time for each specimen. It was difficult t o decide how long t o continue a test because there were n o defined criteria or definitions for failure under these conditions. The sample tested at u = 8 x MNm-' sec-' was perhaps unloaded too early, although the stress level reached in this case might not differ greatly from the possible maximum value. Only the stress rate dependence of less ambiguous quantities such as failure stress (the observed maximum stress) and the initial modulus will be discussed, because the failure time, and, hence, the failure strain, were uncertain. The results are considered t o be preliminary.
3.2.2.
Strength-s tress-ra te relationThe dependence of the observed "quasi"-maximum stress, om, on the stress rate, u , was of the form
I I I I I I I
6 = 8 x lo-' : SPECIMEN FAILED BY'FRAGMENTATION
'
1
1
b = 4 I UNLOADED WHEN
Figure 7 Stress-strain results for columnar-grained S-2 ice o f average grain diameter o f 4 t o 5mm at - 10' C for various constant stress rates.
'Jm
- = R
(2):
'J1 (12)
in which u1 = 1 M ~ r n - ' sec-'. Equation 13 is compared with the observed values in Fig. 8. where R and r are constants.
A least-squares regression analysis of the data
3-2.3-
Initialgave R = 12.4 and = 0.23, with a correlation Uncertainties in determining the initial tangent coefficient of 0.995 ( ~ ~ b l ~ 1). substitution of modulus in the present cases are similar to those these values of R and r in Equation 12 gives for the constant strain-rate condition. The secant
0.23 modulus, E,, t o o = 0.5 and 1.0MNm-' were
om
- - - 12.4(:) , (13) therefore determined.
01 Fig. 9 shows scattered results but indicates
0
10- l l o 0
Figure 8 Stress-rate dependence of strength
-
N 10 I 1 Figure 9 Dependence of the secant modulus
on constant stress rate for columnar-grained E
S-2 ice of average grain diameter of 4 to
Z 0 8
-
5mmat-10°C.-
b LU * * - - I/) C .- I 6 - C-
2 0 ,Ir C fl ,// 0 ,O 0-
Y I/) 2 2 --
a-
I--
Z-
0 I I 1 0 - I l o 0strongly that the stress-strain diagrams were not linear even in the low stress range of 0.5 to
1.0MNm-2. The trend towards an increase in the initial modulus with stress rate is also evident. All the moduli shown in Fig. 9 are, again, consider- ably lower than the Young's modulus of about 9.5GNm-2 for the ice used [7, 171. These, in turn, indicate that pure elastic loading conditions will be achieved, at the temperature under con- sideration, at rates higher than the highest rate used in the present cases. The modulus expected from Fig. 9 for a stress rate of 3 x lo-' MNm-2 sec-' is consistent with the values obtained for the two tests at a constant strain rate of 5 x lo-' sec-' (Fig. 6). As mentioned earlier, these had about the same stress rate before they failed prematurely. 4. Comparison with earlier investigation
4.1. Strain-rate sensitivity of strength
Now that results have been obtained with a closed- loop system for truly constant strain and stress rates, it would be useful t o compare them with results previously obtained with a conventional system.
Strength results for columnar-grained S-2 ice of average grain diameter of 4 to 5mm obtained with a conventional test machine are shown in Fig.10 as a function of nominal strain rate, in, and of average strain rate to failure, iaf [I]. A 0.1 MN capacity Instron TTDM-L machine was used. This system, including the 5cm
x
lOcm x25 cm specimens, will be called System 2 and the closed-loop system will henceforth be called System 1.
The dependence of strength on 6, and id was found to be and I 6af : (System 2) = 1.4 x lo-' E 1
(
.
(1 5) The form chosen for ~ ~ u a t i o n s ' l 4 ' and 15 is straightforward [ I ] . The coefficients give the strain rates at which strength is unity and stress exponents determine the shape of the strength- strain-rate curve. The form of the relation also permits a ready comparison of the rate sensitivity of strength, with the dependence of viscous flow on stress in pure creep to be discussed later.Stress exponents in Equations 14 and 15 are equal, within the accuracy of measurement [I]. The curves described by these relations are therefore the same in shape. The coefficients in Equations 14 and 15, however, differed significantly from each other, indicating a shift in the two curves on the strain-rate axis (Fig. 10). Thus, the same strength is obtained for 6, of about two and a half times greater than 6&. A unit strength of 1 MNm-2, for example, will be obtained at 6, = 3.4
x
sec-' compared toPd = 1.4 x sec-'
.
The results of the present series, using the closed-loop machine (System I), can be compared with the results of System 2 described above by
Figure 10 Strain rate dependence of yield or failure stress and stress dependence of viscous flow rate of S-2 ice at - lo0 C.
Using the values of P and p from Table I, this reduces to
P
- (System 1) = 1.81 x lo-'
el
(17) The stress exponents of Equations 14, 15 and 17 are almost the same, but the coefficient of Equation 17 is comparable to that of Equation 15 rather than to that of Equation 14. Thus, the dependence of strength on average strain rate appears to be in better agreement with the results of true constant strain rate tests than with those of nominal strain rate (Fig. 10).
4.2. Time and strain aspects of tests
The observations made in the previous paragraph may be coincidence. Examination revealed that specimens tested in System 2 tests took longer to yield or fail and underwent a greater strain than those that had the same failure or yield stress tested in System 1 . This may be seen by compar- ing Equations 6 and 1 1 , respectively, with the following relations developed for System 2 [I].
t f - (System 2) = 3.4 x lo3 t l
i:)-2-3
(18) \ , and ef (System 2) = 4.7 x)
(;
(1 9) The similarities between Equations 6 and 18, and 1 1 and 19 are encouraging, consideringthat Equations 18 and 19 were developed with procedures totally different from those used for Equations 6 and 1 1 . Equations 6 and 18 differed mainly in their coefficients, whereas Equations 1 1 and 19 differed primarily in the values of their stress exponents. Work is in progress to establish the reasons for these differences in the responses of the two test systems. From the phenomenological point of view, it may be seen from Equations 11 and 19 that the soft system, System 2, deforms material more than the stiffer system, System 1, in inducing failure at the same failure stress.
4.3. Failure modulus
To carry the question further, consider the "failure modulus",
Ef,
defined as the ratio of yield or failure stress and the corresponding strain,Failure modulus is essentially the secant modulus at failure. From Equations 10 and 20 and from Table I, or from Equations 1 1 and 20:
Ef
(System 1) = 2.31 x lo3( )
(21) From Equations 19 and 20%
0 SINHA, 1981, CLOSED-LOOPI
SINHA, 1979, CONVENTIONAL SYSTEMComparison of Equations 21 and 22 and of the corresponding experimental results are shown in Fig. 11. The trends in the responses of the two systems are quite evident, although Equation 21 describes the experimental results of System 1 better than does Equation 22 for the corresponding results of System 2. It seems that the harder the system the less the ductility of the material.
It would be useful to relate E f to the imposed loading conditions, that is, to the imposed strain rate. This can be achieved in System 1 by sub- stituting o f / o l from Equation 1 and e f from Equation 8 into Equation 20, giving
E f (System 1) = (23)
In Equation 23 introduction of the numerical values of the constants from Table I gives
E f (System 1) = 2.90 x lo4 ) 0 1 6 3 . (24)
In the conventional test system, System 2, an unequivocal relation of the above type cannot be obtained because of the non-constancy in the strain rate leading to the uncertainty of the
Figure I 1 Dependence of failure modulus on maximum stress as observed on a closed- loop system and on a conventional test machine.
loading conditions. It was therefore decided to derive the dependence of E f on both
en
and Paf In Equation 22 substitution of a f / o l from Equations 14 and 15, respectively, givesE f (System 2) = 7.27 x lo3
(
T (25)and
E f (System 2) = 7.76 x lo3 E ) " O a 2 . 7 (261
Calculations based on Equations 24 to 26 are shown in 'Fig. 12, together with the relevant experimental observations. The deviations in the response of the two systems above a strain rate of about lo-' sec-' are noticeable. This coincides well with the observation that internal cracks formed during laading for strain rates sec-I and above, but not at 5
x
lo-' sec-' in the present series of System 1 tests (Fig. 2); cracks were observed to form at strain rates 5 x lo-" sec-' or above for System 2 [I]. Micromechanical processes during deformation are under examination to establish whether the two system started to deviate markedly as a result of internal cracking.As System 1 had an effective infinite stiffness, the corresponding E f against 6 curve can be con-
6 .
I r I I
-
%# SINHA, 1981, CLOSED-LOOP TESTS E , = 29 ,+ 0.16Y
-
Z
w
-
0 SINHA. 1979. AVERAGE STRAIN RATE TO PEAK STRESS, iafu- 4
-
1/1 3 A - 0.08 CL 0 0 a 1sidered as the limiting one. Because of the factors controlling the deformation behaviour during a
test, it appears that the dependence ofEf on P for
a true constant strain rate condition cannot be obtained from a conventional test system, not
even using average strain rate to failure,
t d .
4.4. Creep under constant stress
Discussion of the strain-rate sensitivity of the deformation behaviour of ice would be incomplete without some consideration of the results of constant stress creep tests. For a non-linear visco- elastic model of columnar-grained S-2 ice loaded perpendicular to the columns, Sinha [7] described the total creep strain in terms of elastic, delayed elastic, and viscous components. Both delayed elastic and viscous deformation were shown [7] to have the same activation energy at temperatures
of - 44 and
-
10" C (0.84 Tm to 0.96 Tm, whereTm is the melting temperature). "Viscous" was
used in a general sense to describe flow leading to permanent deformation. The viscous strain-rate
I component, P,, was determined t o be
where n = 3.0 and 6,,, = 1.76 x lo-' at - 10" C
(0.96 T,). Note that the viscous strain-rate
component, while similar in form to one of the commonly used, secondary or steady-state creep- rate functions, is not necessarily intended to describe such creep. Equation 27, with the con-
stant P,, given, was thought to be valid for exper-
imental conditions where the microstructure did
Figure 12 Dependence of failure modulus on strain rate. For the conventional system the results are shown both as functions of nominal strain rate and average strain-rate to failure.
not deteriorate with the formation of internal
voids and cracks or recrystallization [7]. An
examination was later made of the possible role that grain-boundary sliding plays in the creep of polycrystalline materials at elevated temperatures [18]. It was concluded that Equation 27 should apply for conditions where accommodation by grain-boundary diffusion processes do not play a
dominating role. It was also concluded that viscous
-
creep rate was independent of grain size under these conditions, and that delayed elastic defor-
mation should be sensitive to grain size. As the ,
contribution of delayed elastic strain to total-. strain is large during the early creep period, it was further concluded that the transient creep rate should show a marked sensitivity to grain size. Grain-size insensitivity of viscous creep rate has since been verified experimentally by Duval and Le Gac [19] for ice of grain diameter 1 to lOmm
at 0.97 Tm (- 7" C) for a stress of o/E x 5 x lo-'.
The effect of grain size on transient strain in creep can be seen in the work of Garofalo et al. [20] on an iron-base austenitic alloy at 0.55 T, (704" C).
The numerical values of both the coefficient
and the stress exponent in Equation 27 at - 10" C
agree remarkably well with the corresponding values in Equation 17. The stress dependence of the viscous creep rate in creep under constant stress, therefore, appears to agree numerically with the strain-rate sensitivity of the upper yield stress for a truly constant strain rate. Fig. 10 illustrates this and indicates that the stress depen- dence of the viscous creep rate agrees well with the strength results for conventional screw-driven
machines if they are presented in terms of average strain rate (see Equation 15) rather than nominal strain rate (Equation 14). Note also the differences in the grain diameter (3 mrn) of the materials originally used during creep experiments in devel- oping Equation 27 and in the present (System 1) and the System 2 strength tests (4 to 5 mm).
No published evidence could be found for any other polycrystalline material of a one-to-one corre- spondence in either the coefficient and exponent for the Pv - o relation in creep or P - of relation in strain-rate experiments. There are innumerable examples of equations of the form of Equation 27, known as Norton's law, for describing the depen- dence of steady-state or, more accurately, minimum creep rate on stress [lo, 21-23] as well as the dependence of flow stress on strain rate [24]. This power law is commonly used to describe the dependence of quasi steady-state flow stress on strain rate in metals and alloys during superplastic flow [25, 261. The question arises as to whether the absence of the above-mentioned correspon- dence for other materials is due to the fact that most so-called constant strain rate experiments were actually performed under constant cross- head rates rather than under truly constant strain rate.
If the above-mentioned correspondence in ice is not just a coincidence, then this, in conjunction with the observed grain-size insensitivity of viscous flow, leads to speculation that the upper yield strength should be independent of grain size at constant strain rate and temperature at high temperatures. There are no experimental results available for ice to permit one to examine this aspect, except for those of Wang [8] who tested natural sea-ice from the Arctic with the same machine as that used in the present series of experiments; his results, however, were highly scattered. The insensitivity of tensile yield strength to grain size above 0.5 T, that has been observed in metals [lo] lends some support to this con- clusion, particularly in view of the parallelism shown for interdependencies of of, t f , ef and P obtained in the present study and the interrelation of corresponding quantities in tensile creep failures in other materials.
4.5. Stress-rate sensitivity of strength
In a constant cross-head rate test, as mentioned earlier, the stress rate was observed to be nearly constant up to about 90% of the corresponding
yield stress. This stress rate during loading, Up, as well as the average stress rate to yield, ud, varied systematically with cross-head rate or nominal strain rate. Thus, the relation of yield stress, of, and
cilz and dd could be developed [I]. On conversion to the form of Equation 13 these interdepen- dencies at - 10' C are given by
of
-
(System 2) = 1 1.3 -r 01 (::)0.3' (28) and of-
(System 2) = 11.7 01Although these relations were formulated
primarily to examine the effect of system stiff- i
ness on strength, it is of interest that the power- law dependence of "strength" on stress rate does, in fact, apply to truly constant stress rates. The
coefficients in Equations 28 and 29 agree well
.
with that in Equation 13. The stress-rate exponentsin Equations 28 and 29 are, however, consider- ably greater than that in Equation 13. This results, in System I , in higher values in the range tested, as shown in Fig. 13. The illustration also shows that
bd in the conventional system seems to give marginally better agreement with System 1 than bQ. As bd can be estimated from of and tf with- out any additional effort, its use is particularly recommended where information on strain is not available, as is often the case for field tests.
5. Transition to true brittle failure
Equation 24 was developed from data over a limited range of strain rates. It should not be extrapolated outside that range without due consideration of the physical processes that occur during loading. On the high side of the strain-rate
scale, the application of Equation 24 is certainly j
limited because the modulus, E f , cannot be greater I
than the Young's modulus of ice, E. Ifit is assumed j
that E = 9.5 GN m-2 [7], then Equation 24 gives 1 P = 1 .l x sec-' for
Ef
= E and prescribesthe minimum strain rate at which the loading will
i
be pure elastic.Now the stress-strain curve should be linear up to the failure point, with a slope equal to E if loading is pure elastic. This means that the initial modulus should also be 9.5 GNm-2 at a strain rate of about 1.1 x sec-'
.
Fig. 6 indicates that this may be the case. The corresponding stress rate (EP) will be 10.5 MNm-2 sec-'. Thus, the initial modulus should also be about 9.5 GNm-2 for aFigure 13 Comparison of stress-rate depen- dence of strength determined with a closed-loop system and with a conventional screw-driven machine.
constant stress rate of about 10.5 MNm-2 sec-'
.
tests giving 17.9+
2.3 MNm-2 for P, = 1.02 x The observations in Fig. 9 are consistent with this sec-' and two tests of 15.1 and 15.8 MNm-2 possibility. for 6, = 1.02 x l ~ ~ s e c - ' at - 10' C (0.96 T,).These discussions strongly support the idea that Such high unconfined compressive strengths for the conditions for pure elastic loading are polycrystaUine ice (though only about E/500) have never been reported before, except for the
P (elastic)
>
1.1x
sec-' (30)results of Parameswaran and Jones [29] who
and found a strength of 24
+
12 MNm-2 at - 196' C6 (elastic) 2 10.5 MNm-2 sec-'
for
T = 0.96 Tm (- lo°C) and
d = 4 t o 5rnm. (31)
Equation 2 for a constant strain rate of 1.1 x sec-' and Equation 13 for a constant stress rate of 10.5 MNm-2 sec-' give, respectively, a strength of 20.9 MNm-2 and 2 1.3 MNm-'. Compared with these strength values for System 1 tests, Equations 28 and 29 for System 2 tests give, respectively, 23.4 and 23.7MNm-2 at
b1 = 6& = 6 = 10.5 M N ~ - ~ sec-' . It is of interest that these strength values, predicted for true elastic loading, are so close to each other in spite of the fact that Equations 2 and 13 and 28 and 29 were developed empirically from three independent sets of experiments.
The predicted strengths are considered hypo- thetical at this moment. They are close, however, to results reported by Haynes [27, 281 from four
(0.28Tm) for isotropic polycrystalline ice with d
=
1.5 mm atGn
= lo-' to sec-'.The test results of Haynes [27, 281 are of par- ticular interest because of the high temperatures involved. He used moulded dumb-bell-shaped specimens of length 83 mm having a gauge section of 40rnm length and 25mm diameter. The ice was isotropic and fine grained (d
<
1 mm), but it contained bubbles and had a density of 9 1 1 kg m-j. A 1.25 MN capacity closed-loop servo- hydraulic test machine equipped with an environ- mental chamber was used. Experiments were conducted at two constant displacement rates of 84.7 and 0.847 mm sec-', giving the nominal strain rates mentioned above. No strain measurements were made in the gauge sections of the specimens. As this test system was "very stiff' in comparison with the specimen, it was distinctly possible that the specimen strain rates were close to the corre- sponding nominal strain rates. This was, in fact, indicated by observations carried out on this system by Sinha and Frederking [3]. It should be mentioned also that Hawkes and Mellor [30] hadT A B L E I I Stress rate, strain rate and effective modulus calculated for a stress of 1 MN m-' at - 10' C for two grain sizes and three loading times. Calculations are based on [ 3 11
Grain Time, t Average stress rate, Average strain rate, Effective modulus, EtIE
size (set) o / t iav = et/t u
(mm) ( M N m-' sec-') (sec-I ) E , = -
Et
(GN m-')
earlier reported a strength of 8.5
+
1.3 MNm-' at-7" C for 6, = 1
x
sec-'. They used the same type of specimen geometry and ice as Haynes[27,28] but a conventional screw-driven machine of 5 kN capacity. Thus, the actual specimen strain- rate was considerably less than
&.
Hawkes and Mellor [30] reported for these test series an average strain-rate to peak-stress, ,,6 of 8.4 x+
3.7
x
lo-" sec-', but their method of strain esti- mation was doubtful. The high strengths obtained by Haynes 127, 281 were certainly due to the high strain rates and reduction of end effects resulting from his use of moulded dumb-bell-shaped speci- mens. The lower strength at the higher of the two strain rates he used is an indication of the increased uncertainty regarding premature failure due to the end effect at the higher strain rate.Sinha [17] proposed a simple, though not rigorous, method on the basis of the viscoelastic model [7] for estimating the dependence of effective modulus on the imposed loading con- ditions. This analysis was extended [31] to take account of the effect of grain size introduced in the creep model .[l8]. Examples of calculations for two grain sizes relevant to the present discussions are given in Table 11. They show that a sharp transition from viscoelastic to pure elastic loading, as indicated by E,/E, does not occur. This is more realistic and natural than the sharp transition that might be predicted by the extrapolation of Equation 24 and presented by the "equality" in Equations 30 and 3 1 .
The conditions in Equations 30 and 31, how- ever, agree remarkably well with the calculations for the coarse-grained ice given in the top horizontal line in Table 11, indicating a predominantly elastic loading, i.e., E , within 5% of E . A comparable degree of elastic loading for fine-grained ice is predicted, however, by the values given in the
bottom row of Table 11, agreeing closely with the loading conditions employed by Haynes [27, 281.
Table I1 indicates, however, that the higher rate testings of Haynes were closer to elastic loading than those at lower rates and perhaps resulted in the premature failures mentioned earlier. Thus, considerably higher strength values might be obtained with further improvement of tests. More experimentation is necessary to verify this point.
From the microstructural point of view, there seems to be a possibility of true brittle failure [32]
without any inelastic deformation. That condition, according to the present theory, will be achieved at an infinitely high rate of loading [ 3 l ] , particularly at the high temperatures under consideration, and cannot be well defined. Any discussion of a "transition" from viscoelastic to true elastic or, for that matter, from ductile to true brittle, is therefore futile unless the "transition" itself is defined and quahfied. One suggestion is to use, for practical purposes, a given E f / E value. Once this is accepted it can be shown that the required conditions for a given material will be determined not only by the rate of loading and temperature but also by the grain size and other structural features.
6. Conclusion
Unconfined compressive strength of inclusion- free, transversely-isotropic, columnar-grained S-2 ice of average cross-sectional grain diameter of 4 to 5 mm has been investigated at - 10" C (0.96 T,), for loads applied normal to the column axis, under truly constant strain rate in the range of 5 x to 5 x lo-' sec-' and truly constant stress rate in the range of 1 x to
8 x lo-' MN m-' sec-'
.
Upper yield stress increased from 1.2 to 5.6 MNm-' in the strain rate range 5 x to
3
x
lo-' sec-' , and the corresponding yield or failure times ranged from 870 to 36 sec. Tests at 5 x lo-' sec-' failed prematurely. Stress-strain curves were linear up to a load of about 1 MNm-2 and the initial modulus increased from 3 to about 7 GNm-2 in the range of strain rate investigated. Brittle-like splitting failures at 5x
lo-' sec-' do not indicate the pure elastic loading condition. It was observed that the upper yield stress increased as the cube-root of the imposed strain rate, and that the yield strain was proportional to the square-root of yield stress. Yield time was found to be inversely proportional to yield stress to the power of 2.5. Extrapolation of the failure- modulus-strain-rate relation predicts the condition for pure elastic loading and, hence, transition to true elastic brittle failure to be at a strain rate greater than 1 x sec-' for the ice and tem- perature used. Failure modulus in a conventional, soft system is considerably less than the corre- sponding modulus in a closed-loop system. The material appears to be more ductile in the con- ventional system and experiments at the same nominal strain rate take longer to complete. Results obtained with conventional systems should be used with caution.Strength increased from 2.5 to 6.8 MNm-2 in the range of constant stress rate of the experiments. It was found to increase approximately as the fourth-root of stress rate. Initial modulus increased from about 3 to about 6GNm-', but the stress- strain curves exhibited marked non-linearity, even in the stress range of 0.5 to 1.0 MNm-'. Equations giving yield stresses in terms of the stress rates during loading or average stress rate to yield, developed earlier from conventional constant cross-head rate tests, give a lower maximum stress than that which is observed in a truly constant stress rate test for the same conditions.
A one-to-one numerical correspondence was found between .the relation for strain rate and upper yield stress in the constant strain rate strength tests and the dependence of viscous creep rate on stress in the constant stress creep experiments at the same temperature. This corre- spondence also extends to results obtained with a conventional machine under constant cross-head rates provided they are expressed in terms of average strain-rate to yield. The above corre- spondence was not found for the relation con- ventionally developed between peak stress and nominal strain rate. The numerical value of the
stress exponent, however, was found to be insensitive to the response of the measuring system.
It has been shown that the observed inter- dependence among the values for compressive yield strength, strain rate, failure strain and time is very similar to the interdependence among the corresponding values in tensile creep rupture or failure tests in metals and alloys at hi&
~ ~
homologous temperatures. Thus, ice could serve ,./- )
as a good model material for deformation studies
at high homologous temperatures. ,
.- - Acknowledgements
The author is indebted to Exxon Production Research Company, Houston, Texas, for permitting the use of their test facilities for this work and to Dr T. D. Ralston who made the necessary arrange- ments. The assistance of Dr Y. S. Wang in perforrn- ing the tests is gratefully acknowledged. The author also wishes to thank Mr D. Wright for his assistance in the preparation of the specimens. This paper is a contribution from the Division of Building Research, National Research Council of Canada, and is published with the approval of the Director of the Division.
References
1. N. K. SINHA, Paper presented at 1979 Spring Meet- ing of the Society of Experimental Stress Analysis, San Francisco, May 1979; Exper. Mech. 21 (1981) 209.
2. A . TRAETTEBERG, L. W . GOLD and R. FREDER- KING, Proceedings of the 3rd International Symposium on Ice Problems, Dartmouth College, August 1975 (International Association of Hydraulic Research, Hanover, New Hampshire, USA, 1975) p. 479.
3. N . K. SINHA and R . M . W . FREDERKING, Proceed- ings of the 5th International Conference on Port and Ocean Engineering under, Arctic Conditions (POAC), Vol. 1 Trondheim; August 1979 (Norwegian Insti- tute of Technology, 1979) p. 708.
4. K . KENDALL,Proc. Roy. Soc. A361 (1978) 245. 5. B. L. KARIHALOO, ibid. A368 (1979) 483.
6. M. NAKAWO, National Research Council of Canada.
Division of Building Research, BR Note number 168, 1980.
7. N. K. SINHA, Exper. Mech. 18 (1978) 464.
8. Y. S. W A N G , Proceedings of the 5th International
Conference on Port and Ocean Engineering under Arctic Conditions (POAC), Vol. 1 , Trondheim, August 1979 (Norwegian Institute of Technology,
1979) p. 651.
9. L. W. GOLD, Phil. Mag. 26 (1972) 311.
Rupture in Metals" (MacMillan, New York, 1965) Chaps. 6 and 7.
M. F. ASHBY and H. J . FROST, "Constitutive Equations in Plasticity" edited by A. S. Argon (MIT Press. Cambridge, MA, 1975) p. 117-147.
Y. N. ROBOTNOV, "Creep Problems in Struc- tural Members" (North-Holland Publishing Co., Amsterdam, 1969) Chap. 6, p. 358.
F. K. G. ODQVIST, "Mathematical Theory of Creep
and Creep Rupture" (Chendon Press, Oxford, 1974) Chap. 10,p. 131.
J. INTRATER and E. S. MACHLIN, Acta Met. 7 (1959) 140.
G. W. GREENWOOD, 'The Microstructure and Design of Alloys" (The Institute of Metals and The Iron and Steel Institute, London, 1973) p. 91-105.
A. J. PERRY,J. Mater. Sci. 9 (1974) 1016.
N. K. SINHA, J. Glaciol. 21 (1978) 457.
N. K. SINHA, Phil. Mag. 4 0 (1 979) 825.
P. DUVAL and H. LE GAC, J. Glaciol. 25 (1980) 151.
F. GAROFALO, W. D O M E and F. GEMMINGEN,
Trans. Amer. Znst. Mech. Eng. 230 (1964) 1460.
J. E. BIRD, A. K. MUKHERJEE and J . E. DORN,
"Quantitative Relation Between Properties and Microstructure" edited by D. .G. Brandon and A. Rosen (Israel Universities Press, Jerusalem, 1969) p. 255-341.
A. G. EVANS and T. G. LANGDON, Prog. Mater. Sci. 21 (1976) 171.
M. F. ASHBY, "Fracture 1977" Vol. 1, edited by D. M. R. Taplin (University of Waterloo Press, Water- loo, Canada, 1977) p. 1-14.
24. E. W. HART, C. Y. LI, H. YAMADA and G. L.
WIRE, "Constitutive Equations in Plasticity" edited by A. S. Argon (MIT Press, Cambridge, MA, 1975) p. 149-197.
25. J. W. EDINGTON, K. N. MELTON and C. P.
CUTLER, Prog. Mater. Sci. 21 (1976).61.
26. P. M. HAZZLEDINE and D. E. NEWBURY, 'Grain Boundary Structure and Properties" edited by G. A. Chadwick and D. A. Smith (Academic Press, New York and London, 1976) p. 235-264.
27. F. D. HAYNES, U.S. Army Cold Regions Research
and Engineering Laboratory, Report number 78-27
(1978). I
28. Idem, Proceedings of the 5th International Confer- b ence on Port and Ocean Engineering Under Arctic
Conditions (POAC) Vol. 1, Trondheim, August 1979
(Norwegian Institute of Technology, 1979) p. 667-
4
681.29. V. R. PARAMESWARAN and S. J . JONES, J. Glaciol. 1 14 (1975) 305.
30. I. HAWKES and M. MELLOR, ibid. 11 (1972) 103.
31. N. K. SINHA, Proceedings of the Workshop on the * Bearing Capacity of Ice Covers, Winnipeg, Manitoba, October 1978, National Research Council of Canada, Associate Committee on Geotechnical Research, Technical Memorandum No. 123 (National Research Council of Canada, Ottowa, 1979) p. 65-77. 32. B. R. LAWN, B. J. HOCKEY and S. M. WIEDER-
HORN, J. Mater. Sci. 15 (1980) 1207.
Received 24 June
This publication i s being distributed by the Division of Building R e s e a r c h of the National R e s e a r c h Council of Canada. I t should not b e reproduced in whole o r in p a r t without p e r m i s s i o n of the original publisher. The Di- vision would be glad to b e of a s s i s t a n c e in obtaining such permission.
Publications of the Division may be obtained by m a i l - ing the a p p r o p r i a t e r e m i t t a n c e ( a Bank, E x p r e s s , o r P o s t Office Money Order, o r a cheque, m a d e payable to the Receiver General of Canada, c r e d i t NRC) t o the National R e s e a r c h Council of Canada, Ottawa. K1A OR6. Stamps a r e not acceptable.
A l i s t of allpublications of the Division i s available and m a y be obtained f r o m the Publications Section, Division of Building Research, National R e s e a r c h Council of Canada, Ottawa. KIA OR6.